

Key Insights
The Touchable Holographic Display market is poised for remarkable expansion, projected to reach an estimated USD 120 million in 2025 and exhibit a robust CAGR of 25.1% through 2033. This significant growth is fueled by the increasing demand for immersive and interactive experiences across various sectors. The consumer electronics and medical industries are emerging as primary drivers, with applications ranging from advanced diagnostic tools and surgical simulations to interactive entertainment and next-generation digital signage. The unique ability of these displays to offer a tangible interaction with holographic projections is revolutionizing how users engage with digital content, setting it apart from traditional display technologies. Furthermore, the defense sector's interest in sophisticated training and simulation environments, alongside industrial applications for complex data visualization and remote collaboration, is contributing to the market's upward trajectory. Emerging technological advancements in projection techniques, material science for interactive surfaces, and software development for intuitive control mechanisms are further underpinning this growth, paving the way for wider adoption and innovation.
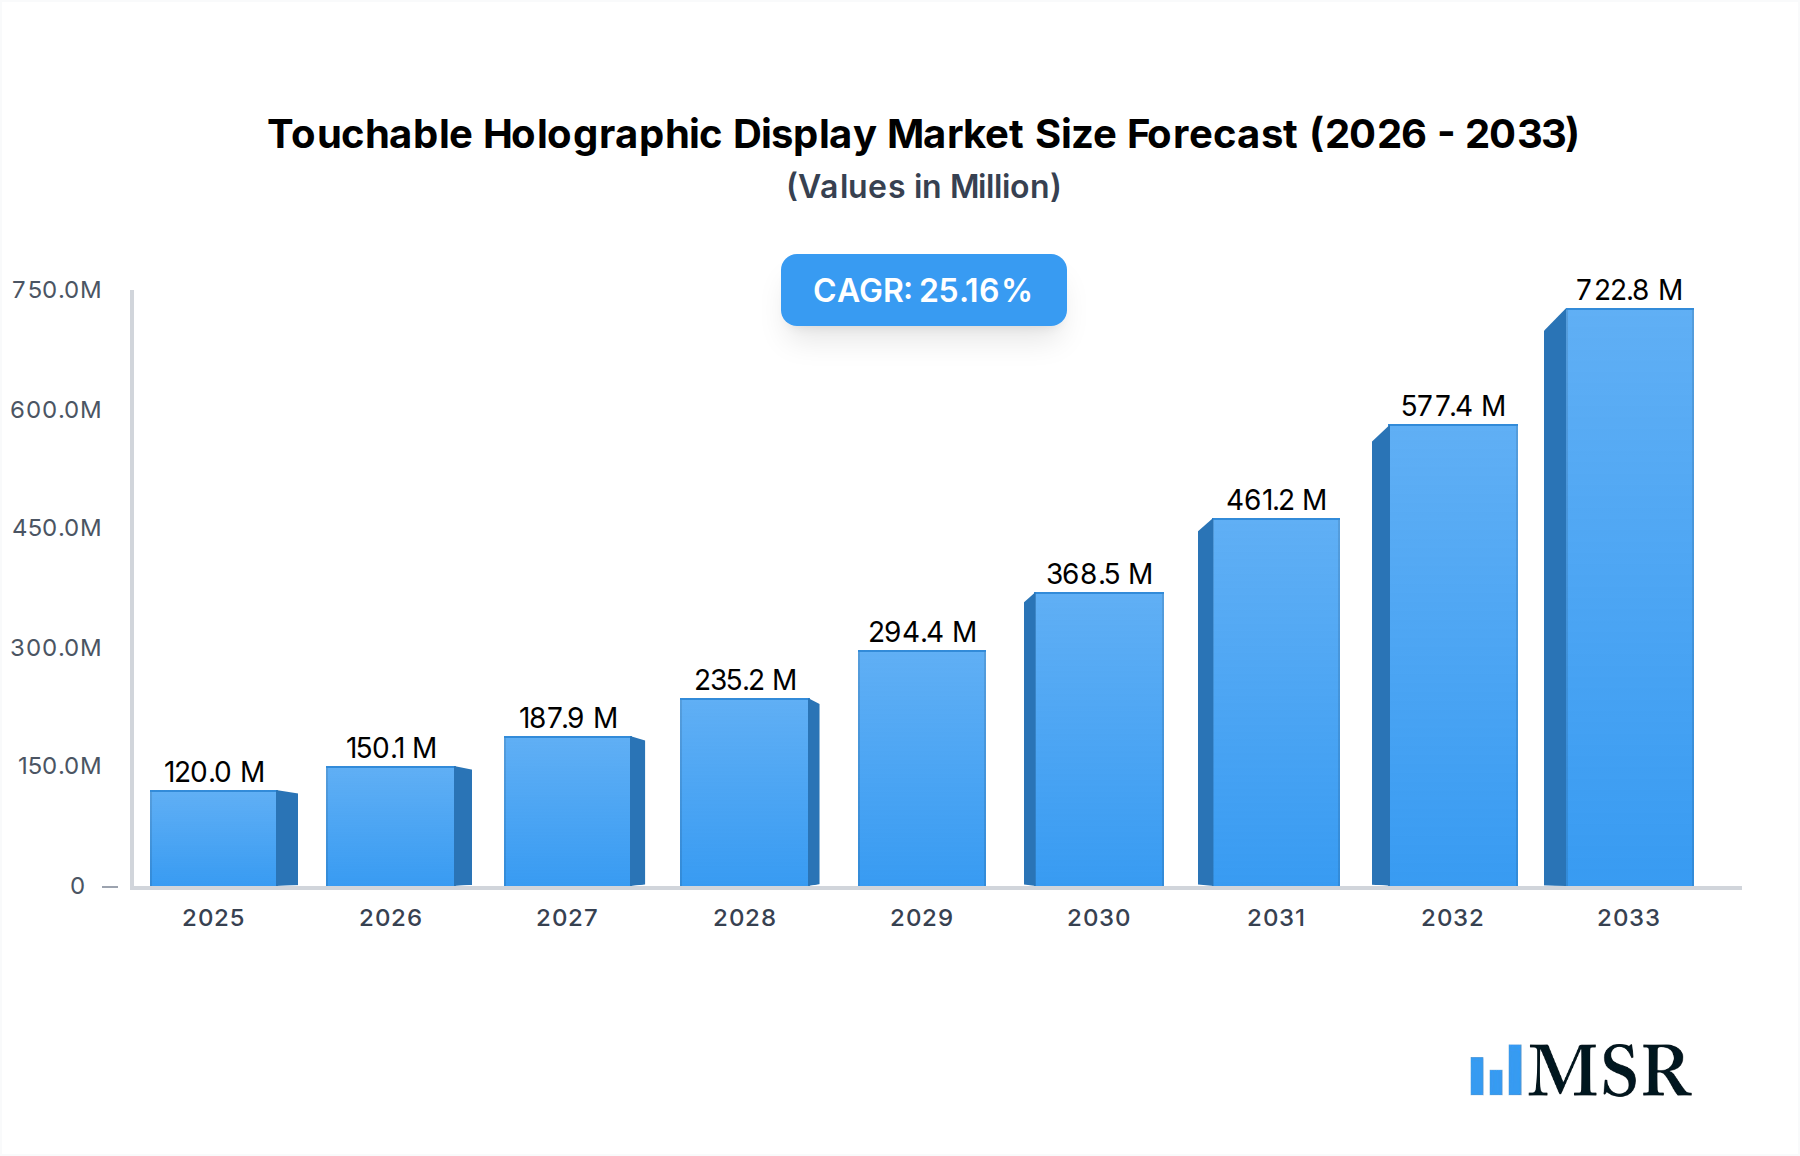
Touchable Holographic Display Market Size (In Million)
The market landscape is characterized by a dynamic interplay of diverse applications and technological advancements. Key segments include Digital Signage, Touchable Hologram Kiosks, Medical Scanners, and Holographic Projection Notebooks, each tapping into distinct market needs. While the initial investment in such advanced technology might present a restraint, the long-term benefits in terms of enhanced user engagement, improved efficiency, and novel product development are quickly overcoming these challenges. Geographically, North America and Europe are expected to lead in adoption due to established technological infrastructure and a strong appetite for innovation. However, the Asia Pacific region, driven by rapid technological advancements and a burgeoning consumer electronics market, is anticipated to witness the fastest growth. Companies like AV Concepts, Displair, Holoxica, and Real View Imaging are at the forefront of this innovation, continuously developing and refining touchable holographic display solutions. As the technology matures and becomes more accessible, its penetration into mainstream applications is expected to accelerate, making it a transformative force in human-computer interaction.

Touchable Holographic Display Company Market Share
Touchable Holographic Display Market Report: Future-Proofing Your Investment in Immersive Technology
This comprehensive report delves into the burgeoning touchable holographic display market, offering invaluable insights for investors, industry leaders, and technology innovators. Explore the competitive landscape, emerging trends, and future trajectory of a technology poised to revolutionize human-computer interaction across diverse sectors. With a focus on actionable intelligence and data-driven analysis, this report empowers stakeholders to navigate the complexities and capitalize on the immense growth potential.
Touchable Holographic Display Market Concentration & Dynamics
The touchable holographic display market exhibits a moderate concentration, characterized by the presence of innovative pioneers and emerging players. Key companies like AV Concepts, Displair, Holoxica, and Real View Imaging are actively shaping the ecosystem through continuous research and development. The innovation landscape is driven by advancements in light field technology, interactive gesture recognition, and augmented reality integration. Regulatory frameworks, while still evolving, are beginning to address safety and interoperability standards for interactive holographic systems. Substitute products, such as advanced interactive touchscreens and VR/AR headsets, are present but lack the true three-dimensional, mid-air interaction capabilities offered by touchable holograms. End-user trends highlight a growing demand for more immersive and intuitive user experiences, particularly in commercial and consumer electronics segments. Merger and acquisition activities, though not yet at a massive scale, are anticipated to increase as market consolidation begins, with an estimated xx major M&A deals expected within the study period. Market share is currently distributed, with leading companies holding an estimated combined market share of xx%.
Touchable Holographic Display Industry Insights & Trends
The touchable holographic display market is poised for substantial expansion, driven by a confluence of technological advancements and escalating demand for immersive user experiences. The market is projected to grow from an estimated xx billion USD in the base year of 2025 to a staggering xx billion USD by 2033, exhibiting a Compound Annual Growth Rate (CAGR) of xx% during the forecast period of 2025–2033. This robust growth is fueled by significant market size expansion across various applications, including medical, defense, industrial, consumer electronics, and commercial sectors. Technological disruptions, such as the miniaturization of holographic projectors, enhanced haptic feedback integration, and sophisticated AI-powered gesture recognition, are continuously pushing the boundaries of what's possible. Evolving consumer behaviors are increasingly favoring interactive and engaging digital experiences, making touchable holographic displays a compelling proposition for entertainment, education, and retail. The historical period of 2019–2024 saw foundational research and early adoption, setting the stage for accelerated growth in the coming years. The estimated market size for 2025 is xx billion USD.
Key Markets & Segments Leading Touchable Holographic Display
The touchable holographic display market is witnessing significant leadership across various key markets and segments.
Dominant Application Segment: The Medical application segment is emerging as a primary driver of growth.
- Drivers:
- Enhanced Surgical Planning & Training: The ability to visualize and interact with complex 3D anatomical models in real-time offers unprecedented opportunities for surgeons and medical students.
- Improved Diagnostic Imaging: Touchable holograms can revolutionize the interpretation of MRI, CT scans, and other diagnostic imagery, allowing for more intuitive exploration of patient data.
- Patient Education & Engagement: Visualizing medical conditions and treatment plans in a 3D, interactive format can significantly improve patient understanding and adherence.
- Economic Growth in Healthcare: Continuous investment in advanced medical technology and a growing global healthcare expenditure support the adoption of innovative solutions.
- Infrastructure Development: Modern hospitals and research facilities are increasingly equipped with the digital infrastructure to support such advanced displays.
- Drivers:
Dominant Type Segment: Touchable Hologram Kiosks are spearheading the adoption of this technology.
- Drivers:
- Interactive Retail Experiences: Kiosks offer engaging product demonstrations, virtual try-ons, and personalized shopping assistance, enhancing customer engagement.
- Public Information & Wayfinding: In large public spaces, touchable hologram kiosks provide intuitive and interactive access to information and navigation.
- Immersive Advertising: Brands are leveraging kiosks for captivating and memorable advertising campaigns that stand out from traditional methods.
- Advancements in Touch Interaction: Improved sensor technology and software algorithms are making these interactions more fluid and responsive.
- Scalability and Deployment: Kiosk solutions offer a relatively straightforward path for commercial deployment across various industries.
- Drivers:
Beyond these leading segments, the Commercial application, particularly in areas like automotive showrooms and architectural visualization, and Digital Signage for dynamic and interactive advertising, also represent significant growth avenues. The Industrial sector is exploring applications in design, prototyping, and remote collaboration, while Consumer Electronics holds immense long-term potential for gaming and entertainment.
Touchable Holographic Display Product Developments
Product innovations in the touchable holographic display market are characterized by increasing realism and interactivity. Companies are focusing on developing higher resolution displays with wider viewing angles and more precise touch recognition. Advancements in light field projection, coupled with sophisticated gesture tracking algorithms, are enabling users to manipulate virtual objects in mid-air with remarkable accuracy. This technological leap allows for applications ranging from immersive product design and simulation in the industrial sector to interactive diagnostic tools in healthcare. The competitive edge lies in the seamless integration of these technologies, creating intuitive and engaging user experiences that redefine human-computer interaction.
Challenges in the Touchable Holographic Display Market
Despite the immense potential, the touchable holographic display market faces several hurdles. The high cost of advanced holographic projection hardware and software remains a significant barrier to widespread adoption, estimated to add xx% to overall solution costs. Furthermore, the development of robust and reliable interactive software ecosystems is still in its nascent stages, requiring substantial investment in R&D. Supply chain complexities for specialized optical components and manufacturing processes can lead to production bottlenecks, impacting scalability. Lastly, intense competition from established display technologies and evolving VR/AR solutions necessitates continuous innovation to maintain market relevance.
Forces Driving Touchable Holographic Display Growth
Several key forces are propelling the growth of the touchable holographic display market. Technologically, advancements in laser and LED projection, coupled with sophisticated sensor arrays for gesture recognition, are making displays more immersive and responsive. Economically, the increasing demand for novel customer engagement strategies in retail and entertainment, coupled with the pursuit of enhanced operational efficiency in industrial and defense sectors, are significant drivers. Regulatory factors, such as emerging standards for augmented and mixed reality applications, will also contribute to market maturity and adoption.
Challenges in the Touchable Holographic Display Market
Long-term growth catalysts for the touchable holographic display market are deeply rooted in continuous innovation and strategic market expansion. The ongoing refinement of light field technology promises higher fidelity and more realistic holographic projections, opening doors for more complex applications. Strategic partnerships between hardware manufacturers and software developers are crucial for building comprehensive and user-friendly ecosystems. Furthermore, expanding into underserved markets and tailoring solutions to specific industry needs will unlock new revenue streams and accelerate market penetration.
Emerging Opportunities in Touchable Holographic Display
Emerging opportunities within the touchable holographic display market are abundant and diverse. The burgeoning metaverse and immersive virtual environments present a significant frontier for interactive holographic interfaces. The integration of haptic feedback technology will further enhance the tactile experience, bridging the gap between the digital and physical worlds. Developing specialized solutions for remote collaboration and telepresence will become increasingly crucial in a globalized workforce. Furthermore, the potential for personalized and adaptive holographic experiences in education and healthcare offers untapped market potential.
Leading Players in the Touchable Holographic Display Sector
- AV Concepts
- Displair
- Holoxica
- Real View Imaging
Key Milestones in Touchable Holographic Display Industry
- 2019: Initial commercial deployments of mid-air haptic feedback technology for interactive displays.
- 2020: Breakthroughs in laser projection technology leading to brighter and more energy-efficient holographic displays.
- 2021: Significant advancements in AI-powered gesture recognition for more intuitive user interaction.
- 2022: Emergence of early-stage holographic projection notebooks and advanced medical imaging visualization tools.
- 2023: Increased investment from venture capital firms in touchable holographic display startups.
- 2024: Growing adoption of touchable hologram kiosks in retail and public information sectors.
Strategic Outlook for Touchable Holographic Display Market
The strategic outlook for the touchable holographic display market is exceptionally bright, driven by a clear trajectory towards greater interactivity and immersion. Growth accelerators include the ongoing miniaturization and cost reduction of holographic projection hardware, coupled with the development of more intuitive and powerful software platforms. The increasing demand for novel customer experiences across retail, entertainment, and education sectors presents substantial market potential. Strategic opportunities lie in fostering cross-industry collaborations, investing in research for advanced haptic feedback integration, and tailoring solutions to the specific needs of emerging markets. The market is on the cusp of widespread adoption, promising transformative impact across numerous industries.
Touchable Holographic Display Segmentation
-
1. Application
- 1.1. Medical
- 1.2. Defense
- 1.3. Industrial Consumer Electronics
- 1.4. Commercial
- 1.5. Others
-
2. Types
- 2.1. Digital Signage
- 2.2. Touchable Hologram Kiosks
- 2.3. Medical Scanners
- 2.4. Holographic Projection Notebooks
- 2.5. Others
Touchable Holographic Display Segmentation By Geography
-
1. North America
- 1.1. United States
- 1.2. Canada
- 1.3. Mexico
-
2. South America
- 2.1. Brazil
- 2.2. Argentina
- 2.3. Rest of South America
-
3. Europe
- 3.1. United Kingdom
- 3.2. Germany
- 3.3. France
- 3.4. Italy
- 3.5. Spain
- 3.6. Russia
- 3.7. Benelux
- 3.8. Nordics
- 3.9. Rest of Europe
-
4. Middle East & Africa
- 4.1. Turkey
- 4.2. Israel
- 4.3. GCC
- 4.4. North Africa
- 4.5. South Africa
- 4.6. Rest of Middle East & Africa
-
5. Asia Pacific
- 5.1. China
- 5.2. India
- 5.3. Japan
- 5.4. South Korea
- 5.5. ASEAN
- 5.6. Oceania
- 5.7. Rest of Asia Pacific
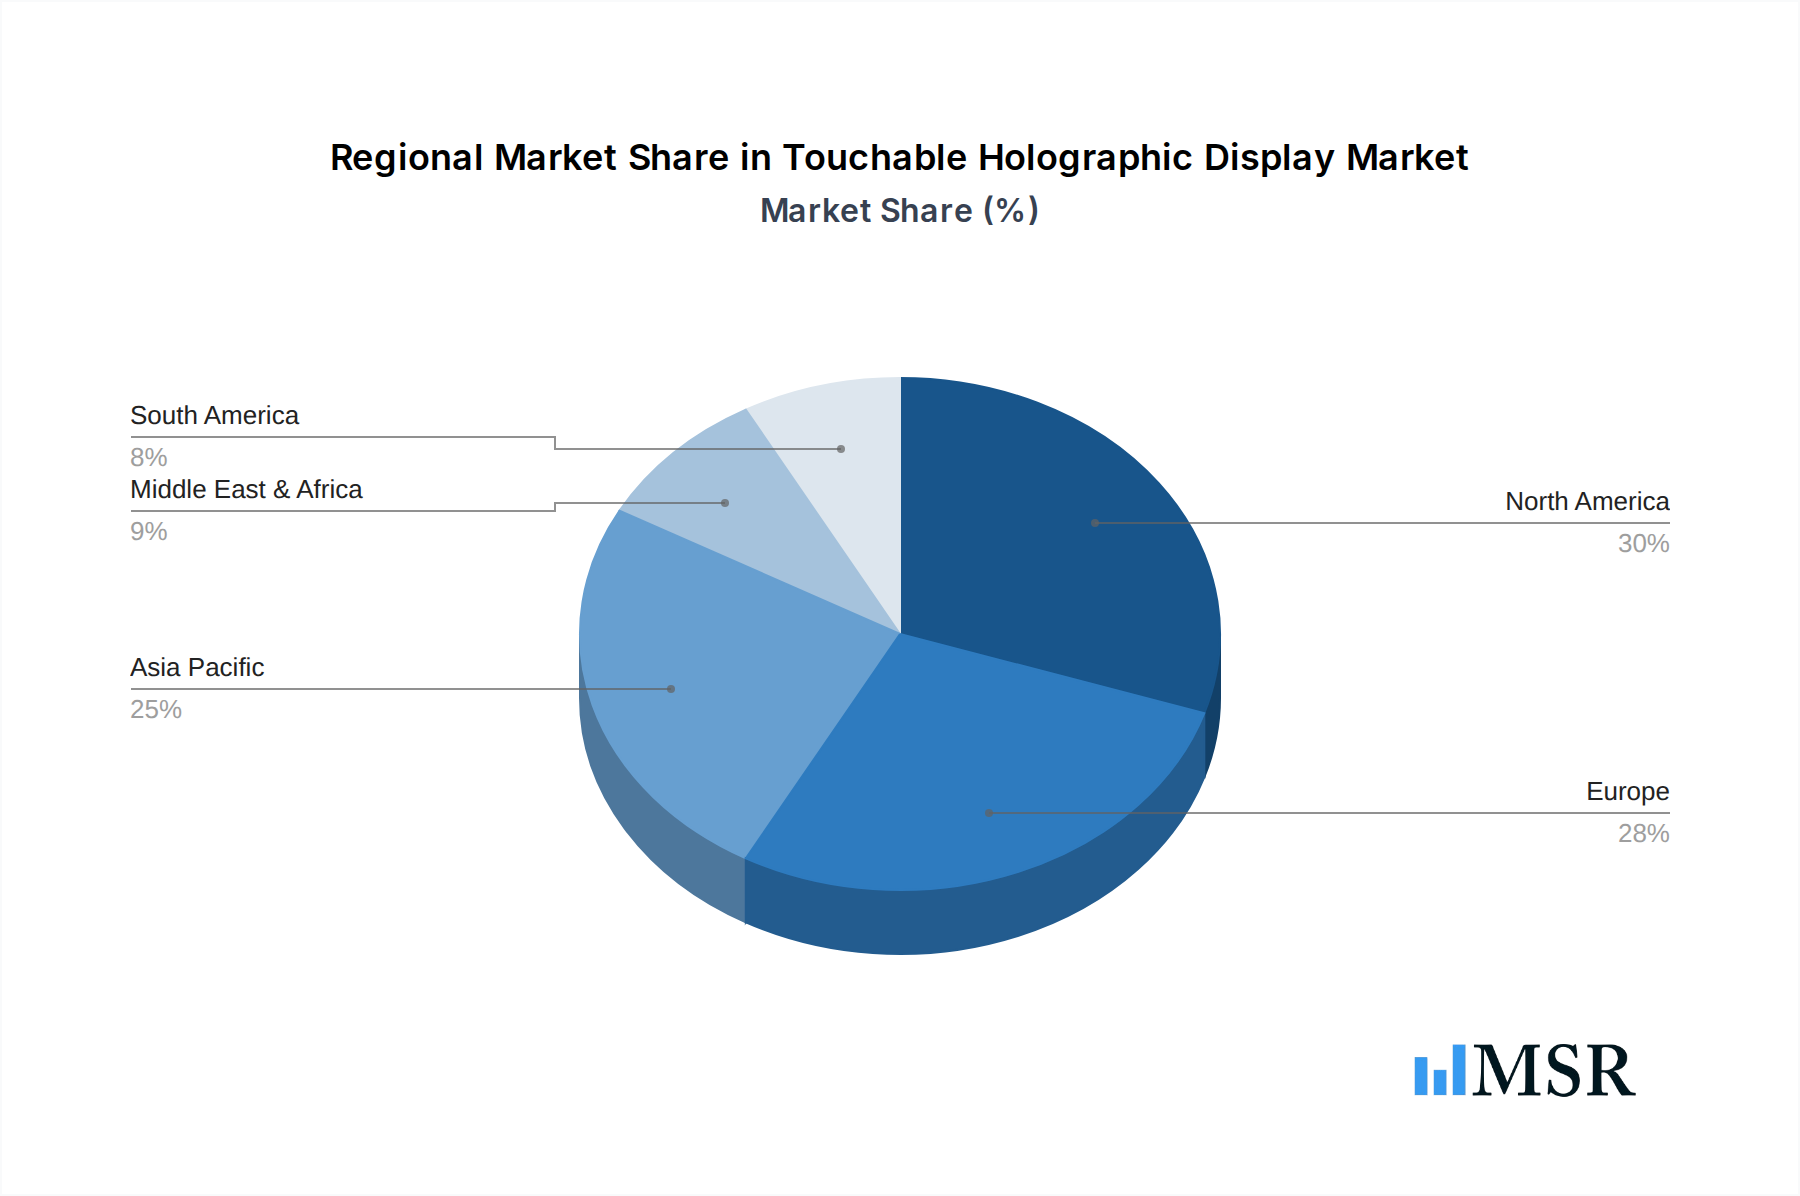
Touchable Holographic Display Regional Market Share
Geographic Coverage of Touchable Holographic Display
Touchable Holographic Display REPORT HIGHLIGHTS
| Aspects | Details |
|---|---|
| Study Period | 2020-2034 |
| Base Year | 2025 |
| Estimated Year | 2026 |
| Forecast Period | 2026-2034 |
| Historical Period | 2020-2025 |
| Growth Rate | CAGR of 25.1% from 2020-2034 |
| Segmentation |
|
Table of Contents
- 1. Introduction
- 1.1. Research Scope
- 1.2. Market Segmentation
- 1.3. Research Methodology
- 1.4. Definitions and Assumptions
- 2. Executive Summary
- 2.1. Introduction
- 3. Market Dynamics
- 3.1. Introduction
- 3.2. Market Drivers
- 3.3. Market Restrains
- 3.4. Market Trends
- 4. Market Factor Analysis
- 4.1. Porters Five Forces
- 4.2. Supply/Value Chain
- 4.3. PESTEL analysis
- 4.4. Market Entropy
- 4.5. Patent/Trademark Analysis
- 5. Global Touchable Holographic Display Analysis, Insights and Forecast, 2020-2032
- 5.1. Market Analysis, Insights and Forecast - by Application
- 5.1.1. Medical
- 5.1.2. Defense
- 5.1.3. Industrial Consumer Electronics
- 5.1.4. Commercial
- 5.1.5. Others
- 5.2. Market Analysis, Insights and Forecast - by Types
- 5.2.1. Digital Signage
- 5.2.2. Touchable Hologram Kiosks
- 5.2.3. Medical Scanners
- 5.2.4. Holographic Projection Notebooks
- 5.2.5. Others
- 5.3. Market Analysis, Insights and Forecast - by Region
- 5.3.1. North America
- 5.3.2. South America
- 5.3.3. Europe
- 5.3.4. Middle East & Africa
- 5.3.5. Asia Pacific
- 5.1. Market Analysis, Insights and Forecast - by Application
- 6. North America Touchable Holographic Display Analysis, Insights and Forecast, 2020-2032
- 6.1. Market Analysis, Insights and Forecast - by Application
- 6.1.1. Medical
- 6.1.2. Defense
- 6.1.3. Industrial Consumer Electronics
- 6.1.4. Commercial
- 6.1.5. Others
- 6.2. Market Analysis, Insights and Forecast - by Types
- 6.2.1. Digital Signage
- 6.2.2. Touchable Hologram Kiosks
- 6.2.3. Medical Scanners
- 6.2.4. Holographic Projection Notebooks
- 6.2.5. Others
- 6.1. Market Analysis, Insights and Forecast - by Application
- 7. South America Touchable Holographic Display Analysis, Insights and Forecast, 2020-2032
- 7.1. Market Analysis, Insights and Forecast - by Application
- 7.1.1. Medical
- 7.1.2. Defense
- 7.1.3. Industrial Consumer Electronics
- 7.1.4. Commercial
- 7.1.5. Others
- 7.2. Market Analysis, Insights and Forecast - by Types
- 7.2.1. Digital Signage
- 7.2.2. Touchable Hologram Kiosks
- 7.2.3. Medical Scanners
- 7.2.4. Holographic Projection Notebooks
- 7.2.5. Others
- 7.1. Market Analysis, Insights and Forecast - by Application
- 8. Europe Touchable Holographic Display Analysis, Insights and Forecast, 2020-2032
- 8.1. Market Analysis, Insights and Forecast - by Application
- 8.1.1. Medical
- 8.1.2. Defense
- 8.1.3. Industrial Consumer Electronics
- 8.1.4. Commercial
- 8.1.5. Others
- 8.2. Market Analysis, Insights and Forecast - by Types
- 8.2.1. Digital Signage
- 8.2.2. Touchable Hologram Kiosks
- 8.2.3. Medical Scanners
- 8.2.4. Holographic Projection Notebooks
- 8.2.5. Others
- 8.1. Market Analysis, Insights and Forecast - by Application
- 9. Middle East & Africa Touchable Holographic Display Analysis, Insights and Forecast, 2020-2032
- 9.1. Market Analysis, Insights and Forecast - by Application
- 9.1.1. Medical
- 9.1.2. Defense
- 9.1.3. Industrial Consumer Electronics
- 9.1.4. Commercial
- 9.1.5. Others
- 9.2. Market Analysis, Insights and Forecast - by Types
- 9.2.1. Digital Signage
- 9.2.2. Touchable Hologram Kiosks
- 9.2.3. Medical Scanners
- 9.2.4. Holographic Projection Notebooks
- 9.2.5. Others
- 9.1. Market Analysis, Insights and Forecast - by Application
- 10. Asia Pacific Touchable Holographic Display Analysis, Insights and Forecast, 2020-2032
- 10.1. Market Analysis, Insights and Forecast - by Application
- 10.1.1. Medical
- 10.1.2. Defense
- 10.1.3. Industrial Consumer Electronics
- 10.1.4. Commercial
- 10.1.5. Others
- 10.2. Market Analysis, Insights and Forecast - by Types
- 10.2.1. Digital Signage
- 10.2.2. Touchable Hologram Kiosks
- 10.2.3. Medical Scanners
- 10.2.4. Holographic Projection Notebooks
- 10.2.5. Others
- 10.1. Market Analysis, Insights and Forecast - by Application
- 11. Competitive Analysis
- 11.1. Global Market Share Analysis 2025
- 11.2. Company Profiles
- 11.2.1 AV Concepts
- 11.2.1.1. Overview
- 11.2.1.2. Products
- 11.2.1.3. SWOT Analysis
- 11.2.1.4. Recent Developments
- 11.2.1.5. Financials (Based on Availability)
- 11.2.2 Displair
- 11.2.2.1. Overview
- 11.2.2.2. Products
- 11.2.2.3. SWOT Analysis
- 11.2.2.4. Recent Developments
- 11.2.2.5. Financials (Based on Availability)
- 11.2.3 Holoxica
- 11.2.3.1. Overview
- 11.2.3.2. Products
- 11.2.3.3. SWOT Analysis
- 11.2.3.4. Recent Developments
- 11.2.3.5. Financials (Based on Availability)
- 11.2.4 Real View Imaging
- 11.2.4.1. Overview
- 11.2.4.2. Products
- 11.2.4.3. SWOT Analysis
- 11.2.4.4. Recent Developments
- 11.2.4.5. Financials (Based on Availability)
- 11.2.1 AV Concepts
List of Figures
- Figure 1: Global Touchable Holographic Display Revenue Breakdown (undefined, %) by Region 2025 & 2033
- Figure 2: Global Touchable Holographic Display Volume Breakdown (K, %) by Region 2025 & 2033
- Figure 3: North America Touchable Holographic Display Revenue (undefined), by Application 2025 & 2033
- Figure 4: North America Touchable Holographic Display Volume (K), by Application 2025 & 2033
- Figure 5: North America Touchable Holographic Display Revenue Share (%), by Application 2025 & 2033
- Figure 6: North America Touchable Holographic Display Volume Share (%), by Application 2025 & 2033
- Figure 7: North America Touchable Holographic Display Revenue (undefined), by Types 2025 & 2033
- Figure 8: North America Touchable Holographic Display Volume (K), by Types 2025 & 2033
- Figure 9: North America Touchable Holographic Display Revenue Share (%), by Types 2025 & 2033
- Figure 10: North America Touchable Holographic Display Volume Share (%), by Types 2025 & 2033
- Figure 11: North America Touchable Holographic Display Revenue (undefined), by Country 2025 & 2033
- Figure 12: North America Touchable Holographic Display Volume (K), by Country 2025 & 2033
- Figure 13: North America Touchable Holographic Display Revenue Share (%), by Country 2025 & 2033
- Figure 14: North America Touchable Holographic Display Volume Share (%), by Country 2025 & 2033
- Figure 15: South America Touchable Holographic Display Revenue (undefined), by Application 2025 & 2033
- Figure 16: South America Touchable Holographic Display Volume (K), by Application 2025 & 2033
- Figure 17: South America Touchable Holographic Display Revenue Share (%), by Application 2025 & 2033
- Figure 18: South America Touchable Holographic Display Volume Share (%), by Application 2025 & 2033
- Figure 19: South America Touchable Holographic Display Revenue (undefined), by Types 2025 & 2033
- Figure 20: South America Touchable Holographic Display Volume (K), by Types 2025 & 2033
- Figure 21: South America Touchable Holographic Display Revenue Share (%), by Types 2025 & 2033
- Figure 22: South America Touchable Holographic Display Volume Share (%), by Types 2025 & 2033
- Figure 23: South America Touchable Holographic Display Revenue (undefined), by Country 2025 & 2033
- Figure 24: South America Touchable Holographic Display Volume (K), by Country 2025 & 2033
- Figure 25: South America Touchable Holographic Display Revenue Share (%), by Country 2025 & 2033
- Figure 26: South America Touchable Holographic Display Volume Share (%), by Country 2025 & 2033
- Figure 27: Europe Touchable Holographic Display Revenue (undefined), by Application 2025 & 2033
- Figure 28: Europe Touchable Holographic Display Volume (K), by Application 2025 & 2033
- Figure 29: Europe Touchable Holographic Display Revenue Share (%), by Application 2025 & 2033
- Figure 30: Europe Touchable Holographic Display Volume Share (%), by Application 2025 & 2033
- Figure 31: Europe Touchable Holographic Display Revenue (undefined), by Types 2025 & 2033
- Figure 32: Europe Touchable Holographic Display Volume (K), by Types 2025 & 2033
- Figure 33: Europe Touchable Holographic Display Revenue Share (%), by Types 2025 & 2033
- Figure 34: Europe Touchable Holographic Display Volume Share (%), by Types 2025 & 2033
- Figure 35: Europe Touchable Holographic Display Revenue (undefined), by Country 2025 & 2033
- Figure 36: Europe Touchable Holographic Display Volume (K), by Country 2025 & 2033
- Figure 37: Europe Touchable Holographic Display Revenue Share (%), by Country 2025 & 2033
- Figure 38: Europe Touchable Holographic Display Volume Share (%), by Country 2025 & 2033
- Figure 39: Middle East & Africa Touchable Holographic Display Revenue (undefined), by Application 2025 & 2033
- Figure 40: Middle East & Africa Touchable Holographic Display Volume (K), by Application 2025 & 2033
- Figure 41: Middle East & Africa Touchable Holographic Display Revenue Share (%), by Application 2025 & 2033
- Figure 42: Middle East & Africa Touchable Holographic Display Volume Share (%), by Application 2025 & 2033
- Figure 43: Middle East & Africa Touchable Holographic Display Revenue (undefined), by Types 2025 & 2033
- Figure 44: Middle East & Africa Touchable Holographic Display Volume (K), by Types 2025 & 2033
- Figure 45: Middle East & Africa Touchable Holographic Display Revenue Share (%), by Types 2025 & 2033
- Figure 46: Middle East & Africa Touchable Holographic Display Volume Share (%), by Types 2025 & 2033
- Figure 47: Middle East & Africa Touchable Holographic Display Revenue (undefined), by Country 2025 & 2033
- Figure 48: Middle East & Africa Touchable Holographic Display Volume (K), by Country 2025 & 2033
- Figure 49: Middle East & Africa Touchable Holographic Display Revenue Share (%), by Country 2025 & 2033
- Figure 50: Middle East & Africa Touchable Holographic Display Volume Share (%), by Country 2025 & 2033
- Figure 51: Asia Pacific Touchable Holographic Display Revenue (undefined), by Application 2025 & 2033
- Figure 52: Asia Pacific Touchable Holographic Display Volume (K), by Application 2025 & 2033
- Figure 53: Asia Pacific Touchable Holographic Display Revenue Share (%), by Application 2025 & 2033
- Figure 54: Asia Pacific Touchable Holographic Display Volume Share (%), by Application 2025 & 2033
- Figure 55: Asia Pacific Touchable Holographic Display Revenue (undefined), by Types 2025 & 2033
- Figure 56: Asia Pacific Touchable Holographic Display Volume (K), by Types 2025 & 2033
- Figure 57: Asia Pacific Touchable Holographic Display Revenue Share (%), by Types 2025 & 2033
- Figure 58: Asia Pacific Touchable Holographic Display Volume Share (%), by Types 2025 & 2033
- Figure 59: Asia Pacific Touchable Holographic Display Revenue (undefined), by Country 2025 & 2033
- Figure 60: Asia Pacific Touchable Holographic Display Volume (K), by Country 2025 & 2033
- Figure 61: Asia Pacific Touchable Holographic Display Revenue Share (%), by Country 2025 & 2033
- Figure 62: Asia Pacific Touchable Holographic Display Volume Share (%), by Country 2025 & 2033
List of Tables
- Table 1: Global Touchable Holographic Display Revenue undefined Forecast, by Application 2020 & 2033
- Table 2: Global Touchable Holographic Display Volume K Forecast, by Application 2020 & 2033
- Table 3: Global Touchable Holographic Display Revenue undefined Forecast, by Types 2020 & 2033
- Table 4: Global Touchable Holographic Display Volume K Forecast, by Types 2020 & 2033
- Table 5: Global Touchable Holographic Display Revenue undefined Forecast, by Region 2020 & 2033
- Table 6: Global Touchable Holographic Display Volume K Forecast, by Region 2020 & 2033
- Table 7: Global Touchable Holographic Display Revenue undefined Forecast, by Application 2020 & 2033
- Table 8: Global Touchable Holographic Display Volume K Forecast, by Application 2020 & 2033
- Table 9: Global Touchable Holographic Display Revenue undefined Forecast, by Types 2020 & 2033
- Table 10: Global Touchable Holographic Display Volume K Forecast, by Types 2020 & 2033
- Table 11: Global Touchable Holographic Display Revenue undefined Forecast, by Country 2020 & 2033
- Table 12: Global Touchable Holographic Display Volume K Forecast, by Country 2020 & 2033
- Table 13: United States Touchable Holographic Display Revenue (undefined) Forecast, by Application 2020 & 2033
- Table 14: United States Touchable Holographic Display Volume (K) Forecast, by Application 2020 & 2033
- Table 15: Canada Touchable Holographic Display Revenue (undefined) Forecast, by Application 2020 & 2033
- Table 16: Canada Touchable Holographic Display Volume (K) Forecast, by Application 2020 & 2033
- Table 17: Mexico Touchable Holographic Display Revenue (undefined) Forecast, by Application 2020 & 2033
- Table 18: Mexico Touchable Holographic Display Volume (K) Forecast, by Application 2020 & 2033
- Table 19: Global Touchable Holographic Display Revenue undefined Forecast, by Application 2020 & 2033
- Table 20: Global Touchable Holographic Display Volume K Forecast, by Application 2020 & 2033
- Table 21: Global Touchable Holographic Display Revenue undefined Forecast, by Types 2020 & 2033
- Table 22: Global Touchable Holographic Display Volume K Forecast, by Types 2020 & 2033
- Table 23: Global Touchable Holographic Display Revenue undefined Forecast, by Country 2020 & 2033
- Table 24: Global Touchable Holographic Display Volume K Forecast, by Country 2020 & 2033
- Table 25: Brazil Touchable Holographic Display Revenue (undefined) Forecast, by Application 2020 & 2033
- Table 26: Brazil Touchable Holographic Display Volume (K) Forecast, by Application 2020 & 2033
- Table 27: Argentina Touchable Holographic Display Revenue (undefined) Forecast, by Application 2020 & 2033
- Table 28: Argentina Touchable Holographic Display Volume (K) Forecast, by Application 2020 & 2033
- Table 29: Rest of South America Touchable Holographic Display Revenue (undefined) Forecast, by Application 2020 & 2033
- Table 30: Rest of South America Touchable Holographic Display Volume (K) Forecast, by Application 2020 & 2033
- Table 31: Global Touchable Holographic Display Revenue undefined Forecast, by Application 2020 & 2033
- Table 32: Global Touchable Holographic Display Volume K Forecast, by Application 2020 & 2033
- Table 33: Global Touchable Holographic Display Revenue undefined Forecast, by Types 2020 & 2033
- Table 34: Global Touchable Holographic Display Volume K Forecast, by Types 2020 & 2033
- Table 35: Global Touchable Holographic Display Revenue undefined Forecast, by Country 2020 & 2033
- Table 36: Global Touchable Holographic Display Volume K Forecast, by Country 2020 & 2033
- Table 37: United Kingdom Touchable Holographic Display Revenue (undefined) Forecast, by Application 2020 & 2033
- Table 38: United Kingdom Touchable Holographic Display Volume (K) Forecast, by Application 2020 & 2033
- Table 39: Germany Touchable Holographic Display Revenue (undefined) Forecast, by Application 2020 & 2033
- Table 40: Germany Touchable Holographic Display Volume (K) Forecast, by Application 2020 & 2033
- Table 41: France Touchable Holographic Display Revenue (undefined) Forecast, by Application 2020 & 2033
- Table 42: France Touchable Holographic Display Volume (K) Forecast, by Application 2020 & 2033
- Table 43: Italy Touchable Holographic Display Revenue (undefined) Forecast, by Application 2020 & 2033
- Table 44: Italy Touchable Holographic Display Volume (K) Forecast, by Application 2020 & 2033
- Table 45: Spain Touchable Holographic Display Revenue (undefined) Forecast, by Application 2020 & 2033
- Table 46: Spain Touchable Holographic Display Volume (K) Forecast, by Application 2020 & 2033
- Table 47: Russia Touchable Holographic Display Revenue (undefined) Forecast, by Application 2020 & 2033
- Table 48: Russia Touchable Holographic Display Volume (K) Forecast, by Application 2020 & 2033
- Table 49: Benelux Touchable Holographic Display Revenue (undefined) Forecast, by Application 2020 & 2033
- Table 50: Benelux Touchable Holographic Display Volume (K) Forecast, by Application 2020 & 2033
- Table 51: Nordics Touchable Holographic Display Revenue (undefined) Forecast, by Application 2020 & 2033
- Table 52: Nordics Touchable Holographic Display Volume (K) Forecast, by Application 2020 & 2033
- Table 53: Rest of Europe Touchable Holographic Display Revenue (undefined) Forecast, by Application 2020 & 2033
- Table 54: Rest of Europe Touchable Holographic Display Volume (K) Forecast, by Application 2020 & 2033
- Table 55: Global Touchable Holographic Display Revenue undefined Forecast, by Application 2020 & 2033
- Table 56: Global Touchable Holographic Display Volume K Forecast, by Application 2020 & 2033
- Table 57: Global Touchable Holographic Display Revenue undefined Forecast, by Types 2020 & 2033
- Table 58: Global Touchable Holographic Display Volume K Forecast, by Types 2020 & 2033
- Table 59: Global Touchable Holographic Display Revenue undefined Forecast, by Country 2020 & 2033
- Table 60: Global Touchable Holographic Display Volume K Forecast, by Country 2020 & 2033
- Table 61: Turkey Touchable Holographic Display Revenue (undefined) Forecast, by Application 2020 & 2033
- Table 62: Turkey Touchable Holographic Display Volume (K) Forecast, by Application 2020 & 2033
- Table 63: Israel Touchable Holographic Display Revenue (undefined) Forecast, by Application 2020 & 2033
- Table 64: Israel Touchable Holographic Display Volume (K) Forecast, by Application 2020 & 2033
- Table 65: GCC Touchable Holographic Display Revenue (undefined) Forecast, by Application 2020 & 2033
- Table 66: GCC Touchable Holographic Display Volume (K) Forecast, by Application 2020 & 2033
- Table 67: North Africa Touchable Holographic Display Revenue (undefined) Forecast, by Application 2020 & 2033
- Table 68: North Africa Touchable Holographic Display Volume (K) Forecast, by Application 2020 & 2033
- Table 69: South Africa Touchable Holographic Display Revenue (undefined) Forecast, by Application 2020 & 2033
- Table 70: South Africa Touchable Holographic Display Volume (K) Forecast, by Application 2020 & 2033
- Table 71: Rest of Middle East & Africa Touchable Holographic Display Revenue (undefined) Forecast, by Application 2020 & 2033
- Table 72: Rest of Middle East & Africa Touchable Holographic Display Volume (K) Forecast, by Application 2020 & 2033
- Table 73: Global Touchable Holographic Display Revenue undefined Forecast, by Application 2020 & 2033
- Table 74: Global Touchable Holographic Display Volume K Forecast, by Application 2020 & 2033
- Table 75: Global Touchable Holographic Display Revenue undefined Forecast, by Types 2020 & 2033
- Table 76: Global Touchable Holographic Display Volume K Forecast, by Types 2020 & 2033
- Table 77: Global Touchable Holographic Display Revenue undefined Forecast, by Country 2020 & 2033
- Table 78: Global Touchable Holographic Display Volume K Forecast, by Country 2020 & 2033
- Table 79: China Touchable Holographic Display Revenue (undefined) Forecast, by Application 2020 & 2033
- Table 80: China Touchable Holographic Display Volume (K) Forecast, by Application 2020 & 2033
- Table 81: India Touchable Holographic Display Revenue (undefined) Forecast, by Application 2020 & 2033
- Table 82: India Touchable Holographic Display Volume (K) Forecast, by Application 2020 & 2033
- Table 83: Japan Touchable Holographic Display Revenue (undefined) Forecast, by Application 2020 & 2033
- Table 84: Japan Touchable Holographic Display Volume (K) Forecast, by Application 2020 & 2033
- Table 85: South Korea Touchable Holographic Display Revenue (undefined) Forecast, by Application 2020 & 2033
- Table 86: South Korea Touchable Holographic Display Volume (K) Forecast, by Application 2020 & 2033
- Table 87: ASEAN Touchable Holographic Display Revenue (undefined) Forecast, by Application 2020 & 2033
- Table 88: ASEAN Touchable Holographic Display Volume (K) Forecast, by Application 2020 & 2033
- Table 89: Oceania Touchable Holographic Display Revenue (undefined) Forecast, by Application 2020 & 2033
- Table 90: Oceania Touchable Holographic Display Volume (K) Forecast, by Application 2020 & 2033
- Table 91: Rest of Asia Pacific Touchable Holographic Display Revenue (undefined) Forecast, by Application 2020 & 2033
- Table 92: Rest of Asia Pacific Touchable Holographic Display Volume (K) Forecast, by Application 2020 & 2033
Frequently Asked Questions
1. What is the projected Compound Annual Growth Rate (CAGR) of the Touchable Holographic Display?
The projected CAGR is approximately 25.1%.
2. Which companies are prominent players in the Touchable Holographic Display?
Key companies in the market include AV Concepts, Displair, Holoxica, Real View Imaging.
3. What are the main segments of the Touchable Holographic Display?
The market segments include Application, Types.
4. Can you provide details about the market size?
The market size is estimated to be USD XXX N/A as of 2022.
5. What are some drivers contributing to market growth?
N/A
6. What are the notable trends driving market growth?
N/A
7. Are there any restraints impacting market growth?
N/A
8. Can you provide examples of recent developments in the market?
N/A
9. What pricing options are available for accessing the report?
Pricing options include single-user, multi-user, and enterprise licenses priced at USD 3350.00, USD 5025.00, and USD 6700.00 respectively.
10. Is the market size provided in terms of value or volume?
The market size is provided in terms of value, measured in N/A and volume, measured in K.
11. Are there any specific market keywords associated with the report?
Yes, the market keyword associated with the report is "Touchable Holographic Display," which aids in identifying and referencing the specific market segment covered.
12. How do I determine which pricing option suits my needs best?
The pricing options vary based on user requirements and access needs. Individual users may opt for single-user licenses, while businesses requiring broader access may choose multi-user or enterprise licenses for cost-effective access to the report.
13. Are there any additional resources or data provided in the Touchable Holographic Display report?
While the report offers comprehensive insights, it's advisable to review the specific contents or supplementary materials provided to ascertain if additional resources or data are available.
14. How can I stay updated on further developments or reports in the Touchable Holographic Display?
To stay informed about further developments, trends, and reports in the Touchable Holographic Display, consider subscribing to industry newsletters, following relevant companies and organizations, or regularly checking reputable industry news sources and publications.
Methodology
Step 1 - Identification of Relevant Samples Size from Population Database


Step 2 - Approaches for Defining Global Market Size (Value, Volume* & Price*)

Note*: In applicable scenarios
Step 3 - Data Sources
Primary Research
- Web Analytics
- Survey Reports
- Research Institute
- Latest Research Reports
- Opinion Leaders
Secondary Research
- Annual Reports
- White Paper
- Latest Press Release
- Industry Association
- Paid Database
- Investor Presentations

Step 4 - Data Triangulation
Involves using different sources of information in order to increase the validity of a study
These sources are likely to be stakeholders in a program - participants, other researchers, program staff, other community members, and so on.
Then we put all data in single framework & apply various statistical tools to find out the dynamic on the market.
During the analysis stage, feedback from the stakeholder groups would be compared to determine areas of agreement as well as areas of divergence