

Key Insights
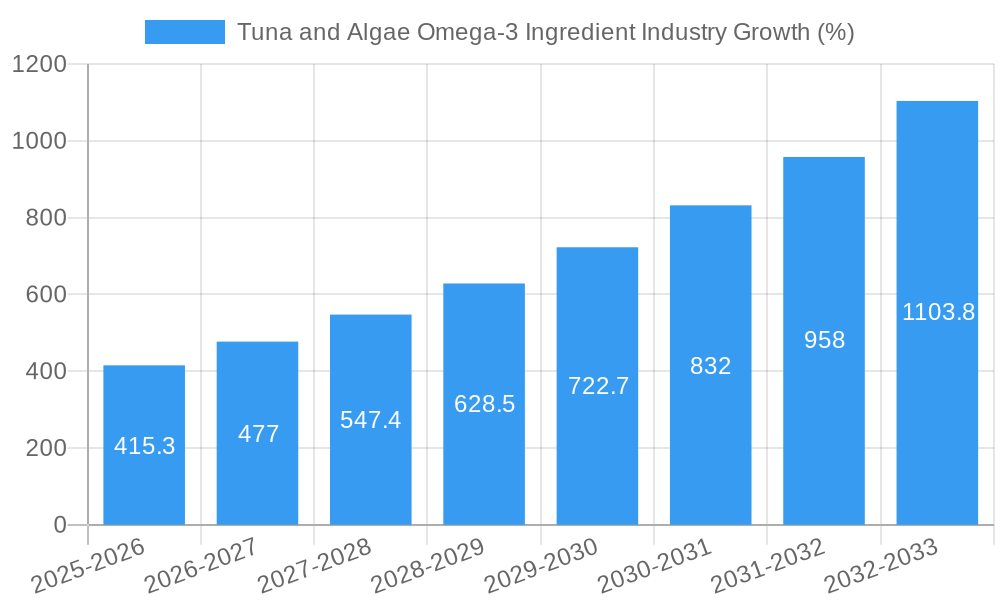
The global tuna and algae omega-3 ingredient market is experiencing robust growth, projected to reach a market size of $2,895.3 million in 2025 and exhibiting a Compound Annual Growth Rate (CAGR) of 14.03%. This expansion is driven by several key factors. The increasing consumer awareness of the health benefits of omega-3 fatty acids, particularly their role in cardiovascular health, brain function, and reducing inflammation, fuels demand for omega-3 supplements and fortified foods. The growing prevalence of chronic diseases globally further strengthens this trend. Moreover, the sustainability concerns surrounding traditional fish oil sources are pushing the market towards algae-based omega-3s, offering a plant-based, environmentally friendly alternative. The diversification of applications across food and beverages, dietary supplements, pharmaceuticals, animal nutrition, and clinical nutrition segments contributes significantly to market growth. High-concentration algae-based omega-3s are witnessing particularly strong growth due to their enhanced potency and efficacy, catering to the increasing demand for concentrated supplements. The North American market currently holds a significant share, driven by high consumer demand and established market infrastructure. However, Asia Pacific is projected to witness considerable growth in the coming years due to rising disposable incomes and increasing health consciousness.
Market segmentation plays a vital role in understanding the market's dynamics. The high concentration segment is expected to dominate, given the preference for concentrated and effective omega-3 dosages. Within applications, the food and beverage sector shows high potential, particularly through the fortification of functional foods and beverages, driven by the convenience and palatability of incorporating omega-3s into daily diets. The pharmaceutical and clinical nutrition segments are also experiencing growth, indicating an expanding use of omega-3s in targeted therapeutic applications. While some challenges exist, such as fluctuating raw material prices and potential regulatory hurdles, the overall market outlook remains positive, driven by strong consumer preferences for health and wellness and the increasing availability of sustainable, high-quality omega-3 ingredients. Established players like Archer Daniels Midland Company, BASF SE, and DSM are actively shaping the market landscape, while smaller companies specializing in algae cultivation and extraction are contributing to innovation and expanding supply.

Tuna and Algae Omega-3 Ingredient Industry: A Comprehensive Market Report (2019-2033)
This comprehensive report provides an in-depth analysis of the Tuna and Algae Omega-3 Ingredient industry, offering invaluable insights for stakeholders seeking to navigate this dynamic market. We delve into market concentration, growth drivers, key segments, and emerging opportunities, forecasting market trends from 2025 to 2033 (forecast period), building upon historical data (2019-2024). The base year for this analysis is 2025, with an estimated market size of xx Million.
Tuna and Algae Omega-3 Ingredient Industry Market Concentration & Dynamics
The Tuna and Algae Omega-3 Ingredient market exhibits a moderately concentrated structure, with several key players holding significant market share. However, the industry is witnessing increased competition from emerging companies leveraging technological advancements. Innovation is driven by the need for sustainable and high-potency omega-3 sources. Regulatory frameworks, particularly those related to food safety and labeling, are evolving and impacting industry players. Substitute products, such as fish oil, continue to compete, but the growing consumer preference for plant-based and sustainable options is shifting market dynamics. End-user trends show a rising demand for omega-3s across various applications, fueled by increasing awareness of health benefits. The number of M&A deals in the past five years has been approximately xx, indicating ongoing consolidation and strategic positioning within the industry.
- Market Share: Top 5 players hold approximately xx% of the market share.
- M&A Deal Count (2019-2024): xx
- Key Regulatory Frameworks: Vary by region; compliance is crucial.
- Substitute Products: Fish oil remains a competitor but faces challenges regarding sustainability.
Tuna and Algae Omega-3 Ingredient Industry Industry Insights & Trends
The global Tuna and Algae Omega-3 Ingredient market is experiencing robust growth, driven by increasing consumer awareness of the health benefits of omega-3 fatty acids. The market size is estimated at xx Million in 2025 and is projected to reach xx Million by 2033, exhibiting a CAGR of xx%. Technological advancements in algae cultivation and extraction are enhancing efficiency and reducing production costs. Consumer preference is shifting towards plant-based and sustainable alternatives, boosting demand for algae-based omega-3s. Health and wellness trends, along with the increasing prevalence of chronic diseases, are further propelling market growth. The rise of fortified foods and dietary supplements containing omega-3s also contribute significantly to market expansion.
Key Markets & Segments Leading Tuna and Algae Omega-3 Ingredient Industry
North America currently dominates the Tuna and Algae Omega-3 Ingredient market, driven by high consumer awareness and strong regulatory support. However, Asia Pacific is showing significant growth potential due to rising disposable incomes and increasing health consciousness.
- Dominant Region: North America
- Dominant Segment (Type): Microalgae (Schizochytrium sp.) is currently dominant, but other types are showing potential.
- Dominant Segment (Concentration): High concentration omega-3s are in high demand, reflecting consumer preference for efficient supplementation.
- Dominant Segment (Application): Food and Beverage and Dietary Supplements currently represent the largest segments.
- Drivers for North America: High per capita income, stringent food safety regulations.
- Drivers for Asia Pacific: Rapidly growing middle class, increasing health awareness, favorable government initiatives.
The demand for high-concentration products reflects a consumer preference for effective supplementation, driving innovation in extraction and processing technologies. The food and beverage industry’s integration of omega-3s into functional foods is significantly driving market growth. The pharmaceutical and clinical nutrition sectors are also experiencing considerable growth, mainly driven by the recognized therapeutic benefits of omega-3s.
Tuna and Algae Omega-3 Ingredient Industry Product Developments
Significant advancements in algae cultivation technologies, such as improved bioreactor designs and optimized nutrient delivery systems, have resulted in higher yields and improved product quality. This has led to the development of high-potency omega-3 products with enhanced stability and bioavailability. New product formulations are emerging, incorporating algae-based omega-3s into various food products and supplements, catering to diverse consumer needs and preferences. The focus on sustainability and eco-friendly production methods provides a competitive edge for many companies in the market.
Challenges in the Tuna and Algae Omega-3 Ingredient Industry Market
The industry faces challenges related to scaling up production to meet growing demand while maintaining cost-effectiveness. Regulatory hurdles and fluctuating raw material prices also pose significant challenges. Competition from established players and emerging companies is intense. The need for robust quality control and standardization is paramount to ensure product safety and consumer trust.
Forces Driving Tuna and Algae Omega-3 Ingredient Industry Growth
Technological advancements in algae cultivation and extraction processes are significantly lowering production costs and enhancing product quality, driving industry expansion. The increasing global prevalence of chronic diseases and growing consumer awareness of health benefits are creating strong market demand. Government regulations promoting sustainable and healthy food options are also fostering growth.
Challenges in the Tuna and Algae Omega-3 Ingredient Industry Market
Long-term growth catalysts include continued innovation in algae cultivation and product formulation, strategic partnerships to access wider distribution networks, and expansion into new geographic markets.
Emerging Opportunities in Tuna and Algae Omega-3 Ingredient Industry
Emerging opportunities lie in the development of novel omega-3 delivery systems, expansion into emerging markets, and exploration of new applications in animal feed and pharmaceuticals. Personalized nutrition and tailored omega-3 supplements are also gaining traction, creating niche market opportunities.
Leading Players in the Tuna and Algae Omega-3 Ingredient Industry Sector
- AlgaeCytes
- Archer Daniels Midland Company
- BASF SE
- Polaris SA
- Neptune Wellness Solutions Inc
- Koninklijke DSM NV
- Bioprocess Algae LLC
- Lonza
- Corbion NV
- Source-Omega LLC
Key Milestones in Tuna and Algae Omega-3 Ingredient Industry Industry
- June 2021: Polaris launched Omegavie DHA 800 algae oil, showcasing high-potency and sustainable production.
- January 2022: AlgaeCytes secured significant funding for a large-scale bioreactor facility in Europe.
- February 2022: Polaris partnered with Golden Omega USA to expand North American distribution.
Strategic Outlook for Tuna and Algae Omega-3 Ingredient Industry Market
The Tuna and Algae Omega-3 Ingredient market presents substantial growth potential driven by increasing health awareness and consumer demand for sustainable and effective omega-3 supplements. Strategic partnerships, technological innovation, and expansion into new applications will be crucial for companies to capitalize on this market opportunity.
Tuna and Algae Omega-3 Ingredient Industry Segmentation
-
1. Type
-
1.1. Algae Type
-
1.1.1. Concentration type
- 1.1.1.1. High Concentration
- 1.1.1.2. Medium Concentration
- 1.1.1.3. Low Concentration
-
1.1.1. Concentration type
-
1.2. Tuna Type
- 1.2.1. Crude Tuna Oil
- 1.2.2. Refined Tuna Oil
-
1.1. Algae Type
-
2. Application
-
2.1. Food and Beverage
- 2.1.1. Infant Formula
- 2.1.2. Fortified Food and Beverages
- 2.2. Dietary Supplements
- 2.3. Pharmaceutical
- 2.4. Animal Nutrition
- 2.5. Clinical Nutrition
-
2.1. Food and Beverage
Tuna and Algae Omega-3 Ingredient Industry Segmentation By Geography
-
1. North America
- 1.1. United States
- 1.2. Canada
- 1.3. Mexico
- 1.4. Rest of North America
-
2. Europe
- 2.1. Spain
- 2.2. United Kingdom
- 2.3. Germany
- 2.4. France
- 2.5. Italy
- 2.6. Russia
- 2.7. Rest of Europe
-
3. Asia Pacific
- 3.1. China
- 3.2. Japan
- 3.3. India
- 3.4. Australia
- 3.5. Rest of Asia Pacific
-
4. South America
- 4.1. Brazil
- 4.2. Argentina
- 4.3. Rest of South America
-
5. Middle East and Africa
- 5.1. South Africa
- 5.2. United Arab Emirates
- 5.3. Rest of Middle East and Africa

Tuna and Algae Omega-3 Ingredient Industry REPORT HIGHLIGHTS
| Aspects | Details |
|---|---|
| Study Period | 2019-2033 |
| Base Year | 2024 |
| Estimated Year | 2025 |
| Forecast Period | 2025-2033 |
| Historical Period | 2019-2024 |
| Growth Rate | CAGR of 14.03% from 2019-2033 |
| Segmentation |
|
Table of Contents
- 1. Introduction
- 1.1. Research Scope
- 1.2. Market Segmentation
- 1.3. Research Methodology
- 1.4. Definitions and Assumptions
- 2. Executive Summary
- 2.1. Introduction
- 3. Market Dynamics
- 3.1. Introduction
- 3.2. Market Drivers
- 3.2.1. Increasing Demand For Convenience & Processed Food
- 3.3. Market Restrains
- 3.3.1. Increased Consumer Awareness On Side-Effects Of Chemical Additives
- 3.4. Market Trends
- 3.4.1. Increasing Consumer Expenditure on Omega-3 Supplements Products
- 4. Market Factor Analysis
- 4.1. Porters Five Forces
- 4.2. Supply/Value Chain
- 4.3. PESTEL analysis
- 4.4. Market Entropy
- 4.5. Patent/Trademark Analysis
- 5. Global Tuna and Algae Omega-3 Ingredient Industry Analysis, Insights and Forecast, 2019-2031
- 5.1. Market Analysis, Insights and Forecast - by Type
- 5.1.1. Algae Type
- 5.1.1.1. Concentration type
- 5.1.1.1.1. High Concentration
- 5.1.1.1.2. Medium Concentration
- 5.1.1.1.3. Low Concentration
- 5.1.1.1. Concentration type
- 5.1.2. Tuna Type
- 5.1.2.1. Crude Tuna Oil
- 5.1.2.2. Refined Tuna Oil
- 5.1.1. Algae Type
- 5.2. Market Analysis, Insights and Forecast - by Application
- 5.2.1. Food and Beverage
- 5.2.1.1. Infant Formula
- 5.2.1.2. Fortified Food and Beverages
- 5.2.2. Dietary Supplements
- 5.2.3. Pharmaceutical
- 5.2.4. Animal Nutrition
- 5.2.5. Clinical Nutrition
- 5.2.1. Food and Beverage
- 5.3. Market Analysis, Insights and Forecast - by Region
- 5.3.1. North America
- 5.3.2. Europe
- 5.3.3. Asia Pacific
- 5.3.4. South America
- 5.3.5. Middle East and Africa
- 5.1. Market Analysis, Insights and Forecast - by Type
- 6. North America Tuna and Algae Omega-3 Ingredient Industry Analysis, Insights and Forecast, 2019-2031
- 6.1. Market Analysis, Insights and Forecast - by Type
- 6.1.1. Algae Type
- 6.1.1.1. Concentration type
- 6.1.1.1.1. High Concentration
- 6.1.1.1.2. Medium Concentration
- 6.1.1.1.3. Low Concentration
- 6.1.1.1. Concentration type
- 6.1.2. Tuna Type
- 6.1.2.1. Crude Tuna Oil
- 6.1.2.2. Refined Tuna Oil
- 6.1.1. Algae Type
- 6.2. Market Analysis, Insights and Forecast - by Application
- 6.2.1. Food and Beverage
- 6.2.1.1. Infant Formula
- 6.2.1.2. Fortified Food and Beverages
- 6.2.2. Dietary Supplements
- 6.2.3. Pharmaceutical
- 6.2.4. Animal Nutrition
- 6.2.5. Clinical Nutrition
- 6.2.1. Food and Beverage
- 6.1. Market Analysis, Insights and Forecast - by Type
- 7. Europe Tuna and Algae Omega-3 Ingredient Industry Analysis, Insights and Forecast, 2019-2031
- 7.1. Market Analysis, Insights and Forecast - by Type
- 7.1.1. Algae Type
- 7.1.1.1. Concentration type
- 7.1.1.1.1. High Concentration
- 7.1.1.1.2. Medium Concentration
- 7.1.1.1.3. Low Concentration
- 7.1.1.1. Concentration type
- 7.1.2. Tuna Type
- 7.1.2.1. Crude Tuna Oil
- 7.1.2.2. Refined Tuna Oil
- 7.1.1. Algae Type
- 7.2. Market Analysis, Insights and Forecast - by Application
- 7.2.1. Food and Beverage
- 7.2.1.1. Infant Formula
- 7.2.1.2. Fortified Food and Beverages
- 7.2.2. Dietary Supplements
- 7.2.3. Pharmaceutical
- 7.2.4. Animal Nutrition
- 7.2.5. Clinical Nutrition
- 7.2.1. Food and Beverage
- 7.1. Market Analysis, Insights and Forecast - by Type
- 8. Asia Pacific Tuna and Algae Omega-3 Ingredient Industry Analysis, Insights and Forecast, 2019-2031
- 8.1. Market Analysis, Insights and Forecast - by Type
- 8.1.1. Algae Type
- 8.1.1.1. Concentration type
- 8.1.1.1.1. High Concentration
- 8.1.1.1.2. Medium Concentration
- 8.1.1.1.3. Low Concentration
- 8.1.1.1. Concentration type
- 8.1.2. Tuna Type
- 8.1.2.1. Crude Tuna Oil
- 8.1.2.2. Refined Tuna Oil
- 8.1.1. Algae Type
- 8.2. Market Analysis, Insights and Forecast - by Application
- 8.2.1. Food and Beverage
- 8.2.1.1. Infant Formula
- 8.2.1.2. Fortified Food and Beverages
- 8.2.2. Dietary Supplements
- 8.2.3. Pharmaceutical
- 8.2.4. Animal Nutrition
- 8.2.5. Clinical Nutrition
- 8.2.1. Food and Beverage
- 8.1. Market Analysis, Insights and Forecast - by Type
- 9. South America Tuna and Algae Omega-3 Ingredient Industry Analysis, Insights and Forecast, 2019-2031
- 9.1. Market Analysis, Insights and Forecast - by Type
- 9.1.1. Algae Type
- 9.1.1.1. Concentration type
- 9.1.1.1.1. High Concentration
- 9.1.1.1.2. Medium Concentration
- 9.1.1.1.3. Low Concentration
- 9.1.1.1. Concentration type
- 9.1.2. Tuna Type
- 9.1.2.1. Crude Tuna Oil
- 9.1.2.2. Refined Tuna Oil
- 9.1.1. Algae Type
- 9.2. Market Analysis, Insights and Forecast - by Application
- 9.2.1. Food and Beverage
- 9.2.1.1. Infant Formula
- 9.2.1.2. Fortified Food and Beverages
- 9.2.2. Dietary Supplements
- 9.2.3. Pharmaceutical
- 9.2.4. Animal Nutrition
- 9.2.5. Clinical Nutrition
- 9.2.1. Food and Beverage
- 9.1. Market Analysis, Insights and Forecast - by Type
- 10. Middle East and Africa Tuna and Algae Omega-3 Ingredient Industry Analysis, Insights and Forecast, 2019-2031
- 10.1. Market Analysis, Insights and Forecast - by Type
- 10.1.1. Algae Type
- 10.1.1.1. Concentration type
- 10.1.1.1.1. High Concentration
- 10.1.1.1.2. Medium Concentration
- 10.1.1.1.3. Low Concentration
- 10.1.1.1. Concentration type
- 10.1.2. Tuna Type
- 10.1.2.1. Crude Tuna Oil
- 10.1.2.2. Refined Tuna Oil
- 10.1.1. Algae Type
- 10.2. Market Analysis, Insights and Forecast - by Application
- 10.2.1. Food and Beverage
- 10.2.1.1. Infant Formula
- 10.2.1.2. Fortified Food and Beverages
- 10.2.2. Dietary Supplements
- 10.2.3. Pharmaceutical
- 10.2.4. Animal Nutrition
- 10.2.5. Clinical Nutrition
- 10.2.1. Food and Beverage
- 10.1. Market Analysis, Insights and Forecast - by Type
- 11. North America Tuna and Algae Omega-3 Ingredient Industry Analysis, Insights and Forecast, 2019-2031
- 11.1. Market Analysis, Insights and Forecast - By Country/Sub-region
- 11.1.1 United States
- 11.1.2 Canada
- 11.1.3 Mexico
- 11.1.4 Rest of North America
- 12. Europe Tuna and Algae Omega-3 Ingredient Industry Analysis, Insights and Forecast, 2019-2031
- 12.1. Market Analysis, Insights and Forecast - By Country/Sub-region
- 12.1.1 Spain
- 12.1.2 United Kingdom
- 12.1.3 Germany
- 12.1.4 France
- 12.1.5 Italy
- 12.1.6 Russia
- 12.1.7 Rest of Europe
- 13. Asia Pacific Tuna and Algae Omega-3 Ingredient Industry Analysis, Insights and Forecast, 2019-2031
- 13.1. Market Analysis, Insights and Forecast - By Country/Sub-region
- 13.1.1 China
- 13.1.2 Japan
- 13.1.3 India
- 13.1.4 Australia
- 13.1.5 Rest of Asia Pacific
- 14. South America Tuna and Algae Omega-3 Ingredient Industry Analysis, Insights and Forecast, 2019-2031
- 14.1. Market Analysis, Insights and Forecast - By Country/Sub-region
- 14.1.1 Brazil
- 14.1.2 Argentina
- 14.1.3 Rest of South America
- 15. Middle East and Africa Tuna and Algae Omega-3 Ingredient Industry Analysis, Insights and Forecast, 2019-2031
- 15.1. Market Analysis, Insights and Forecast - By Country/Sub-region
- 15.1.1 South Africa
- 15.1.2 United Arab Emirates
- 15.1.3 Rest of Middle East and Africa
- 16. Competitive Analysis
- 16.1. Global Market Share Analysis 2024
- 16.2. Company Profiles
- 16.2.1 AlgaeCytes*List Not Exhaustive
- 16.2.1.1. Overview
- 16.2.1.2. Products
- 16.2.1.3. SWOT Analysis
- 16.2.1.4. Recent Developments
- 16.2.1.5. Financials (Based on Availability)
- 16.2.2 Archer Daniels Midland Company
- 16.2.2.1. Overview
- 16.2.2.2. Products
- 16.2.2.3. SWOT Analysis
- 16.2.2.4. Recent Developments
- 16.2.2.5. Financials (Based on Availability)
- 16.2.3 BASF SE
- 16.2.3.1. Overview
- 16.2.3.2. Products
- 16.2.3.3. SWOT Analysis
- 16.2.3.4. Recent Developments
- 16.2.3.5. Financials (Based on Availability)
- 16.2.4 Polaris SA
- 16.2.4.1. Overview
- 16.2.4.2. Products
- 16.2.4.3. SWOT Analysis
- 16.2.4.4. Recent Developments
- 16.2.4.5. Financials (Based on Availability)
- 16.2.5 Neptune Wellness Solutions Inc
- 16.2.5.1. Overview
- 16.2.5.2. Products
- 16.2.5.3. SWOT Analysis
- 16.2.5.4. Recent Developments
- 16.2.5.5. Financials (Based on Availability)
- 16.2.6 Koninklijke DSM NV
- 16.2.6.1. Overview
- 16.2.6.2. Products
- 16.2.6.3. SWOT Analysis
- 16.2.6.4. Recent Developments
- 16.2.6.5. Financials (Based on Availability)
- 16.2.7 Bioprocess Algae LLC
- 16.2.7.1. Overview
- 16.2.7.2. Products
- 16.2.7.3. SWOT Analysis
- 16.2.7.4. Recent Developments
- 16.2.7.5. Financials (Based on Availability)
- 16.2.8 Lonza
- 16.2.8.1. Overview
- 16.2.8.2. Products
- 16.2.8.3. SWOT Analysis
- 16.2.8.4. Recent Developments
- 16.2.8.5. Financials (Based on Availability)
- 16.2.9 Corbion NV
- 16.2.9.1. Overview
- 16.2.9.2. Products
- 16.2.9.3. SWOT Analysis
- 16.2.9.4. Recent Developments
- 16.2.9.5. Financials (Based on Availability)
- 16.2.10 Source-Omega LLC
- 16.2.10.1. Overview
- 16.2.10.2. Products
- 16.2.10.3. SWOT Analysis
- 16.2.10.4. Recent Developments
- 16.2.10.5. Financials (Based on Availability)
- 16.2.1 AlgaeCytes*List Not Exhaustive
List of Figures
- Figure 1: Global Tuna and Algae Omega-3 Ingredient Industry Revenue Breakdown (Million, %) by Region 2024 & 2032
- Figure 2: Global Tuna and Algae Omega-3 Ingredient Industry Volume Breakdown (K Tons, %) by Region 2024 & 2032
- Figure 3: North America Tuna and Algae Omega-3 Ingredient Industry Revenue (Million), by Country 2024 & 2032
- Figure 4: North America Tuna and Algae Omega-3 Ingredient Industry Volume (K Tons), by Country 2024 & 2032
- Figure 5: North America Tuna and Algae Omega-3 Ingredient Industry Revenue Share (%), by Country 2024 & 2032
- Figure 6: North America Tuna and Algae Omega-3 Ingredient Industry Volume Share (%), by Country 2024 & 2032
- Figure 7: Europe Tuna and Algae Omega-3 Ingredient Industry Revenue (Million), by Country 2024 & 2032
- Figure 8: Europe Tuna and Algae Omega-3 Ingredient Industry Volume (K Tons), by Country 2024 & 2032
- Figure 9: Europe Tuna and Algae Omega-3 Ingredient Industry Revenue Share (%), by Country 2024 & 2032
- Figure 10: Europe Tuna and Algae Omega-3 Ingredient Industry Volume Share (%), by Country 2024 & 2032
- Figure 11: Asia Pacific Tuna and Algae Omega-3 Ingredient Industry Revenue (Million), by Country 2024 & 2032
- Figure 12: Asia Pacific Tuna and Algae Omega-3 Ingredient Industry Volume (K Tons), by Country 2024 & 2032
- Figure 13: Asia Pacific Tuna and Algae Omega-3 Ingredient Industry Revenue Share (%), by Country 2024 & 2032
- Figure 14: Asia Pacific Tuna and Algae Omega-3 Ingredient Industry Volume Share (%), by Country 2024 & 2032
- Figure 15: South America Tuna and Algae Omega-3 Ingredient Industry Revenue (Million), by Country 2024 & 2032
- Figure 16: South America Tuna and Algae Omega-3 Ingredient Industry Volume (K Tons), by Country 2024 & 2032
- Figure 17: South America Tuna and Algae Omega-3 Ingredient Industry Revenue Share (%), by Country 2024 & 2032
- Figure 18: South America Tuna and Algae Omega-3 Ingredient Industry Volume Share (%), by Country 2024 & 2032
- Figure 19: Middle East and Africa Tuna and Algae Omega-3 Ingredient Industry Revenue (Million), by Country 2024 & 2032
- Figure 20: Middle East and Africa Tuna and Algae Omega-3 Ingredient Industry Volume (K Tons), by Country 2024 & 2032
- Figure 21: Middle East and Africa Tuna and Algae Omega-3 Ingredient Industry Revenue Share (%), by Country 2024 & 2032
- Figure 22: Middle East and Africa Tuna and Algae Omega-3 Ingredient Industry Volume Share (%), by Country 2024 & 2032
- Figure 23: North America Tuna and Algae Omega-3 Ingredient Industry Revenue (Million), by Type 2024 & 2032
- Figure 24: North America Tuna and Algae Omega-3 Ingredient Industry Volume (K Tons), by Type 2024 & 2032
- Figure 25: North America Tuna and Algae Omega-3 Ingredient Industry Revenue Share (%), by Type 2024 & 2032
- Figure 26: North America Tuna and Algae Omega-3 Ingredient Industry Volume Share (%), by Type 2024 & 2032
- Figure 27: North America Tuna and Algae Omega-3 Ingredient Industry Revenue (Million), by Application 2024 & 2032
- Figure 28: North America Tuna and Algae Omega-3 Ingredient Industry Volume (K Tons), by Application 2024 & 2032
- Figure 29: North America Tuna and Algae Omega-3 Ingredient Industry Revenue Share (%), by Application 2024 & 2032
- Figure 30: North America Tuna and Algae Omega-3 Ingredient Industry Volume Share (%), by Application 2024 & 2032
- Figure 31: North America Tuna and Algae Omega-3 Ingredient Industry Revenue (Million), by Country 2024 & 2032
- Figure 32: North America Tuna and Algae Omega-3 Ingredient Industry Volume (K Tons), by Country 2024 & 2032
- Figure 33: North America Tuna and Algae Omega-3 Ingredient Industry Revenue Share (%), by Country 2024 & 2032
- Figure 34: North America Tuna and Algae Omega-3 Ingredient Industry Volume Share (%), by Country 2024 & 2032
- Figure 35: Europe Tuna and Algae Omega-3 Ingredient Industry Revenue (Million), by Type 2024 & 2032
- Figure 36: Europe Tuna and Algae Omega-3 Ingredient Industry Volume (K Tons), by Type 2024 & 2032
- Figure 37: Europe Tuna and Algae Omega-3 Ingredient Industry Revenue Share (%), by Type 2024 & 2032
- Figure 38: Europe Tuna and Algae Omega-3 Ingredient Industry Volume Share (%), by Type 2024 & 2032
- Figure 39: Europe Tuna and Algae Omega-3 Ingredient Industry Revenue (Million), by Application 2024 & 2032
- Figure 40: Europe Tuna and Algae Omega-3 Ingredient Industry Volume (K Tons), by Application 2024 & 2032
- Figure 41: Europe Tuna and Algae Omega-3 Ingredient Industry Revenue Share (%), by Application 2024 & 2032
- Figure 42: Europe Tuna and Algae Omega-3 Ingredient Industry Volume Share (%), by Application 2024 & 2032
- Figure 43: Europe Tuna and Algae Omega-3 Ingredient Industry Revenue (Million), by Country 2024 & 2032
- Figure 44: Europe Tuna and Algae Omega-3 Ingredient Industry Volume (K Tons), by Country 2024 & 2032
- Figure 45: Europe Tuna and Algae Omega-3 Ingredient Industry Revenue Share (%), by Country 2024 & 2032
- Figure 46: Europe Tuna and Algae Omega-3 Ingredient Industry Volume Share (%), by Country 2024 & 2032
- Figure 47: Asia Pacific Tuna and Algae Omega-3 Ingredient Industry Revenue (Million), by Type 2024 & 2032
- Figure 48: Asia Pacific Tuna and Algae Omega-3 Ingredient Industry Volume (K Tons), by Type 2024 & 2032
- Figure 49: Asia Pacific Tuna and Algae Omega-3 Ingredient Industry Revenue Share (%), by Type 2024 & 2032
- Figure 50: Asia Pacific Tuna and Algae Omega-3 Ingredient Industry Volume Share (%), by Type 2024 & 2032
- Figure 51: Asia Pacific Tuna and Algae Omega-3 Ingredient Industry Revenue (Million), by Application 2024 & 2032
- Figure 52: Asia Pacific Tuna and Algae Omega-3 Ingredient Industry Volume (K Tons), by Application 2024 & 2032
- Figure 53: Asia Pacific Tuna and Algae Omega-3 Ingredient Industry Revenue Share (%), by Application 2024 & 2032
- Figure 54: Asia Pacific Tuna and Algae Omega-3 Ingredient Industry Volume Share (%), by Application 2024 & 2032
- Figure 55: Asia Pacific Tuna and Algae Omega-3 Ingredient Industry Revenue (Million), by Country 2024 & 2032
- Figure 56: Asia Pacific Tuna and Algae Omega-3 Ingredient Industry Volume (K Tons), by Country 2024 & 2032
- Figure 57: Asia Pacific Tuna and Algae Omega-3 Ingredient Industry Revenue Share (%), by Country 2024 & 2032
- Figure 58: Asia Pacific Tuna and Algae Omega-3 Ingredient Industry Volume Share (%), by Country 2024 & 2032
- Figure 59: South America Tuna and Algae Omega-3 Ingredient Industry Revenue (Million), by Type 2024 & 2032
- Figure 60: South America Tuna and Algae Omega-3 Ingredient Industry Volume (K Tons), by Type 2024 & 2032
- Figure 61: South America Tuna and Algae Omega-3 Ingredient Industry Revenue Share (%), by Type 2024 & 2032
- Figure 62: South America Tuna and Algae Omega-3 Ingredient Industry Volume Share (%), by Type 2024 & 2032
- Figure 63: South America Tuna and Algae Omega-3 Ingredient Industry Revenue (Million), by Application 2024 & 2032
- Figure 64: South America Tuna and Algae Omega-3 Ingredient Industry Volume (K Tons), by Application 2024 & 2032
- Figure 65: South America Tuna and Algae Omega-3 Ingredient Industry Revenue Share (%), by Application 2024 & 2032
- Figure 66: South America Tuna and Algae Omega-3 Ingredient Industry Volume Share (%), by Application 2024 & 2032
- Figure 67: South America Tuna and Algae Omega-3 Ingredient Industry Revenue (Million), by Country 2024 & 2032
- Figure 68: South America Tuna and Algae Omega-3 Ingredient Industry Volume (K Tons), by Country 2024 & 2032
- Figure 69: South America Tuna and Algae Omega-3 Ingredient Industry Revenue Share (%), by Country 2024 & 2032
- Figure 70: South America Tuna and Algae Omega-3 Ingredient Industry Volume Share (%), by Country 2024 & 2032
- Figure 71: Middle East and Africa Tuna and Algae Omega-3 Ingredient Industry Revenue (Million), by Type 2024 & 2032
- Figure 72: Middle East and Africa Tuna and Algae Omega-3 Ingredient Industry Volume (K Tons), by Type 2024 & 2032
- Figure 73: Middle East and Africa Tuna and Algae Omega-3 Ingredient Industry Revenue Share (%), by Type 2024 & 2032
- Figure 74: Middle East and Africa Tuna and Algae Omega-3 Ingredient Industry Volume Share (%), by Type 2024 & 2032
- Figure 75: Middle East and Africa Tuna and Algae Omega-3 Ingredient Industry Revenue (Million), by Application 2024 & 2032
- Figure 76: Middle East and Africa Tuna and Algae Omega-3 Ingredient Industry Volume (K Tons), by Application 2024 & 2032
- Figure 77: Middle East and Africa Tuna and Algae Omega-3 Ingredient Industry Revenue Share (%), by Application 2024 & 2032
- Figure 78: Middle East and Africa Tuna and Algae Omega-3 Ingredient Industry Volume Share (%), by Application 2024 & 2032
- Figure 79: Middle East and Africa Tuna and Algae Omega-3 Ingredient Industry Revenue (Million), by Country 2024 & 2032
- Figure 80: Middle East and Africa Tuna and Algae Omega-3 Ingredient Industry Volume (K Tons), by Country 2024 & 2032
- Figure 81: Middle East and Africa Tuna and Algae Omega-3 Ingredient Industry Revenue Share (%), by Country 2024 & 2032
- Figure 82: Middle East and Africa Tuna and Algae Omega-3 Ingredient Industry Volume Share (%), by Country 2024 & 2032
List of Tables
- Table 1: Global Tuna and Algae Omega-3 Ingredient Industry Revenue Million Forecast, by Region 2019 & 2032
- Table 2: Global Tuna and Algae Omega-3 Ingredient Industry Volume K Tons Forecast, by Region 2019 & 2032
- Table 3: Global Tuna and Algae Omega-3 Ingredient Industry Revenue Million Forecast, by Type 2019 & 2032
- Table 4: Global Tuna and Algae Omega-3 Ingredient Industry Volume K Tons Forecast, by Type 2019 & 2032
- Table 5: Global Tuna and Algae Omega-3 Ingredient Industry Revenue Million Forecast, by Application 2019 & 2032
- Table 6: Global Tuna and Algae Omega-3 Ingredient Industry Volume K Tons Forecast, by Application 2019 & 2032
- Table 7: Global Tuna and Algae Omega-3 Ingredient Industry Revenue Million Forecast, by Region 2019 & 2032
- Table 8: Global Tuna and Algae Omega-3 Ingredient Industry Volume K Tons Forecast, by Region 2019 & 2032
- Table 9: Global Tuna and Algae Omega-3 Ingredient Industry Revenue Million Forecast, by Country 2019 & 2032
- Table 10: Global Tuna and Algae Omega-3 Ingredient Industry Volume K Tons Forecast, by Country 2019 & 2032
- Table 11: United States Tuna and Algae Omega-3 Ingredient Industry Revenue (Million) Forecast, by Application 2019 & 2032
- Table 12: United States Tuna and Algae Omega-3 Ingredient Industry Volume (K Tons) Forecast, by Application 2019 & 2032
- Table 13: Canada Tuna and Algae Omega-3 Ingredient Industry Revenue (Million) Forecast, by Application 2019 & 2032
- Table 14: Canada Tuna and Algae Omega-3 Ingredient Industry Volume (K Tons) Forecast, by Application 2019 & 2032
- Table 15: Mexico Tuna and Algae Omega-3 Ingredient Industry Revenue (Million) Forecast, by Application 2019 & 2032
- Table 16: Mexico Tuna and Algae Omega-3 Ingredient Industry Volume (K Tons) Forecast, by Application 2019 & 2032
- Table 17: Rest of North America Tuna and Algae Omega-3 Ingredient Industry Revenue (Million) Forecast, by Application 2019 & 2032
- Table 18: Rest of North America Tuna and Algae Omega-3 Ingredient Industry Volume (K Tons) Forecast, by Application 2019 & 2032
- Table 19: Global Tuna and Algae Omega-3 Ingredient Industry Revenue Million Forecast, by Country 2019 & 2032
- Table 20: Global Tuna and Algae Omega-3 Ingredient Industry Volume K Tons Forecast, by Country 2019 & 2032
- Table 21: Spain Tuna and Algae Omega-3 Ingredient Industry Revenue (Million) Forecast, by Application 2019 & 2032
- Table 22: Spain Tuna and Algae Omega-3 Ingredient Industry Volume (K Tons) Forecast, by Application 2019 & 2032
- Table 23: United Kingdom Tuna and Algae Omega-3 Ingredient Industry Revenue (Million) Forecast, by Application 2019 & 2032
- Table 24: United Kingdom Tuna and Algae Omega-3 Ingredient Industry Volume (K Tons) Forecast, by Application 2019 & 2032
- Table 25: Germany Tuna and Algae Omega-3 Ingredient Industry Revenue (Million) Forecast, by Application 2019 & 2032
- Table 26: Germany Tuna and Algae Omega-3 Ingredient Industry Volume (K Tons) Forecast, by Application 2019 & 2032
- Table 27: France Tuna and Algae Omega-3 Ingredient Industry Revenue (Million) Forecast, by Application 2019 & 2032
- Table 28: France Tuna and Algae Omega-3 Ingredient Industry Volume (K Tons) Forecast, by Application 2019 & 2032
- Table 29: Italy Tuna and Algae Omega-3 Ingredient Industry Revenue (Million) Forecast, by Application 2019 & 2032
- Table 30: Italy Tuna and Algae Omega-3 Ingredient Industry Volume (K Tons) Forecast, by Application 2019 & 2032
- Table 31: Russia Tuna and Algae Omega-3 Ingredient Industry Revenue (Million) Forecast, by Application 2019 & 2032
- Table 32: Russia Tuna and Algae Omega-3 Ingredient Industry Volume (K Tons) Forecast, by Application 2019 & 2032
- Table 33: Rest of Europe Tuna and Algae Omega-3 Ingredient Industry Revenue (Million) Forecast, by Application 2019 & 2032
- Table 34: Rest of Europe Tuna and Algae Omega-3 Ingredient Industry Volume (K Tons) Forecast, by Application 2019 & 2032
- Table 35: Global Tuna and Algae Omega-3 Ingredient Industry Revenue Million Forecast, by Country 2019 & 2032
- Table 36: Global Tuna and Algae Omega-3 Ingredient Industry Volume K Tons Forecast, by Country 2019 & 2032
- Table 37: China Tuna and Algae Omega-3 Ingredient Industry Revenue (Million) Forecast, by Application 2019 & 2032
- Table 38: China Tuna and Algae Omega-3 Ingredient Industry Volume (K Tons) Forecast, by Application 2019 & 2032
- Table 39: Japan Tuna and Algae Omega-3 Ingredient Industry Revenue (Million) Forecast, by Application 2019 & 2032
- Table 40: Japan Tuna and Algae Omega-3 Ingredient Industry Volume (K Tons) Forecast, by Application 2019 & 2032
- Table 41: India Tuna and Algae Omega-3 Ingredient Industry Revenue (Million) Forecast, by Application 2019 & 2032
- Table 42: India Tuna and Algae Omega-3 Ingredient Industry Volume (K Tons) Forecast, by Application 2019 & 2032
- Table 43: Australia Tuna and Algae Omega-3 Ingredient Industry Revenue (Million) Forecast, by Application 2019 & 2032
- Table 44: Australia Tuna and Algae Omega-3 Ingredient Industry Volume (K Tons) Forecast, by Application 2019 & 2032
- Table 45: Rest of Asia Pacific Tuna and Algae Omega-3 Ingredient Industry Revenue (Million) Forecast, by Application 2019 & 2032
- Table 46: Rest of Asia Pacific Tuna and Algae Omega-3 Ingredient Industry Volume (K Tons) Forecast, by Application 2019 & 2032
- Table 47: Global Tuna and Algae Omega-3 Ingredient Industry Revenue Million Forecast, by Country 2019 & 2032
- Table 48: Global Tuna and Algae Omega-3 Ingredient Industry Volume K Tons Forecast, by Country 2019 & 2032
- Table 49: Brazil Tuna and Algae Omega-3 Ingredient Industry Revenue (Million) Forecast, by Application 2019 & 2032
- Table 50: Brazil Tuna and Algae Omega-3 Ingredient Industry Volume (K Tons) Forecast, by Application 2019 & 2032
- Table 51: Argentina Tuna and Algae Omega-3 Ingredient Industry Revenue (Million) Forecast, by Application 2019 & 2032
- Table 52: Argentina Tuna and Algae Omega-3 Ingredient Industry Volume (K Tons) Forecast, by Application 2019 & 2032
- Table 53: Rest of South America Tuna and Algae Omega-3 Ingredient Industry Revenue (Million) Forecast, by Application 2019 & 2032
- Table 54: Rest of South America Tuna and Algae Omega-3 Ingredient Industry Volume (K Tons) Forecast, by Application 2019 & 2032
- Table 55: Global Tuna and Algae Omega-3 Ingredient Industry Revenue Million Forecast, by Country 2019 & 2032
- Table 56: Global Tuna and Algae Omega-3 Ingredient Industry Volume K Tons Forecast, by Country 2019 & 2032
- Table 57: South Africa Tuna and Algae Omega-3 Ingredient Industry Revenue (Million) Forecast, by Application 2019 & 2032
- Table 58: South Africa Tuna and Algae Omega-3 Ingredient Industry Volume (K Tons) Forecast, by Application 2019 & 2032
- Table 59: United Arab Emirates Tuna and Algae Omega-3 Ingredient Industry Revenue (Million) Forecast, by Application 2019 & 2032
- Table 60: United Arab Emirates Tuna and Algae Omega-3 Ingredient Industry Volume (K Tons) Forecast, by Application 2019 & 2032
- Table 61: Rest of Middle East and Africa Tuna and Algae Omega-3 Ingredient Industry Revenue (Million) Forecast, by Application 2019 & 2032
- Table 62: Rest of Middle East and Africa Tuna and Algae Omega-3 Ingredient Industry Volume (K Tons) Forecast, by Application 2019 & 2032
- Table 63: Global Tuna and Algae Omega-3 Ingredient Industry Revenue Million Forecast, by Type 2019 & 2032
- Table 64: Global Tuna and Algae Omega-3 Ingredient Industry Volume K Tons Forecast, by Type 2019 & 2032
- Table 65: Global Tuna and Algae Omega-3 Ingredient Industry Revenue Million Forecast, by Application 2019 & 2032
- Table 66: Global Tuna and Algae Omega-3 Ingredient Industry Volume K Tons Forecast, by Application 2019 & 2032
- Table 67: Global Tuna and Algae Omega-3 Ingredient Industry Revenue Million Forecast, by Country 2019 & 2032
- Table 68: Global Tuna and Algae Omega-3 Ingredient Industry Volume K Tons Forecast, by Country 2019 & 2032
- Table 69: United States Tuna and Algae Omega-3 Ingredient Industry Revenue (Million) Forecast, by Application 2019 & 2032
- Table 70: United States Tuna and Algae Omega-3 Ingredient Industry Volume (K Tons) Forecast, by Application 2019 & 2032
- Table 71: Canada Tuna and Algae Omega-3 Ingredient Industry Revenue (Million) Forecast, by Application 2019 & 2032
- Table 72: Canada Tuna and Algae Omega-3 Ingredient Industry Volume (K Tons) Forecast, by Application 2019 & 2032
- Table 73: Mexico Tuna and Algae Omega-3 Ingredient Industry Revenue (Million) Forecast, by Application 2019 & 2032
- Table 74: Mexico Tuna and Algae Omega-3 Ingredient Industry Volume (K Tons) Forecast, by Application 2019 & 2032
- Table 75: Rest of North America Tuna and Algae Omega-3 Ingredient Industry Revenue (Million) Forecast, by Application 2019 & 2032
- Table 76: Rest of North America Tuna and Algae Omega-3 Ingredient Industry Volume (K Tons) Forecast, by Application 2019 & 2032
- Table 77: Global Tuna and Algae Omega-3 Ingredient Industry Revenue Million Forecast, by Type 2019 & 2032
- Table 78: Global Tuna and Algae Omega-3 Ingredient Industry Volume K Tons Forecast, by Type 2019 & 2032
- Table 79: Global Tuna and Algae Omega-3 Ingredient Industry Revenue Million Forecast, by Application 2019 & 2032
- Table 80: Global Tuna and Algae Omega-3 Ingredient Industry Volume K Tons Forecast, by Application 2019 & 2032
- Table 81: Global Tuna and Algae Omega-3 Ingredient Industry Revenue Million Forecast, by Country 2019 & 2032
- Table 82: Global Tuna and Algae Omega-3 Ingredient Industry Volume K Tons Forecast, by Country 2019 & 2032
- Table 83: Spain Tuna and Algae Omega-3 Ingredient Industry Revenue (Million) Forecast, by Application 2019 & 2032
- Table 84: Spain Tuna and Algae Omega-3 Ingredient Industry Volume (K Tons) Forecast, by Application 2019 & 2032
- Table 85: United Kingdom Tuna and Algae Omega-3 Ingredient Industry Revenue (Million) Forecast, by Application 2019 & 2032
- Table 86: United Kingdom Tuna and Algae Omega-3 Ingredient Industry Volume (K Tons) Forecast, by Application 2019 & 2032
- Table 87: Germany Tuna and Algae Omega-3 Ingredient Industry Revenue (Million) Forecast, by Application 2019 & 2032
- Table 88: Germany Tuna and Algae Omega-3 Ingredient Industry Volume (K Tons) Forecast, by Application 2019 & 2032
- Table 89: France Tuna and Algae Omega-3 Ingredient Industry Revenue (Million) Forecast, by Application 2019 & 2032
- Table 90: France Tuna and Algae Omega-3 Ingredient Industry Volume (K Tons) Forecast, by Application 2019 & 2032
- Table 91: Italy Tuna and Algae Omega-3 Ingredient Industry Revenue (Million) Forecast, by Application 2019 & 2032
- Table 92: Italy Tuna and Algae Omega-3 Ingredient Industry Volume (K Tons) Forecast, by Application 2019 & 2032
- Table 93: Russia Tuna and Algae Omega-3 Ingredient Industry Revenue (Million) Forecast, by Application 2019 & 2032
- Table 94: Russia Tuna and Algae Omega-3 Ingredient Industry Volume (K Tons) Forecast, by Application 2019 & 2032
- Table 95: Rest of Europe Tuna and Algae Omega-3 Ingredient Industry Revenue (Million) Forecast, by Application 2019 & 2032
- Table 96: Rest of Europe Tuna and Algae Omega-3 Ingredient Industry Volume (K Tons) Forecast, by Application 2019 & 2032
- Table 97: Global Tuna and Algae Omega-3 Ingredient Industry Revenue Million Forecast, by Type 2019 & 2032
- Table 98: Global Tuna and Algae Omega-3 Ingredient Industry Volume K Tons Forecast, by Type 2019 & 2032
- Table 99: Global Tuna and Algae Omega-3 Ingredient Industry Revenue Million Forecast, by Application 2019 & 2032
- Table 100: Global Tuna and Algae Omega-3 Ingredient Industry Volume K Tons Forecast, by Application 2019 & 2032
- Table 101: Global Tuna and Algae Omega-3 Ingredient Industry Revenue Million Forecast, by Country 2019 & 2032
- Table 102: Global Tuna and Algae Omega-3 Ingredient Industry Volume K Tons Forecast, by Country 2019 & 2032
- Table 103: China Tuna and Algae Omega-3 Ingredient Industry Revenue (Million) Forecast, by Application 2019 & 2032
- Table 104: China Tuna and Algae Omega-3 Ingredient Industry Volume (K Tons) Forecast, by Application 2019 & 2032
- Table 105: Japan Tuna and Algae Omega-3 Ingredient Industry Revenue (Million) Forecast, by Application 2019 & 2032
- Table 106: Japan Tuna and Algae Omega-3 Ingredient Industry Volume (K Tons) Forecast, by Application 2019 & 2032
- Table 107: India Tuna and Algae Omega-3 Ingredient Industry Revenue (Million) Forecast, by Application 2019 & 2032
- Table 108: India Tuna and Algae Omega-3 Ingredient Industry Volume (K Tons) Forecast, by Application 2019 & 2032
- Table 109: Australia Tuna and Algae Omega-3 Ingredient Industry Revenue (Million) Forecast, by Application 2019 & 2032
- Table 110: Australia Tuna and Algae Omega-3 Ingredient Industry Volume (K Tons) Forecast, by Application 2019 & 2032
- Table 111: Rest of Asia Pacific Tuna and Algae Omega-3 Ingredient Industry Revenue (Million) Forecast, by Application 2019 & 2032
- Table 112: Rest of Asia Pacific Tuna and Algae Omega-3 Ingredient Industry Volume (K Tons) Forecast, by Application 2019 & 2032
- Table 113: Global Tuna and Algae Omega-3 Ingredient Industry Revenue Million Forecast, by Type 2019 & 2032
- Table 114: Global Tuna and Algae Omega-3 Ingredient Industry Volume K Tons Forecast, by Type 2019 & 2032
- Table 115: Global Tuna and Algae Omega-3 Ingredient Industry Revenue Million Forecast, by Application 2019 & 2032
- Table 116: Global Tuna and Algae Omega-3 Ingredient Industry Volume K Tons Forecast, by Application 2019 & 2032
- Table 117: Global Tuna and Algae Omega-3 Ingredient Industry Revenue Million Forecast, by Country 2019 & 2032
- Table 118: Global Tuna and Algae Omega-3 Ingredient Industry Volume K Tons Forecast, by Country 2019 & 2032
- Table 119: Brazil Tuna and Algae Omega-3 Ingredient Industry Revenue (Million) Forecast, by Application 2019 & 2032
- Table 120: Brazil Tuna and Algae Omega-3 Ingredient Industry Volume (K Tons) Forecast, by Application 2019 & 2032
- Table 121: Argentina Tuna and Algae Omega-3 Ingredient Industry Revenue (Million) Forecast, by Application 2019 & 2032
- Table 122: Argentina Tuna and Algae Omega-3 Ingredient Industry Volume (K Tons) Forecast, by Application 2019 & 2032
- Table 123: Rest of South America Tuna and Algae Omega-3 Ingredient Industry Revenue (Million) Forecast, by Application 2019 & 2032
- Table 124: Rest of South America Tuna and Algae Omega-3 Ingredient Industry Volume (K Tons) Forecast, by Application 2019 & 2032
- Table 125: Global Tuna and Algae Omega-3 Ingredient Industry Revenue Million Forecast, by Type 2019 & 2032
- Table 126: Global Tuna and Algae Omega-3 Ingredient Industry Volume K Tons Forecast, by Type 2019 & 2032
- Table 127: Global Tuna and Algae Omega-3 Ingredient Industry Revenue Million Forecast, by Application 2019 & 2032
- Table 128: Global Tuna and Algae Omega-3 Ingredient Industry Volume K Tons Forecast, by Application 2019 & 2032
- Table 129: Global Tuna and Algae Omega-3 Ingredient Industry Revenue Million Forecast, by Country 2019 & 2032
- Table 130: Global Tuna and Algae Omega-3 Ingredient Industry Volume K Tons Forecast, by Country 2019 & 2032
- Table 131: South Africa Tuna and Algae Omega-3 Ingredient Industry Revenue (Million) Forecast, by Application 2019 & 2032
- Table 132: South Africa Tuna and Algae Omega-3 Ingredient Industry Volume (K Tons) Forecast, by Application 2019 & 2032
- Table 133: United Arab Emirates Tuna and Algae Omega-3 Ingredient Industry Revenue (Million) Forecast, by Application 2019 & 2032
- Table 134: United Arab Emirates Tuna and Algae Omega-3 Ingredient Industry Volume (K Tons) Forecast, by Application 2019 & 2032
- Table 135: Rest of Middle East and Africa Tuna and Algae Omega-3 Ingredient Industry Revenue (Million) Forecast, by Application 2019 & 2032
- Table 136: Rest of Middle East and Africa Tuna and Algae Omega-3 Ingredient Industry Volume (K Tons) Forecast, by Application 2019 & 2032
Frequently Asked Questions
1. What is the projected Compound Annual Growth Rate (CAGR) of the Tuna and Algae Omega-3 Ingredient Industry?
The projected CAGR is approximately 14.03%.
2. Which companies are prominent players in the Tuna and Algae Omega-3 Ingredient Industry?
Key companies in the market include AlgaeCytes*List Not Exhaustive, Archer Daniels Midland Company, BASF SE, Polaris SA, Neptune Wellness Solutions Inc, Koninklijke DSM NV, Bioprocess Algae LLC, Lonza, Corbion NV, Source-Omega LLC.
3. What are the main segments of the Tuna and Algae Omega-3 Ingredient Industry?
The market segments include Type, Application.
4. Can you provide details about the market size?
The market size is estimated to be USD 2,895.3 Million as of 2022.
5. What are some drivers contributing to market growth?
Increasing Demand For Convenience & Processed Food.
6. What are the notable trends driving market growth?
Increasing Consumer Expenditure on Omega-3 Supplements Products.
7. Are there any restraints impacting market growth?
Increased Consumer Awareness On Side-Effects Of Chemical Additives.
8. Can you provide examples of recent developments in the market?
February 2022: Polaris partnered with Golden Omega USA to distribute its algae oils across North America.
9. What pricing options are available for accessing the report?
Pricing options include single-user, multi-user, and enterprise licenses priced at USD 4750, USD 5250, and USD 8750 respectively.
10. Is the market size provided in terms of value or volume?
The market size is provided in terms of value, measured in Million and volume, measured in K Tons.
11. Are there any specific market keywords associated with the report?
Yes, the market keyword associated with the report is "Tuna and Algae Omega-3 Ingredient Industry," which aids in identifying and referencing the specific market segment covered.
12. How do I determine which pricing option suits my needs best?
The pricing options vary based on user requirements and access needs. Individual users may opt for single-user licenses, while businesses requiring broader access may choose multi-user or enterprise licenses for cost-effective access to the report.
13. Are there any additional resources or data provided in the Tuna and Algae Omega-3 Ingredient Industry report?
While the report offers comprehensive insights, it's advisable to review the specific contents or supplementary materials provided to ascertain if additional resources or data are available.
14. How can I stay updated on further developments or reports in the Tuna and Algae Omega-3 Ingredient Industry?
To stay informed about further developments, trends, and reports in the Tuna and Algae Omega-3 Ingredient Industry, consider subscribing to industry newsletters, following relevant companies and organizations, or regularly checking reputable industry news sources and publications.
Methodology
Step 1 - Identification of Relevant Samples Size from Population Database


Step 2 - Approaches for Defining Global Market Size (Value, Volume* & Price*)

Note*: In applicable scenarios
Step 3 - Data Sources
Primary Research
- Web Analytics
- Survey Reports
- Research Institute
- Latest Research Reports
- Opinion Leaders
Secondary Research
- Annual Reports
- White Paper
- Latest Press Release
- Industry Association
- Paid Database
- Investor Presentations

Step 4 - Data Triangulation
Involves using different sources of information in order to increase the validity of a study
These sources are likely to be stakeholders in a program - participants, other researchers, program staff, other community members, and so on.
Then we put all data in single framework & apply various statistical tools to find out the dynamic on the market.
During the analysis stage, feedback from the stakeholder groups would be compared to determine areas of agreement as well as areas of divergence
