

Key Insights
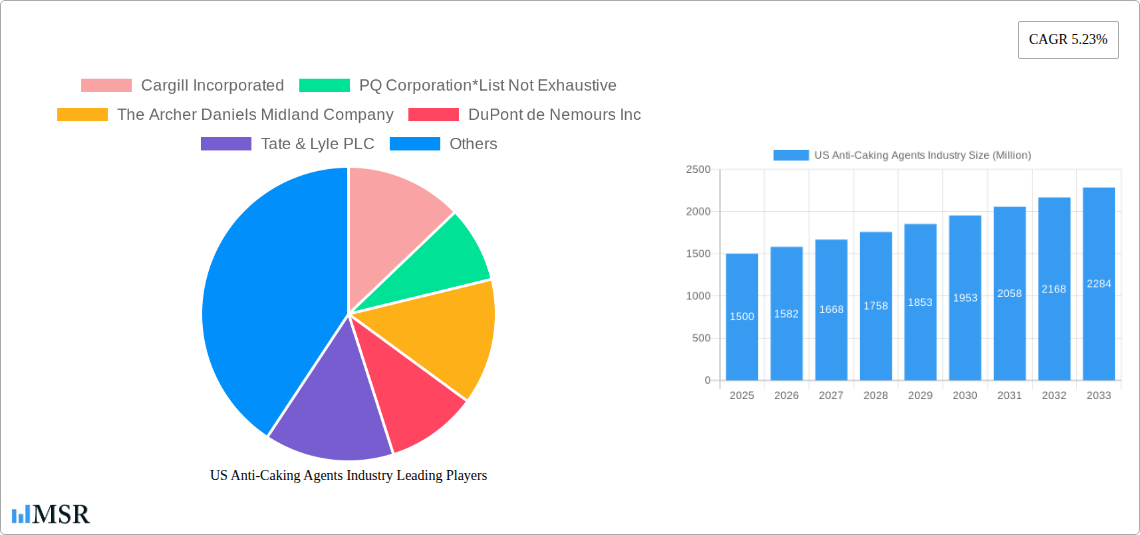
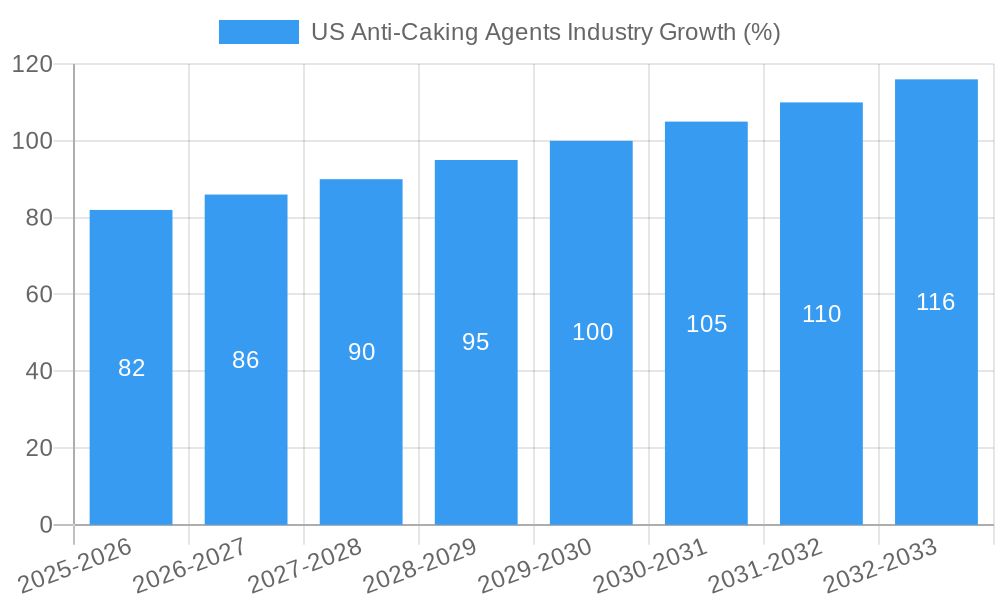
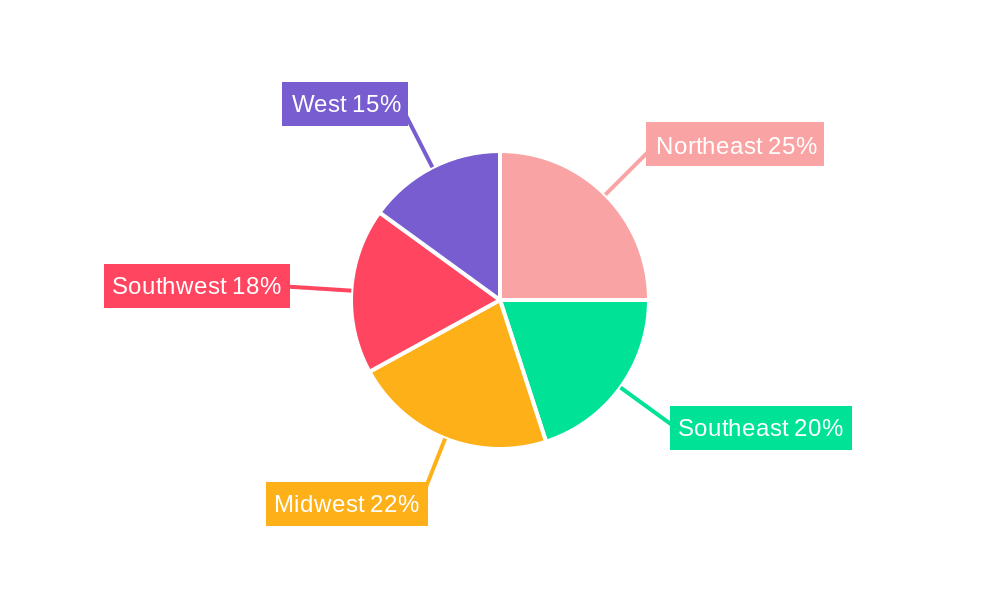
The US anti-caking agents market, valued at approximately $1.5 billion in 2025, is projected to experience steady growth, driven by increasing demand across various sectors. The compound annual growth rate (CAGR) of 5.23% from 2025 to 2033 indicates a significant expansion, reaching an estimated market value of over $2.5 billion by 2033. Key drivers include the rising popularity of processed foods and beverages, necessitating anti-caking agents to maintain product quality and shelf life. Furthermore, growth in the cosmetics and personal care industries, along with the increasing use of anti-caking agents in animal feed, contributes significantly to market expansion. The market segmentation reveals that calcium compounds hold the largest share, followed by sodium compounds and magnesium compounds, reflecting their prevalent usage in diverse applications. Regional analysis highlights strong performance across all US regions, with the Northeast and West potentially leading due to higher concentrations of food processing and manufacturing facilities. However, potential restraints include fluctuating raw material prices and stringent regulations concerning food additives.
Despite these restraints, the long-term outlook remains positive, fueled by continuous innovation in anti-caking agent formulations and the expanding application scope. Major players like Cargill, PQ Corporation, Archer Daniels Midland, and DuPont are strategically investing in research and development to enhance product performance and cater to evolving consumer demands. This competitive landscape fosters innovation, providing a wider array of solutions for diverse industry needs. Continued growth is anticipated, particularly within specialized applications and niche markets, as manufacturers seek optimized solutions for enhanced product quality and consumer satisfaction. The market's trajectory strongly suggests substantial opportunities for growth and investment in the coming years.
US Anti-Caking Agents Industry: A Comprehensive Market Report (2019-2033)
This in-depth report provides a comprehensive analysis of the US anti-caking agents industry, offering valuable insights for stakeholders, investors, and industry professionals. The report covers the period from 2019 to 2033, with a base year of 2025 and a forecast period of 2025-2033. The market is segmented by type (Calcium Compounds, Sodium Compounds, Magnesium Compounds, Others) and application (Food and Beverage, Cosmetic and Personal Care, Feed, Others). Key players analyzed include Cargill Incorporated, PQ Corporation, The Archer Daniels Midland Company, DuPont de Nemours Inc, Tate & Lyle PLC, BASF SE, Imac Inc, and Agropur Ingredients (list not exhaustive). The report projects a market size of $XX Million in 2025, with a Compound Annual Growth Rate (CAGR) of XX% during the forecast period.
US Anti-Caking Agents Industry Market Concentration & Dynamics
The US anti-caking agents market exhibits a moderately concentrated structure, with several large multinational corporations holding significant market share. Cargill, BASF, and Tate & Lyle, for example, collectively command an estimated XX% of the market, as of 2024. However, a significant number of smaller regional players contribute to market diversity. The industry's innovation ecosystem is driven by ongoing research into new formulations and sustainable production methods, particularly focusing on organic and natural anti-caking agents to meet growing consumer demand. Regulatory frameworks, such as FDA guidelines for food-grade additives, heavily influence product development and market access. Substitute products, including certain types of starches and silicas, exist but often lack the efficacy or cost-effectiveness of established anti-caking agents. End-user trends show a growing preference for natural and sustainably sourced ingredients, pushing manufacturers to develop more environmentally friendly options. The recent M&A activity, including Cargill's acquisition of Penford Products in 2021, reflects the industry's consolidation trend and indicates a drive for scale and enhanced product portfolios. This suggests an increase in the number of M&A deals in the coming years, potentially reaching XX in the forecast period.
- Market Share: Top 5 players hold approximately XX% of the market (2024).
- M&A Activity: XX deals observed between 2019-2024, with an expected increase to XX by 2033.
- Regulatory Landscape: Stringent FDA regulations for food and beverage applications.
- Substitute Products: Limited direct substitutes with comparable performance and cost-effectiveness.
US Anti-Caking Agents Industry Insights & Trends
The US anti-caking agents market is experiencing robust growth, fueled by several key factors. The expanding food and beverage industry, particularly processed foods, remains a major driver, demanding large quantities of anti-caking agents to improve product quality, shelf life, and flowability. Technological advancements in formulation and production processes are allowing for the development of more effective and specialized anti-caking agents tailored to specific applications. The growing consumer preference for convenience foods further fuels market demand. Evolving consumer preferences towards natural and organic ingredients are also influencing the market. Manufacturers are responding by developing and marketing organic and sustainably sourced anti-caking agents. The market is projected to reach $XX Million by 2025 and is expected to grow at a CAGR of XX% from 2025 to 2033, driven by these factors.
Key Markets & Segments Leading US Anti-Caking Agents Industry
The food and beverage segment dominates the US anti-caking agents market, accounting for approximately XX% of total consumption in 2024. This dominance is attributable to the widespread use of anti-caking agents in processed foods, including powders, granules, and other dry ingredients. The Calcium compounds segment holds a larger market share compared to other types due to its cost-effectiveness and versatile applications.
- Dominant Segment: Food and Beverage (XX% of market in 2024) and Calcium Compounds (XX% of the type segment).
- Drivers for Food & Beverage Segment:
- Increasing demand for processed and convenience foods.
- Growth of the fast-food and quick-service restaurant industries.
- Expanding global population and rising disposable incomes.
- Drivers for Calcium Compounds Segment:
- Cost-effectiveness compared to other types of anti-caking agents.
- Wide range of applications across various industries.
- Established safety profile and regulatory approval in multiple regions.
US Anti-Caking Agents Industry Product Developments
Recent product innovations have focused on developing more effective, sustainable, and specialized anti-caking agents. This includes the introduction of organic and natural formulations to cater to the growing demand for clean-label ingredients. Technological advancements, such as nanotechnology, are being explored to improve the performance and efficiency of anti-caking agents. These developments enhance the competitive landscape by providing manufacturers with differentiated offerings, ultimately benefiting end-users.
Challenges in the US Anti-Caking Agents Industry Market
The US anti-caking agents industry faces several challenges, including stringent regulatory requirements, fluctuating raw material prices, and intense competition from both domestic and international players. Supply chain disruptions, particularly in the wake of global events, can significantly impact production and distribution. These factors can lead to increased production costs and reduced profit margins. The estimated impact of these challenges on the market value in 2024 is a reduction of approximately $XX Million.
Forces Driving US Anti-Caking Agents Industry Growth
Several key factors are driving the growth of the US anti-caking agents industry. Technological advancements, particularly in the development of more effective and sustainable formulations, are playing a crucial role. The expanding food and beverage sector, along with rising consumer demand for convenient and processed foods, continues to fuel market growth. Favorable government regulations and supportive industry policies also contribute positively.
Challenges in the US Anti-Caking Agents Industry Market
Long-term growth catalysts for the US anti-caking agents market include strategic partnerships and collaborations between manufacturers and end-users to develop innovative solutions. This includes exploring emerging applications for anti-caking agents in new product formulations. Market expansions into niche segments, such as nutraceuticals and pharmaceuticals, also hold considerable potential for future growth.
Emerging Opportunities in US Anti-Caking Agents Industry
Emerging opportunities lie in the development of specialized anti-caking agents for niche applications within the food and beverage, pharmaceutical, and cosmetic industries. The growing demand for clean-label and organic products presents a significant opportunity for manufacturers to develop and market natural and sustainably sourced anti-caking agents. The increasing adoption of novel technologies in manufacturing processes also opens avenues for optimization and cost reduction.
Leading Players in the US Anti-Caking Agents Industry Sector
- Cargill Incorporated
- PQ Corporation
- The Archer Daniels Midland Company
- DuPont de Nemours Inc
- Tate & Lyle PLC
- BASF SE
- Imac Inc
- Agropur Ingredients
Key Milestones in US Anti-Caking Agents Industry Industry
- 2021: Cargill acquired Penford Products, expanding its portfolio of food-grade anti-caking agents.
- 2022: BASF launched a new line of organic anti-caking agents, catering to the growing demand for natural ingredients.
- 2023: PQ Corporation announced a joint venture to expand its production capacity in Asia, strengthening its global presence.
Strategic Outlook for US Anti-Caking Agents Industry Market
The US anti-caking agents market is poised for sustained growth over the forecast period, driven by several factors. Innovation in product development, specifically focusing on natural and sustainable solutions, will be key to capturing market share. Strategic partnerships and collaborations will be crucial for expanding market reach and developing new applications. Companies that can effectively navigate regulatory hurdles and manage supply chain complexities are well-positioned to benefit from the industry's long-term growth prospects.
US Anti-Caking Agents Industry Segmentation
-
1. Type
- 1.1. Calcium Compounds
- 1.2. Sodium Compounds
- 1.3. Magnesium Compounds
- 1.4. Others
-
2. Application
-
2.1. Food and Beverage
- 2.1.1. Bakery Products
- 2.1.2. Dairy Products
- 2.1.3. Soups & Sauces
- 2.1.4. Beverages
- 2.1.5. Others
- 2.2. Cosmetic and Personal Care
- 2.3. Feed
-
2.1. Food and Beverage
US Anti-Caking Agents Industry Segmentation By Geography
-
1. North America
- 1.1. United States
- 1.2. Canada
- 1.3. Mexico
-
2. South America
- 2.1. Brazil
- 2.2. Argentina
- 2.3. Rest of South America
-
3. Europe
- 3.1. United Kingdom
- 3.2. Germany
- 3.3. France
- 3.4. Italy
- 3.5. Spain
- 3.6. Russia
- 3.7. Benelux
- 3.8. Nordics
- 3.9. Rest of Europe
-
4. Middle East & Africa
- 4.1. Turkey
- 4.2. Israel
- 4.3. GCC
- 4.4. North Africa
- 4.5. South Africa
- 4.6. Rest of Middle East & Africa
-
5. Asia Pacific
- 5.1. China
- 5.2. India
- 5.3. Japan
- 5.4. South Korea
- 5.5. ASEAN
- 5.6. Oceania
- 5.7. Rest of Asia Pacific
US Anti-Caking Agents Industry REPORT HIGHLIGHTS
| Aspects | Details |
|---|---|
| Study Period | 2019-2033 |
| Base Year | 2024 |
| Estimated Year | 2025 |
| Forecast Period | 2025-2033 |
| Historical Period | 2019-2024 |
| Growth Rate | CAGR of 5.23% from 2019-2033 |
| Segmentation |
|
Table of Contents
- 1. Introduction
- 1.1. Research Scope
- 1.2. Market Segmentation
- 1.3. Research Methodology
- 1.4. Definitions and Assumptions
- 2. Executive Summary
- 2.1. Introduction
- 3. Market Dynamics
- 3.1. Introduction
- 3.2. Market Drivers
- 3.2.1. Wide Applications and Functionality; Demand For Gluten-Free Products
- 3.3. Market Restrains
- 3.3.1. Easy Availability of Economically Feasible Alternatives
- 3.4. Market Trends
- 3.4.1. Calcium Compounds Holds a Significant Share
- 4. Market Factor Analysis
- 4.1. Porters Five Forces
- 4.2. Supply/Value Chain
- 4.3. PESTEL analysis
- 4.4. Market Entropy
- 4.5. Patent/Trademark Analysis
- 5. Global US Anti-Caking Agents Industry Analysis, Insights and Forecast, 2019-2031
- 5.1. Market Analysis, Insights and Forecast - by Type
- 5.1.1. Calcium Compounds
- 5.1.2. Sodium Compounds
- 5.1.3. Magnesium Compounds
- 5.1.4. Others
- 5.2. Market Analysis, Insights and Forecast - by Application
- 5.2.1. Food and Beverage
- 5.2.1.1. Bakery Products
- 5.2.1.2. Dairy Products
- 5.2.1.3. Soups & Sauces
- 5.2.1.4. Beverages
- 5.2.1.5. Others
- 5.2.2. Cosmetic and Personal Care
- 5.2.3. Feed
- 5.2.1. Food and Beverage
- 5.3. Market Analysis, Insights and Forecast - by Region
- 5.3.1. North America
- 5.3.2. South America
- 5.3.3. Europe
- 5.3.4. Middle East & Africa
- 5.3.5. Asia Pacific
- 5.1. Market Analysis, Insights and Forecast - by Type
- 6. North America US Anti-Caking Agents Industry Analysis, Insights and Forecast, 2019-2031
- 6.1. Market Analysis, Insights and Forecast - by Type
- 6.1.1. Calcium Compounds
- 6.1.2. Sodium Compounds
- 6.1.3. Magnesium Compounds
- 6.1.4. Others
- 6.2. Market Analysis, Insights and Forecast - by Application
- 6.2.1. Food and Beverage
- 6.2.1.1. Bakery Products
- 6.2.1.2. Dairy Products
- 6.2.1.3. Soups & Sauces
- 6.2.1.4. Beverages
- 6.2.1.5. Others
- 6.2.2. Cosmetic and Personal Care
- 6.2.3. Feed
- 6.2.1. Food and Beverage
- 6.1. Market Analysis, Insights and Forecast - by Type
- 7. South America US Anti-Caking Agents Industry Analysis, Insights and Forecast, 2019-2031
- 7.1. Market Analysis, Insights and Forecast - by Type
- 7.1.1. Calcium Compounds
- 7.1.2. Sodium Compounds
- 7.1.3. Magnesium Compounds
- 7.1.4. Others
- 7.2. Market Analysis, Insights and Forecast - by Application
- 7.2.1. Food and Beverage
- 7.2.1.1. Bakery Products
- 7.2.1.2. Dairy Products
- 7.2.1.3. Soups & Sauces
- 7.2.1.4. Beverages
- 7.2.1.5. Others
- 7.2.2. Cosmetic and Personal Care
- 7.2.3. Feed
- 7.2.1. Food and Beverage
- 7.1. Market Analysis, Insights and Forecast - by Type
- 8. Europe US Anti-Caking Agents Industry Analysis, Insights and Forecast, 2019-2031
- 8.1. Market Analysis, Insights and Forecast - by Type
- 8.1.1. Calcium Compounds
- 8.1.2. Sodium Compounds
- 8.1.3. Magnesium Compounds
- 8.1.4. Others
- 8.2. Market Analysis, Insights and Forecast - by Application
- 8.2.1. Food and Beverage
- 8.2.1.1. Bakery Products
- 8.2.1.2. Dairy Products
- 8.2.1.3. Soups & Sauces
- 8.2.1.4. Beverages
- 8.2.1.5. Others
- 8.2.2. Cosmetic and Personal Care
- 8.2.3. Feed
- 8.2.1. Food and Beverage
- 8.1. Market Analysis, Insights and Forecast - by Type
- 9. Middle East & Africa US Anti-Caking Agents Industry Analysis, Insights and Forecast, 2019-2031
- 9.1. Market Analysis, Insights and Forecast - by Type
- 9.1.1. Calcium Compounds
- 9.1.2. Sodium Compounds
- 9.1.3. Magnesium Compounds
- 9.1.4. Others
- 9.2. Market Analysis, Insights and Forecast - by Application
- 9.2.1. Food and Beverage
- 9.2.1.1. Bakery Products
- 9.2.1.2. Dairy Products
- 9.2.1.3. Soups & Sauces
- 9.2.1.4. Beverages
- 9.2.1.5. Others
- 9.2.2. Cosmetic and Personal Care
- 9.2.3. Feed
- 9.2.1. Food and Beverage
- 9.1. Market Analysis, Insights and Forecast - by Type
- 10. Asia Pacific US Anti-Caking Agents Industry Analysis, Insights and Forecast, 2019-2031
- 10.1. Market Analysis, Insights and Forecast - by Type
- 10.1.1. Calcium Compounds
- 10.1.2. Sodium Compounds
- 10.1.3. Magnesium Compounds
- 10.1.4. Others
- 10.2. Market Analysis, Insights and Forecast - by Application
- 10.2.1. Food and Beverage
- 10.2.1.1. Bakery Products
- 10.2.1.2. Dairy Products
- 10.2.1.3. Soups & Sauces
- 10.2.1.4. Beverages
- 10.2.1.5. Others
- 10.2.2. Cosmetic and Personal Care
- 10.2.3. Feed
- 10.2.1. Food and Beverage
- 10.1. Market Analysis, Insights and Forecast - by Type
- 11. Northeast US Anti-Caking Agents Industry Analysis, Insights and Forecast, 2019-2031
- 12. Southeast US Anti-Caking Agents Industry Analysis, Insights and Forecast, 2019-2031
- 13. Midwest US Anti-Caking Agents Industry Analysis, Insights and Forecast, 2019-2031
- 14. Southwest US Anti-Caking Agents Industry Analysis, Insights and Forecast, 2019-2031
- 15. West US Anti-Caking Agents Industry Analysis, Insights and Forecast, 2019-2031
- 16. Competitive Analysis
- 16.1. Global Market Share Analysis 2024
- 16.2. Company Profiles
- 16.2.1 Cargill Incorporated
- 16.2.1.1. Overview
- 16.2.1.2. Products
- 16.2.1.3. SWOT Analysis
- 16.2.1.4. Recent Developments
- 16.2.1.5. Financials (Based on Availability)
- 16.2.2 PQ Corporation*List Not Exhaustive
- 16.2.2.1. Overview
- 16.2.2.2. Products
- 16.2.2.3. SWOT Analysis
- 16.2.2.4. Recent Developments
- 16.2.2.5. Financials (Based on Availability)
- 16.2.3 The Archer Daniels Midland Company
- 16.2.3.1. Overview
- 16.2.3.2. Products
- 16.2.3.3. SWOT Analysis
- 16.2.3.4. Recent Developments
- 16.2.3.5. Financials (Based on Availability)
- 16.2.4 DuPont de Nemours Inc
- 16.2.4.1. Overview
- 16.2.4.2. Products
- 16.2.4.3. SWOT Analysis
- 16.2.4.4. Recent Developments
- 16.2.4.5. Financials (Based on Availability)
- 16.2.5 Tate & Lyle PLC
- 16.2.5.1. Overview
- 16.2.5.2. Products
- 16.2.5.3. SWOT Analysis
- 16.2.5.4. Recent Developments
- 16.2.5.5. Financials (Based on Availability)
- 16.2.6 BASF SE
- 16.2.6.1. Overview
- 16.2.6.2. Products
- 16.2.6.3. SWOT Analysis
- 16.2.6.4. Recent Developments
- 16.2.6.5. Financials (Based on Availability)
- 16.2.7 Imac Inc
- 16.2.7.1. Overview
- 16.2.7.2. Products
- 16.2.7.3. SWOT Analysis
- 16.2.7.4. Recent Developments
- 16.2.7.5. Financials (Based on Availability)
- 16.2.8 Agropur Ingredients
- 16.2.8.1. Overview
- 16.2.8.2. Products
- 16.2.8.3. SWOT Analysis
- 16.2.8.4. Recent Developments
- 16.2.8.5. Financials (Based on Availability)
- 16.2.1 Cargill Incorporated
List of Figures
- Figure 1: Global US Anti-Caking Agents Industry Revenue Breakdown (Million, %) by Region 2024 & 2032
- Figure 2: United states US Anti-Caking Agents Industry Revenue (Million), by Country 2024 & 2032
- Figure 3: United states US Anti-Caking Agents Industry Revenue Share (%), by Country 2024 & 2032
- Figure 4: North America US Anti-Caking Agents Industry Revenue (Million), by Type 2024 & 2032
- Figure 5: North America US Anti-Caking Agents Industry Revenue Share (%), by Type 2024 & 2032
- Figure 6: North America US Anti-Caking Agents Industry Revenue (Million), by Application 2024 & 2032
- Figure 7: North America US Anti-Caking Agents Industry Revenue Share (%), by Application 2024 & 2032
- Figure 8: North America US Anti-Caking Agents Industry Revenue (Million), by Country 2024 & 2032
- Figure 9: North America US Anti-Caking Agents Industry Revenue Share (%), by Country 2024 & 2032
- Figure 10: South America US Anti-Caking Agents Industry Revenue (Million), by Type 2024 & 2032
- Figure 11: South America US Anti-Caking Agents Industry Revenue Share (%), by Type 2024 & 2032
- Figure 12: South America US Anti-Caking Agents Industry Revenue (Million), by Application 2024 & 2032
- Figure 13: South America US Anti-Caking Agents Industry Revenue Share (%), by Application 2024 & 2032
- Figure 14: South America US Anti-Caking Agents Industry Revenue (Million), by Country 2024 & 2032
- Figure 15: South America US Anti-Caking Agents Industry Revenue Share (%), by Country 2024 & 2032
- Figure 16: Europe US Anti-Caking Agents Industry Revenue (Million), by Type 2024 & 2032
- Figure 17: Europe US Anti-Caking Agents Industry Revenue Share (%), by Type 2024 & 2032
- Figure 18: Europe US Anti-Caking Agents Industry Revenue (Million), by Application 2024 & 2032
- Figure 19: Europe US Anti-Caking Agents Industry Revenue Share (%), by Application 2024 & 2032
- Figure 20: Europe US Anti-Caking Agents Industry Revenue (Million), by Country 2024 & 2032
- Figure 21: Europe US Anti-Caking Agents Industry Revenue Share (%), by Country 2024 & 2032
- Figure 22: Middle East & Africa US Anti-Caking Agents Industry Revenue (Million), by Type 2024 & 2032
- Figure 23: Middle East & Africa US Anti-Caking Agents Industry Revenue Share (%), by Type 2024 & 2032
- Figure 24: Middle East & Africa US Anti-Caking Agents Industry Revenue (Million), by Application 2024 & 2032
- Figure 25: Middle East & Africa US Anti-Caking Agents Industry Revenue Share (%), by Application 2024 & 2032
- Figure 26: Middle East & Africa US Anti-Caking Agents Industry Revenue (Million), by Country 2024 & 2032
- Figure 27: Middle East & Africa US Anti-Caking Agents Industry Revenue Share (%), by Country 2024 & 2032
- Figure 28: Asia Pacific US Anti-Caking Agents Industry Revenue (Million), by Type 2024 & 2032
- Figure 29: Asia Pacific US Anti-Caking Agents Industry Revenue Share (%), by Type 2024 & 2032
- Figure 30: Asia Pacific US Anti-Caking Agents Industry Revenue (Million), by Application 2024 & 2032
- Figure 31: Asia Pacific US Anti-Caking Agents Industry Revenue Share (%), by Application 2024 & 2032
- Figure 32: Asia Pacific US Anti-Caking Agents Industry Revenue (Million), by Country 2024 & 2032
- Figure 33: Asia Pacific US Anti-Caking Agents Industry Revenue Share (%), by Country 2024 & 2032
List of Tables
- Table 1: Global US Anti-Caking Agents Industry Revenue Million Forecast, by Region 2019 & 2032
- Table 2: Global US Anti-Caking Agents Industry Revenue Million Forecast, by Type 2019 & 2032
- Table 3: Global US Anti-Caking Agents Industry Revenue Million Forecast, by Application 2019 & 2032
- Table 4: Global US Anti-Caking Agents Industry Revenue Million Forecast, by Region 2019 & 2032
- Table 5: Global US Anti-Caking Agents Industry Revenue Million Forecast, by Country 2019 & 2032
- Table 6: Northeast US Anti-Caking Agents Industry Revenue (Million) Forecast, by Application 2019 & 2032
- Table 7: Southeast US Anti-Caking Agents Industry Revenue (Million) Forecast, by Application 2019 & 2032
- Table 8: Midwest US Anti-Caking Agents Industry Revenue (Million) Forecast, by Application 2019 & 2032
- Table 9: Southwest US Anti-Caking Agents Industry Revenue (Million) Forecast, by Application 2019 & 2032
- Table 10: West US Anti-Caking Agents Industry Revenue (Million) Forecast, by Application 2019 & 2032
- Table 11: Global US Anti-Caking Agents Industry Revenue Million Forecast, by Type 2019 & 2032
- Table 12: Global US Anti-Caking Agents Industry Revenue Million Forecast, by Application 2019 & 2032
- Table 13: Global US Anti-Caking Agents Industry Revenue Million Forecast, by Country 2019 & 2032
- Table 14: United States US Anti-Caking Agents Industry Revenue (Million) Forecast, by Application 2019 & 2032
- Table 15: Canada US Anti-Caking Agents Industry Revenue (Million) Forecast, by Application 2019 & 2032
- Table 16: Mexico US Anti-Caking Agents Industry Revenue (Million) Forecast, by Application 2019 & 2032
- Table 17: Global US Anti-Caking Agents Industry Revenue Million Forecast, by Type 2019 & 2032
- Table 18: Global US Anti-Caking Agents Industry Revenue Million Forecast, by Application 2019 & 2032
- Table 19: Global US Anti-Caking Agents Industry Revenue Million Forecast, by Country 2019 & 2032
- Table 20: Brazil US Anti-Caking Agents Industry Revenue (Million) Forecast, by Application 2019 & 2032
- Table 21: Argentina US Anti-Caking Agents Industry Revenue (Million) Forecast, by Application 2019 & 2032
- Table 22: Rest of South America US Anti-Caking Agents Industry Revenue (Million) Forecast, by Application 2019 & 2032
- Table 23: Global US Anti-Caking Agents Industry Revenue Million Forecast, by Type 2019 & 2032
- Table 24: Global US Anti-Caking Agents Industry Revenue Million Forecast, by Application 2019 & 2032
- Table 25: Global US Anti-Caking Agents Industry Revenue Million Forecast, by Country 2019 & 2032
- Table 26: United Kingdom US Anti-Caking Agents Industry Revenue (Million) Forecast, by Application 2019 & 2032
- Table 27: Germany US Anti-Caking Agents Industry Revenue (Million) Forecast, by Application 2019 & 2032
- Table 28: France US Anti-Caking Agents Industry Revenue (Million) Forecast, by Application 2019 & 2032
- Table 29: Italy US Anti-Caking Agents Industry Revenue (Million) Forecast, by Application 2019 & 2032
- Table 30: Spain US Anti-Caking Agents Industry Revenue (Million) Forecast, by Application 2019 & 2032
- Table 31: Russia US Anti-Caking Agents Industry Revenue (Million) Forecast, by Application 2019 & 2032
- Table 32: Benelux US Anti-Caking Agents Industry Revenue (Million) Forecast, by Application 2019 & 2032
- Table 33: Nordics US Anti-Caking Agents Industry Revenue (Million) Forecast, by Application 2019 & 2032
- Table 34: Rest of Europe US Anti-Caking Agents Industry Revenue (Million) Forecast, by Application 2019 & 2032
- Table 35: Global US Anti-Caking Agents Industry Revenue Million Forecast, by Type 2019 & 2032
- Table 36: Global US Anti-Caking Agents Industry Revenue Million Forecast, by Application 2019 & 2032
- Table 37: Global US Anti-Caking Agents Industry Revenue Million Forecast, by Country 2019 & 2032
- Table 38: Turkey US Anti-Caking Agents Industry Revenue (Million) Forecast, by Application 2019 & 2032
- Table 39: Israel US Anti-Caking Agents Industry Revenue (Million) Forecast, by Application 2019 & 2032
- Table 40: GCC US Anti-Caking Agents Industry Revenue (Million) Forecast, by Application 2019 & 2032
- Table 41: North Africa US Anti-Caking Agents Industry Revenue (Million) Forecast, by Application 2019 & 2032
- Table 42: South Africa US Anti-Caking Agents Industry Revenue (Million) Forecast, by Application 2019 & 2032
- Table 43: Rest of Middle East & Africa US Anti-Caking Agents Industry Revenue (Million) Forecast, by Application 2019 & 2032
- Table 44: Global US Anti-Caking Agents Industry Revenue Million Forecast, by Type 2019 & 2032
- Table 45: Global US Anti-Caking Agents Industry Revenue Million Forecast, by Application 2019 & 2032
- Table 46: Global US Anti-Caking Agents Industry Revenue Million Forecast, by Country 2019 & 2032
- Table 47: China US Anti-Caking Agents Industry Revenue (Million) Forecast, by Application 2019 & 2032
- Table 48: India US Anti-Caking Agents Industry Revenue (Million) Forecast, by Application 2019 & 2032
- Table 49: Japan US Anti-Caking Agents Industry Revenue (Million) Forecast, by Application 2019 & 2032
- Table 50: South Korea US Anti-Caking Agents Industry Revenue (Million) Forecast, by Application 2019 & 2032
- Table 51: ASEAN US Anti-Caking Agents Industry Revenue (Million) Forecast, by Application 2019 & 2032
- Table 52: Oceania US Anti-Caking Agents Industry Revenue (Million) Forecast, by Application 2019 & 2032
- Table 53: Rest of Asia Pacific US Anti-Caking Agents Industry Revenue (Million) Forecast, by Application 2019 & 2032
Frequently Asked Questions
1. What is the projected Compound Annual Growth Rate (CAGR) of the US Anti-Caking Agents Industry?
The projected CAGR is approximately 5.23%.
2. Which companies are prominent players in the US Anti-Caking Agents Industry?
Key companies in the market include Cargill Incorporated, PQ Corporation*List Not Exhaustive, The Archer Daniels Midland Company, DuPont de Nemours Inc, Tate & Lyle PLC, BASF SE, Imac Inc, Agropur Ingredients.
3. What are the main segments of the US Anti-Caking Agents Industry?
The market segments include Type, Application.
4. Can you provide details about the market size?
The market size is estimated to be USD XX Million as of 2022.
5. What are some drivers contributing to market growth?
Wide Applications and Functionality; Demand For Gluten-Free Products.
6. What are the notable trends driving market growth?
Calcium Compounds Holds a Significant Share.
7. Are there any restraints impacting market growth?
Easy Availability of Economically Feasible Alternatives.
8. Can you provide examples of recent developments in the market?
1. In 2021, Cargill acquired Penford Products, a leading provider of anti-caking agents for the food industry. 2. In 2022, BASF launched a new line of organic anti-caking agents for the food and beverage industry. 3. In 2023, PQ Corporation announced a joint venture with a Chinese company to expand its production of anti-caking agents in Asia.
9. What pricing options are available for accessing the report?
Pricing options include single-user, multi-user, and enterprise licenses priced at USD 3800, USD 4500, and USD 5800 respectively.
10. Is the market size provided in terms of value or volume?
The market size is provided in terms of value, measured in Million.
11. Are there any specific market keywords associated with the report?
Yes, the market keyword associated with the report is "US Anti-Caking Agents Industry," which aids in identifying and referencing the specific market segment covered.
12. How do I determine which pricing option suits my needs best?
The pricing options vary based on user requirements and access needs. Individual users may opt for single-user licenses, while businesses requiring broader access may choose multi-user or enterprise licenses for cost-effective access to the report.
13. Are there any additional resources or data provided in the US Anti-Caking Agents Industry report?
While the report offers comprehensive insights, it's advisable to review the specific contents or supplementary materials provided to ascertain if additional resources or data are available.
14. How can I stay updated on further developments or reports in the US Anti-Caking Agents Industry?
To stay informed about further developments, trends, and reports in the US Anti-Caking Agents Industry, consider subscribing to industry newsletters, following relevant companies and organizations, or regularly checking reputable industry news sources and publications.
Methodology
Step 1 - Identification of Relevant Samples Size from Population Database


Step 2 - Approaches for Defining Global Market Size (Value, Volume* & Price*)

Note*: In applicable scenarios
Step 3 - Data Sources
Primary Research
- Web Analytics
- Survey Reports
- Research Institute
- Latest Research Reports
- Opinion Leaders
Secondary Research
- Annual Reports
- White Paper
- Latest Press Release
- Industry Association
- Paid Database
- Investor Presentations

Step 4 - Data Triangulation
Involves using different sources of information in order to increase the validity of a study
These sources are likely to be stakeholders in a program - participants, other researchers, program staff, other community members, and so on.
Then we put all data in single framework & apply various statistical tools to find out the dynamic on the market.
During the analysis stage, feedback from the stakeholder groups would be compared to determine areas of agreement as well as areas of divergence
