

Key Insights
The US energy drink market is poised for significant expansion from 2025 to 2033. Growing consumer demand for convenient energy solutions, particularly health-conscious options such as sugar-free and natural formulations, is a key growth driver. This trend underscores an increasing focus on health and wellness, prompting manufacturers to develop innovative, healthier products. The market is segmented by packaging (glass bottles, metal cans, PET bottles), distribution channels (off-trade, on-trade), and drink type (energy shots, natural/organic, sugar-free/low-calorie, traditional, other). While established brands like Red Bull, Monster Beverage Corporation, and PepsiCo hold substantial market share, emerging niche brands have significant growth opportunities. The traditional segment remains strong, but natural/organic options and energy shots are experiencing rapid growth, indicating evolving consumer preferences. Intense competition characterizes the market, with both established players and new entrants striving for market share. Future growth will be shaped by evolving consumer tastes, product innovation, strategic marketing, and regulatory developments.
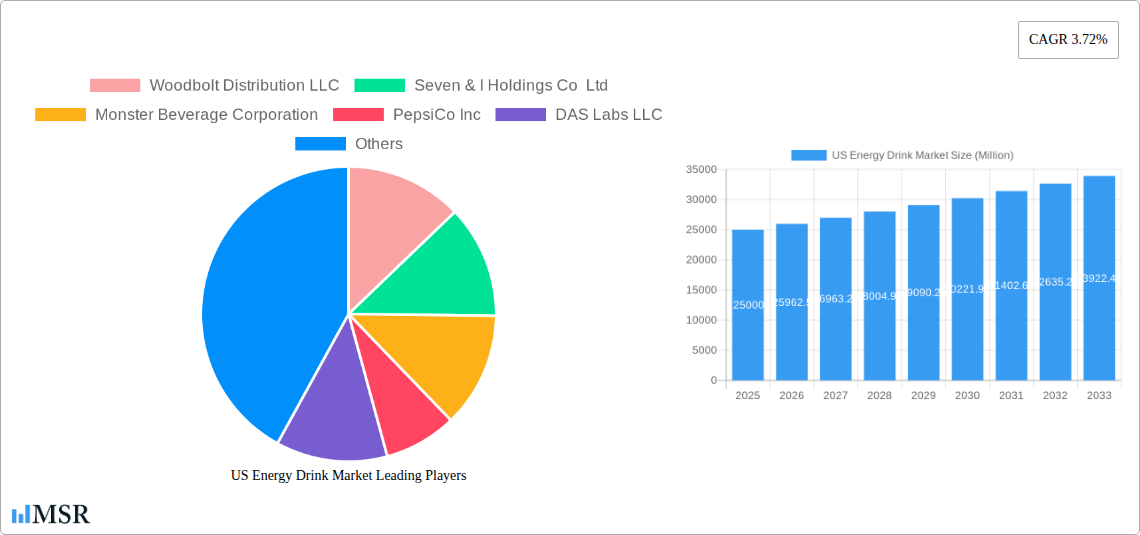
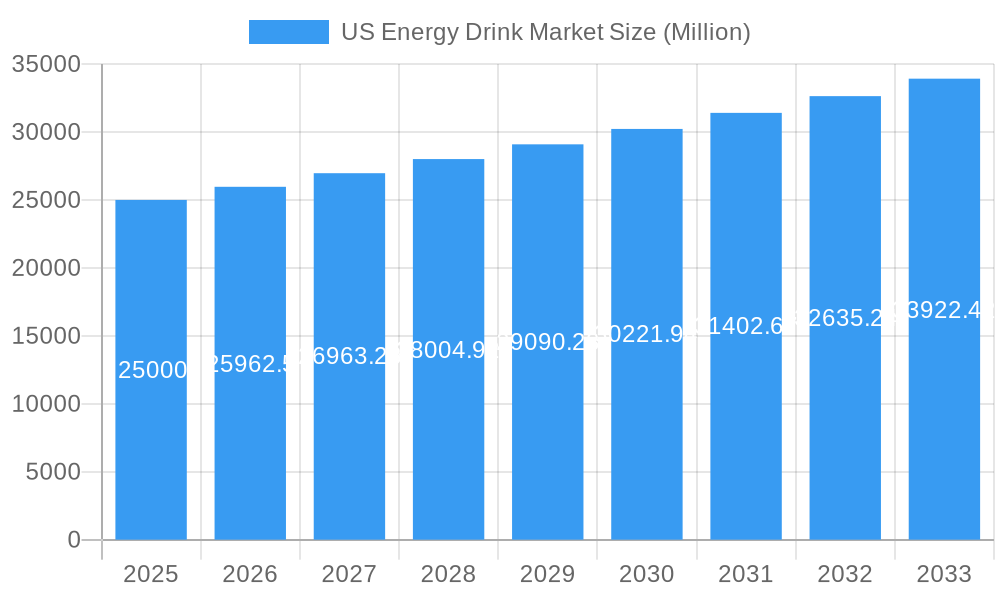
US Energy Drink Market Market Size (In Billion)
The US energy drink market is projected to grow at a Compound Annual Growth Rate (CAGR) of 2.33%, reaching a market size of $50.33 billion by 2025. This consistent expansion is attributed to an increasing consumer base and the continuous introduction of diverse product offerings. However, challenges persist, including growing health concerns regarding sugar intake and the rise of alternative beverages. Brands that can effectively balance energy provision with health-conscious appeal, coupled with transparent ingredient sourcing and marketing, will build consumer trust. Geographical variations in consumption and regulatory environments within the US will also necessitate strategic adaptation from market participants.
US Energy Drink Market Company Market Share
US Energy Drink Market: A Comprehensive Report (2019-2033)
This comprehensive report provides a detailed analysis of the US energy drink market, encompassing market size, segmentation, competitive landscape, and future growth projections from 2019 to 2033. The report is essential for industry stakeholders, investors, and market researchers seeking actionable insights into this dynamic sector. With a base year of 2025 and a forecast period of 2025-2033, this in-depth study offers invaluable data and analysis to inform strategic decision-making. The market is valued at xx Million in 2025 and is projected to reach xx Million by 2033, exhibiting a CAGR of xx%.
US Energy Drink Market Market Concentration & Dynamics
The US energy drink market exhibits a moderately concentrated landscape, dominated by established players like Monster Beverage Corporation, PepsiCo Inc, and Red Bull GmbH, while smaller players like Zevia LLC and DAS Labs LLC are actively carving out niches. Market share analysis reveals that the top three players account for approximately xx% of the total market revenue. The market is characterized by intense competition, fueled by continuous innovation and marketing efforts.
- Market Concentration: High, with a few dominant players.
- Innovation Ecosystem: Active, with a focus on new flavors, functional ingredients, and sustainable packaging.
- Regulatory Framework: Subject to FDA regulations concerning ingredients and labeling.
- Substitute Products: Other caffeinated beverages, sports drinks, and functional beverages pose some competition.
- End-User Trends: Growing demand for healthier options (low-sugar, natural, organic) and functional benefits (enhanced performance, cognitive enhancement).
- M&A Activities: Significant, as evidenced by recent acquisitions like Monster Beverage Corporation's acquisition of Bang Energy for USD 362 Million in July 2023, indicating consolidation and expansion strategies among key players. The number of M&A deals in the historical period (2019-2024) totaled approximately xx.
US Energy Drink Market Industry Insights & Trends
The US energy drink market is experiencing robust growth, propelled by several key factors. Increasing consumer demand for convenient energy boosts, particularly among young adults and working professionals, fuels market expansion. Changing lifestyles, demanding work schedules, and a rise in fitness activities contribute to the sustained demand for these beverages. Technological advancements in product formulation (e.g., incorporating natural sweeteners, functional ingredients) also drive growth. The market size is currently estimated at xx Million, exhibiting a healthy Compound Annual Growth Rate (CAGR) of xx% during the forecast period. Moreover, evolving consumer preferences towards healthier options and increased focus on functional benefits are reshaping the landscape, with segments such as sugar-free and natural/organic energy drinks experiencing significant growth. Marketing innovations and strategic partnerships also play a crucial role in the market's dynamism.
Key Markets & Segments Leading US Energy Drink Market
The US energy drink market demonstrates regional variations in consumption patterns. However, no single region, state, or city is markedly dominant across all segments. The most impactful segment analyses are:
- Packaging Type: Metal cans currently dominate due to cost-effectiveness and convenience, followed by PET bottles, which are gaining popularity for their lightweight and recyclability attributes. Glass bottles maintain a smaller market share, mainly in premium segments.
- Distribution Channel: Off-trade channels (grocery stores, convenience stores, supermarkets) account for the majority of sales, reflecting the widespread accessibility and impulsive nature of purchases. On-trade channels (restaurants, bars, cafes) represent a smaller but still significant portion, catering to specific consumer settings.
- Soft Drink Type: Traditional energy drinks continue to hold the largest market share, although the demand for sugar-free/low-calorie and natural/organic options is rapidly increasing. This reflects a growing health-conscious consumer base.
Drivers for growth across segments:
- Economic Growth: Disposable income growth influences spending on premium and functional beverages.
- Infrastructure Development: Improved retail infrastructure (convenience stores, supermarkets) enhances product accessibility.
- Consumer Preferences: Growing awareness of healthy options drives the expansion of natural/organic and low-sugar segments.
US Energy Drink Market Product Developments
The US energy drink market is witnessing significant product innovation, driven by consumer demand for healthier and more functional beverages. Companies are incorporating natural ingredients, adapting to new dietary preferences, and experimenting with unique flavor profiles to enhance their competitive edge. This includes the introduction of sugar-free variants, natural/organic options, and energy drinks fortified with vitamins or other functional ingredients.
Challenges in the US Energy Drink Market Market
The US energy drink market faces several challenges, including:
- Intense Competition: The market is highly competitive, with major players vying for market share.
- Regulatory Scrutiny: Increasing regulatory scrutiny concerning ingredients and marketing claims can impact product development and market entry.
- Supply Chain Disruptions: Global supply chain issues can affect production costs and availability of raw materials. This accounts for approximately xx% of the total challenge.
Forces Driving US Energy Drink Market Growth
Several factors contribute to the growth of the US energy drink market:
- Increased Consumer Demand: Rising health-consciousness drives the demand for healthier alternatives.
- Technological Advancements: Innovation in formulation and packaging improves product appeal and shelf life.
- Favorable Economic Conditions: Growing disposable incomes contribute to increased consumer spending.
Challenges in the US Energy Drink Market Market
Long-term growth hinges on the industry's ability to meet the evolving consumer demands for healthier products. Strategic partnerships, technological innovations in both production and formulation, and expansion into new global markets, particularly those showing high growth potential, are essential for sustaining long-term expansion.
Emerging Opportunities in US Energy Drink Market
Emerging opportunities reside in:
- Functional Energy Drinks: Incorporating additional health benefits beyond energy boosts.
- Sustainable Packaging: Shifting towards eco-friendly packaging materials.
- Expansion into Niche Markets: Catering to specific dietary needs and preferences (e.g., keto-friendly, vegan).
Leading Players in the US Energy Drink Market Sector
- Woodbolt Distribution LLC
- Seven & I Holdings Co Ltd
- Monster Beverage Corporation
- PepsiCo Inc
- DAS Labs LLC
- Red Bull GmbH
- Living Essentials LLC
- Zevia LL
- The Coca-Cola Company
- N V E Pharmaceuticals
- Congo Brands
Key Milestones in US Energy Drink Market Industry
- July 2023: Monster Beverage Corporation acquired Bang Energy for USD 362 Million, significantly altering the market landscape.
- July 2023: WWE and Nutrabolt launched a co-branded energy drink, signifying strategic collaborations expanding brand reach.
- July 2023: Zevia LLC explored new distribution strategies, indicating potential market expansion plans.
Strategic Outlook for US Energy Drink Market Market
The US energy drink market presents significant growth potential, driven by the increasing demand for convenient and functional beverages. Strategic partnerships, technological innovation, and expansion into emerging markets will play crucial roles in shaping the future of this dynamic sector. Companies focusing on product diversification, sustainable practices, and meeting evolving consumer preferences will be best positioned for success.
US Energy Drink Market Segmentation
-
1. Soft Drink Type
- 1.1. Energy Shots
- 1.2. Natural/Organic Energy Drinks
- 1.3. Sugar-free or Low-calories Energy Drinks
- 1.4. Traditional Energy Drinks
- 1.5. Other Energy Drinks
-
2. Packaging Type
- 2.1. Glass Bottles
- 2.2. Metal Can
- 2.3. PET Bottles
-
3. Distribution Channel
-
3.1. Off-trade
- 3.1.1. Convenience Stores
- 3.1.2. Online Retail
- 3.1.3. Supermarket/Hypermarket
- 3.1.4. Others
- 3.2. On-trade
-
3.1. Off-trade
US Energy Drink Market Segmentation By Geography
-
1. North America
- 1.1. United States
- 1.2. Canada
- 1.3. Mexico
-
2. South America
- 2.1. Brazil
- 2.2. Argentina
- 2.3. Rest of South America
-
3. Europe
- 3.1. United Kingdom
- 3.2. Germany
- 3.3. France
- 3.4. Italy
- 3.5. Spain
- 3.6. Russia
- 3.7. Benelux
- 3.8. Nordics
- 3.9. Rest of Europe
-
4. Middle East & Africa
- 4.1. Turkey
- 4.2. Israel
- 4.3. GCC
- 4.4. North Africa
- 4.5. South Africa
- 4.6. Rest of Middle East & Africa
-
5. Asia Pacific
- 5.1. China
- 5.2. India
- 5.3. Japan
- 5.4. South Korea
- 5.5. ASEAN
- 5.6. Oceania
- 5.7. Rest of Asia Pacific
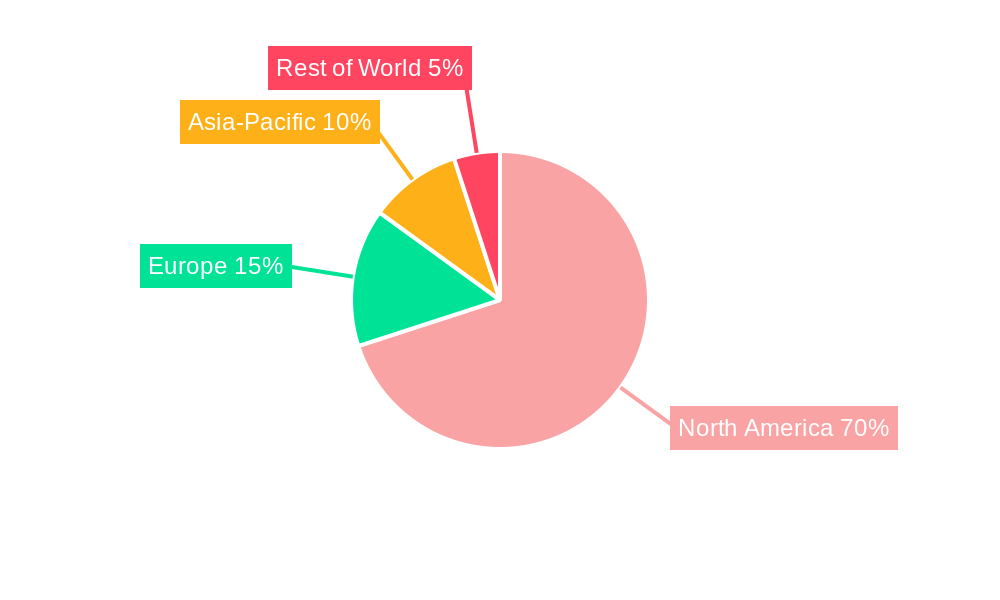
US Energy Drink Market Regional Market Share
Geographic Coverage of US Energy Drink Market
US Energy Drink Market REPORT HIGHLIGHTS
| Aspects | Details |
|---|---|
| Study Period | 2020-2034 |
| Base Year | 2025 |
| Estimated Year | 2026 |
| Forecast Period | 2026-2034 |
| Historical Period | 2020-2025 |
| Growth Rate | CAGR of 2.33% from 2020-2034 |
| Segmentation |
|
Table of Contents
- 1. Introduction
- 1.1. Research Scope
- 1.2. Market Segmentation
- 1.3. Research Objective
- 1.4. Definitions and Assumptions
- 2. Executive Summary
- 2.1. Market Snapshot
- 3. Market Dynamics
- 3.1. Market Drivers
- 3.2. Market Restrains
- 3.3. Market Trends
- 3.4. Market Opportunities
- 4. Market Factor Analysis
- 4.1. Porters Five Forces
- 4.1.1. Bargaining Power of Suppliers
- 4.1.2. Bargaining Power of Buyers
- 4.1.3. Threat of New Entrants
- 4.1.4. Threat of Substitutes
- 4.1.5. Competitive Rivalry
- 4.2. PESTEL analysis
- 4.3. BCG Analysis
- 4.3.1. Stars (High Growth, High Market Share)
- 4.3.2. Cash Cows (Low Growth, High Market Share)
- 4.3.3. Question Mark (High Growth, Low Market Share)
- 4.3.4. Dogs (Low Growth, Low Market Share)
- 4.4. Ansoff Matrix Analysis
- 4.5. Supply Chain Analysis
- 4.6. Regulatory Landscape
- 4.7. Current Market Potential and Opportunity Assessment (TAM–SAM–SOM Framework)
- 4.8. MSR Analyst Note
- 4.1. Porters Five Forces
- 5. Market Analysis, Insights and Forecast 2021-2033
- 5.1. Market Analysis, Insights and Forecast - by Soft Drink Type
- 5.1.1. Energy Shots
- 5.1.2. Natural/Organic Energy Drinks
- 5.1.3. Sugar-free or Low-calories Energy Drinks
- 5.1.4. Traditional Energy Drinks
- 5.1.5. Other Energy Drinks
- 5.2. Market Analysis, Insights and Forecast - by Packaging Type
- 5.2.1. Glass Bottles
- 5.2.2. Metal Can
- 5.2.3. PET Bottles
- 5.3. Market Analysis, Insights and Forecast - by Distribution Channel
- 5.3.1. Off-trade
- 5.3.1.1. Convenience Stores
- 5.3.1.2. Online Retail
- 5.3.1.3. Supermarket/Hypermarket
- 5.3.1.4. Others
- 5.3.2. On-trade
- 5.3.1. Off-trade
- 5.4. Market Analysis, Insights and Forecast - by Region
- 5.4.1. North America
- 5.4.2. South America
- 5.4.3. Europe
- 5.4.4. Middle East & Africa
- 5.4.5. Asia Pacific
- 5.1. Market Analysis, Insights and Forecast - by Soft Drink Type
- 6. Global US Energy Drink Market Analysis, Insights and Forecast, 2021-2033
- 6.1. Market Analysis, Insights and Forecast - by Soft Drink Type
- 6.1.1. Energy Shots
- 6.1.2. Natural/Organic Energy Drinks
- 6.1.3. Sugar-free or Low-calories Energy Drinks
- 6.1.4. Traditional Energy Drinks
- 6.1.5. Other Energy Drinks
- 6.2. Market Analysis, Insights and Forecast - by Packaging Type
- 6.2.1. Glass Bottles
- 6.2.2. Metal Can
- 6.2.3. PET Bottles
- 6.3. Market Analysis, Insights and Forecast - by Distribution Channel
- 6.3.1. Off-trade
- 6.3.1.1. Convenience Stores
- 6.3.1.2. Online Retail
- 6.3.1.3. Supermarket/Hypermarket
- 6.3.1.4. Others
- 6.3.2. On-trade
- 6.3.1. Off-trade
- 6.1. Market Analysis, Insights and Forecast - by Soft Drink Type
- 7. North America US Energy Drink Market Analysis, Insights and Forecast, 2020-2032
- 7.1. Market Analysis, Insights and Forecast - by Soft Drink Type
- 7.1.1. Energy Shots
- 7.1.2. Natural/Organic Energy Drinks
- 7.1.3. Sugar-free or Low-calories Energy Drinks
- 7.1.4. Traditional Energy Drinks
- 7.1.5. Other Energy Drinks
- 7.2. Market Analysis, Insights and Forecast - by Packaging Type
- 7.2.1. Glass Bottles
- 7.2.2. Metal Can
- 7.2.3. PET Bottles
- 7.3. Market Analysis, Insights and Forecast - by Distribution Channel
- 7.3.1. Off-trade
- 7.3.1.1. Convenience Stores
- 7.3.1.2. Online Retail
- 7.3.1.3. Supermarket/Hypermarket
- 7.3.1.4. Others
- 7.3.2. On-trade
- 7.3.1. Off-trade
- 7.1. Market Analysis, Insights and Forecast - by Soft Drink Type
- 8. South America US Energy Drink Market Analysis, Insights and Forecast, 2020-2032
- 8.1. Market Analysis, Insights and Forecast - by Soft Drink Type
- 8.1.1. Energy Shots
- 8.1.2. Natural/Organic Energy Drinks
- 8.1.3. Sugar-free or Low-calories Energy Drinks
- 8.1.4. Traditional Energy Drinks
- 8.1.5. Other Energy Drinks
- 8.2. Market Analysis, Insights and Forecast - by Packaging Type
- 8.2.1. Glass Bottles
- 8.2.2. Metal Can
- 8.2.3. PET Bottles
- 8.3. Market Analysis, Insights and Forecast - by Distribution Channel
- 8.3.1. Off-trade
- 8.3.1.1. Convenience Stores
- 8.3.1.2. Online Retail
- 8.3.1.3. Supermarket/Hypermarket
- 8.3.1.4. Others
- 8.3.2. On-trade
- 8.3.1. Off-trade
- 8.1. Market Analysis, Insights and Forecast - by Soft Drink Type
- 9. Europe US Energy Drink Market Analysis, Insights and Forecast, 2020-2032
- 9.1. Market Analysis, Insights and Forecast - by Soft Drink Type
- 9.1.1. Energy Shots
- 9.1.2. Natural/Organic Energy Drinks
- 9.1.3. Sugar-free or Low-calories Energy Drinks
- 9.1.4. Traditional Energy Drinks
- 9.1.5. Other Energy Drinks
- 9.2. Market Analysis, Insights and Forecast - by Packaging Type
- 9.2.1. Glass Bottles
- 9.2.2. Metal Can
- 9.2.3. PET Bottles
- 9.3. Market Analysis, Insights and Forecast - by Distribution Channel
- 9.3.1. Off-trade
- 9.3.1.1. Convenience Stores
- 9.3.1.2. Online Retail
- 9.3.1.3. Supermarket/Hypermarket
- 9.3.1.4. Others
- 9.3.2. On-trade
- 9.3.1. Off-trade
- 9.1. Market Analysis, Insights and Forecast - by Soft Drink Type
- 10. Middle East & Africa US Energy Drink Market Analysis, Insights and Forecast, 2020-2032
- 10.1. Market Analysis, Insights and Forecast - by Soft Drink Type
- 10.1.1. Energy Shots
- 10.1.2. Natural/Organic Energy Drinks
- 10.1.3. Sugar-free or Low-calories Energy Drinks
- 10.1.4. Traditional Energy Drinks
- 10.1.5. Other Energy Drinks
- 10.2. Market Analysis, Insights and Forecast - by Packaging Type
- 10.2.1. Glass Bottles
- 10.2.2. Metal Can
- 10.2.3. PET Bottles
- 10.3. Market Analysis, Insights and Forecast - by Distribution Channel
- 10.3.1. Off-trade
- 10.3.1.1. Convenience Stores
- 10.3.1.2. Online Retail
- 10.3.1.3. Supermarket/Hypermarket
- 10.3.1.4. Others
- 10.3.2. On-trade
- 10.3.1. Off-trade
- 10.1. Market Analysis, Insights and Forecast - by Soft Drink Type
- 11. Asia Pacific US Energy Drink Market Analysis, Insights and Forecast, 2020-2032
- 11.1. Market Analysis, Insights and Forecast - by Soft Drink Type
- 11.1.1. Energy Shots
- 11.1.2. Natural/Organic Energy Drinks
- 11.1.3. Sugar-free or Low-calories Energy Drinks
- 11.1.4. Traditional Energy Drinks
- 11.1.5. Other Energy Drinks
- 11.2. Market Analysis, Insights and Forecast - by Packaging Type
- 11.2.1. Glass Bottles
- 11.2.2. Metal Can
- 11.2.3. PET Bottles
- 11.3. Market Analysis, Insights and Forecast - by Distribution Channel
- 11.3.1. Off-trade
- 11.3.1.1. Convenience Stores
- 11.3.1.2. Online Retail
- 11.3.1.3. Supermarket/Hypermarket
- 11.3.1.4. Others
- 11.3.2. On-trade
- 11.3.1. Off-trade
- 11.1. Market Analysis, Insights and Forecast - by Soft Drink Type
- 12. Competitive Analysis
- 12.1. Company Profiles
- 12.1.1 Woodbolt Distribution LLC
- 12.1.1.1. Company Overview
- 12.1.1.2. Products
- 12.1.1.3. Company Financials
- 12.1.1.4. SWOT Analysis
- 12.1.2 Seven & I Holdings Co Ltd
- 12.1.2.1. Company Overview
- 12.1.2.2. Products
- 12.1.2.3. Company Financials
- 12.1.2.4. SWOT Analysis
- 12.1.3 Monster Beverage Corporation
- 12.1.3.1. Company Overview
- 12.1.3.2. Products
- 12.1.3.3. Company Financials
- 12.1.3.4. SWOT Analysis
- 12.1.4 PepsiCo Inc
- 12.1.4.1. Company Overview
- 12.1.4.2. Products
- 12.1.4.3. Company Financials
- 12.1.4.4. SWOT Analysis
- 12.1.5 DAS Labs LLC
- 12.1.5.1. Company Overview
- 12.1.5.2. Products
- 12.1.5.3. Company Financials
- 12.1.5.4. SWOT Analysis
- 12.1.6 Red Bull GmbH
- 12.1.6.1. Company Overview
- 12.1.6.2. Products
- 12.1.6.3. Company Financials
- 12.1.6.4. SWOT Analysis
- 12.1.7 Living Essentials LLC
- 12.1.7.1. Company Overview
- 12.1.7.2. Products
- 12.1.7.3. Company Financials
- 12.1.7.4. SWOT Analysis
- 12.1.8 Zevia LL
- 12.1.8.1. Company Overview
- 12.1.8.2. Products
- 12.1.8.3. Company Financials
- 12.1.8.4. SWOT Analysis
- 12.1.9 The Coca-Cola Company
- 12.1.9.1. Company Overview
- 12.1.9.2. Products
- 12.1.9.3. Company Financials
- 12.1.9.4. SWOT Analysis
- 12.1.10 N V E Pharmaceuticals
- 12.1.10.1. Company Overview
- 12.1.10.2. Products
- 12.1.10.3. Company Financials
- 12.1.10.4. SWOT Analysis
- 12.1.11 Congo Brands
- 12.1.11.1. Company Overview
- 12.1.11.2. Products
- 12.1.11.3. Company Financials
- 12.1.11.4. SWOT Analysis
- 12.1.1 Woodbolt Distribution LLC
- 12.2. Market Entropy
- 12.2.1 Company's Key Areas Served
- 12.2.2 Recent Developments
- 12.3. Company Market Share Analysis 2025
- 12.3.1 Top 5 Companies Market Share Analysis
- 12.3.2 Top 3 Companies Market Share Analysis
- 12.4. List of Potential Customers
- 13. Research Methodology
List of Figures
- Figure 1: Global US Energy Drink Market Revenue Breakdown (billion, %) by Region 2025 & 2033
- Figure 2: North America US Energy Drink Market Revenue (billion), by Soft Drink Type 2025 & 2033
- Figure 3: North America US Energy Drink Market Revenue Share (%), by Soft Drink Type 2025 & 2033
- Figure 4: North America US Energy Drink Market Revenue (billion), by Packaging Type 2025 & 2033
- Figure 5: North America US Energy Drink Market Revenue Share (%), by Packaging Type 2025 & 2033
- Figure 6: North America US Energy Drink Market Revenue (billion), by Distribution Channel 2025 & 2033
- Figure 7: North America US Energy Drink Market Revenue Share (%), by Distribution Channel 2025 & 2033
- Figure 8: North America US Energy Drink Market Revenue (billion), by Country 2025 & 2033
- Figure 9: North America US Energy Drink Market Revenue Share (%), by Country 2025 & 2033
- Figure 10: South America US Energy Drink Market Revenue (billion), by Soft Drink Type 2025 & 2033
- Figure 11: South America US Energy Drink Market Revenue Share (%), by Soft Drink Type 2025 & 2033
- Figure 12: South America US Energy Drink Market Revenue (billion), by Packaging Type 2025 & 2033
- Figure 13: South America US Energy Drink Market Revenue Share (%), by Packaging Type 2025 & 2033
- Figure 14: South America US Energy Drink Market Revenue (billion), by Distribution Channel 2025 & 2033
- Figure 15: South America US Energy Drink Market Revenue Share (%), by Distribution Channel 2025 & 2033
- Figure 16: South America US Energy Drink Market Revenue (billion), by Country 2025 & 2033
- Figure 17: South America US Energy Drink Market Revenue Share (%), by Country 2025 & 2033
- Figure 18: Europe US Energy Drink Market Revenue (billion), by Soft Drink Type 2025 & 2033
- Figure 19: Europe US Energy Drink Market Revenue Share (%), by Soft Drink Type 2025 & 2033
- Figure 20: Europe US Energy Drink Market Revenue (billion), by Packaging Type 2025 & 2033
- Figure 21: Europe US Energy Drink Market Revenue Share (%), by Packaging Type 2025 & 2033
- Figure 22: Europe US Energy Drink Market Revenue (billion), by Distribution Channel 2025 & 2033
- Figure 23: Europe US Energy Drink Market Revenue Share (%), by Distribution Channel 2025 & 2033
- Figure 24: Europe US Energy Drink Market Revenue (billion), by Country 2025 & 2033
- Figure 25: Europe US Energy Drink Market Revenue Share (%), by Country 2025 & 2033
- Figure 26: Middle East & Africa US Energy Drink Market Revenue (billion), by Soft Drink Type 2025 & 2033
- Figure 27: Middle East & Africa US Energy Drink Market Revenue Share (%), by Soft Drink Type 2025 & 2033
- Figure 28: Middle East & Africa US Energy Drink Market Revenue (billion), by Packaging Type 2025 & 2033
- Figure 29: Middle East & Africa US Energy Drink Market Revenue Share (%), by Packaging Type 2025 & 2033
- Figure 30: Middle East & Africa US Energy Drink Market Revenue (billion), by Distribution Channel 2025 & 2033
- Figure 31: Middle East & Africa US Energy Drink Market Revenue Share (%), by Distribution Channel 2025 & 2033
- Figure 32: Middle East & Africa US Energy Drink Market Revenue (billion), by Country 2025 & 2033
- Figure 33: Middle East & Africa US Energy Drink Market Revenue Share (%), by Country 2025 & 2033
- Figure 34: Asia Pacific US Energy Drink Market Revenue (billion), by Soft Drink Type 2025 & 2033
- Figure 35: Asia Pacific US Energy Drink Market Revenue Share (%), by Soft Drink Type 2025 & 2033
- Figure 36: Asia Pacific US Energy Drink Market Revenue (billion), by Packaging Type 2025 & 2033
- Figure 37: Asia Pacific US Energy Drink Market Revenue Share (%), by Packaging Type 2025 & 2033
- Figure 38: Asia Pacific US Energy Drink Market Revenue (billion), by Distribution Channel 2025 & 2033
- Figure 39: Asia Pacific US Energy Drink Market Revenue Share (%), by Distribution Channel 2025 & 2033
- Figure 40: Asia Pacific US Energy Drink Market Revenue (billion), by Country 2025 & 2033
- Figure 41: Asia Pacific US Energy Drink Market Revenue Share (%), by Country 2025 & 2033
List of Tables
- Table 1: Global US Energy Drink Market Revenue billion Forecast, by Soft Drink Type 2020 & 2033
- Table 2: Global US Energy Drink Market Revenue billion Forecast, by Packaging Type 2020 & 2033
- Table 3: Global US Energy Drink Market Revenue billion Forecast, by Distribution Channel 2020 & 2033
- Table 4: Global US Energy Drink Market Revenue billion Forecast, by Region 2020 & 2033
- Table 5: Global US Energy Drink Market Revenue billion Forecast, by Soft Drink Type 2020 & 2033
- Table 6: Global US Energy Drink Market Revenue billion Forecast, by Packaging Type 2020 & 2033
- Table 7: Global US Energy Drink Market Revenue billion Forecast, by Distribution Channel 2020 & 2033
- Table 8: Global US Energy Drink Market Revenue billion Forecast, by Country 2020 & 2033
- Table 9: United States US Energy Drink Market Revenue (billion) Forecast, by Application 2020 & 2033
- Table 10: Canada US Energy Drink Market Revenue (billion) Forecast, by Application 2020 & 2033
- Table 11: Mexico US Energy Drink Market Revenue (billion) Forecast, by Application 2020 & 2033
- Table 12: Global US Energy Drink Market Revenue billion Forecast, by Soft Drink Type 2020 & 2033
- Table 13: Global US Energy Drink Market Revenue billion Forecast, by Packaging Type 2020 & 2033
- Table 14: Global US Energy Drink Market Revenue billion Forecast, by Distribution Channel 2020 & 2033
- Table 15: Global US Energy Drink Market Revenue billion Forecast, by Country 2020 & 2033
- Table 16: Brazil US Energy Drink Market Revenue (billion) Forecast, by Application 2020 & 2033
- Table 17: Argentina US Energy Drink Market Revenue (billion) Forecast, by Application 2020 & 2033
- Table 18: Rest of South America US Energy Drink Market Revenue (billion) Forecast, by Application 2020 & 2033
- Table 19: Global US Energy Drink Market Revenue billion Forecast, by Soft Drink Type 2020 & 2033
- Table 20: Global US Energy Drink Market Revenue billion Forecast, by Packaging Type 2020 & 2033
- Table 21: Global US Energy Drink Market Revenue billion Forecast, by Distribution Channel 2020 & 2033
- Table 22: Global US Energy Drink Market Revenue billion Forecast, by Country 2020 & 2033
- Table 23: United Kingdom US Energy Drink Market Revenue (billion) Forecast, by Application 2020 & 2033
- Table 24: Germany US Energy Drink Market Revenue (billion) Forecast, by Application 2020 & 2033
- Table 25: France US Energy Drink Market Revenue (billion) Forecast, by Application 2020 & 2033
- Table 26: Italy US Energy Drink Market Revenue (billion) Forecast, by Application 2020 & 2033
- Table 27: Spain US Energy Drink Market Revenue (billion) Forecast, by Application 2020 & 2033
- Table 28: Russia US Energy Drink Market Revenue (billion) Forecast, by Application 2020 & 2033
- Table 29: Benelux US Energy Drink Market Revenue (billion) Forecast, by Application 2020 & 2033
- Table 30: Nordics US Energy Drink Market Revenue (billion) Forecast, by Application 2020 & 2033
- Table 31: Rest of Europe US Energy Drink Market Revenue (billion) Forecast, by Application 2020 & 2033
- Table 32: Global US Energy Drink Market Revenue billion Forecast, by Soft Drink Type 2020 & 2033
- Table 33: Global US Energy Drink Market Revenue billion Forecast, by Packaging Type 2020 & 2033
- Table 34: Global US Energy Drink Market Revenue billion Forecast, by Distribution Channel 2020 & 2033
- Table 35: Global US Energy Drink Market Revenue billion Forecast, by Country 2020 & 2033
- Table 36: Turkey US Energy Drink Market Revenue (billion) Forecast, by Application 2020 & 2033
- Table 37: Israel US Energy Drink Market Revenue (billion) Forecast, by Application 2020 & 2033
- Table 38: GCC US Energy Drink Market Revenue (billion) Forecast, by Application 2020 & 2033
- Table 39: North Africa US Energy Drink Market Revenue (billion) Forecast, by Application 2020 & 2033
- Table 40: South Africa US Energy Drink Market Revenue (billion) Forecast, by Application 2020 & 2033
- Table 41: Rest of Middle East & Africa US Energy Drink Market Revenue (billion) Forecast, by Application 2020 & 2033
- Table 42: Global US Energy Drink Market Revenue billion Forecast, by Soft Drink Type 2020 & 2033
- Table 43: Global US Energy Drink Market Revenue billion Forecast, by Packaging Type 2020 & 2033
- Table 44: Global US Energy Drink Market Revenue billion Forecast, by Distribution Channel 2020 & 2033
- Table 45: Global US Energy Drink Market Revenue billion Forecast, by Country 2020 & 2033
- Table 46: China US Energy Drink Market Revenue (billion) Forecast, by Application 2020 & 2033
- Table 47: India US Energy Drink Market Revenue (billion) Forecast, by Application 2020 & 2033
- Table 48: Japan US Energy Drink Market Revenue (billion) Forecast, by Application 2020 & 2033
- Table 49: South Korea US Energy Drink Market Revenue (billion) Forecast, by Application 2020 & 2033
- Table 50: ASEAN US Energy Drink Market Revenue (billion) Forecast, by Application 2020 & 2033
- Table 51: Oceania US Energy Drink Market Revenue (billion) Forecast, by Application 2020 & 2033
- Table 52: Rest of Asia Pacific US Energy Drink Market Revenue (billion) Forecast, by Application 2020 & 2033
Frequently Asked Questions
1. What is the projected Compound Annual Growth Rate (CAGR) of the US Energy Drink Market?
The projected CAGR is approximately 2.33%.
2. Which companies are prominent players in the US Energy Drink Market?
Key companies in the market include Woodbolt Distribution LLC, Seven & I Holdings Co Ltd, Monster Beverage Corporation, PepsiCo Inc, DAS Labs LLC, Red Bull GmbH, Living Essentials LLC, Zevia LL, The Coca-Cola Company, N V E Pharmaceuticals, Congo Brands.
3. What are the main segments of the US Energy Drink Market?
The market segments include Soft Drink Type, Packaging Type, Distribution Channel.
4. Can you provide details about the market size?
The market size is estimated to be USD 50.33 billion as of 2022.
5. What are some drivers contributing to market growth?
Rising Consumer Awareness about Health and Fitness; Increasing the Use of Casein and Caseinate in Food and Beverage Industry.
6. What are the notable trends driving market growth?
OTHER KEY INDUSTRY TRENDS COVERED IN THE REPORT.
7. Are there any restraints impacting market growth?
High Competition From Alternative Protein Sources.
8. Can you provide examples of recent developments in the market?
July 2023: Monster Beverage Corporation announced that its subsidiary, Blast Asset Acquisition LLC, completed its acquisition of substantially all of the assets of Vital Pharmaceuticals, Inc. and certain of its affiliates (collectively, “Bang Energy”) for approximately USD 362 million. The acquired assets include Bang Energy beverages and a beverage production facility in Phoenix, Arizona.July 2023: WWE and Nutrabolt, owner of the C4 brand, announced an expansion to their multi-year partnership with the launch of their first-ever co-branded product collaboration: WWE-inspired flavors of C4 Ultimate Pre-Workout Powder and C4 Ultimate Energy Drink.July 2023: The Los Angeles-based company Zevia LLC is considering getting a new distribution partner to expand its base business from selling multi-packs in grocery stores to selling single-serve cold beverages in c-stores.
9. What pricing options are available for accessing the report?
Pricing options include single-user, multi-user, and enterprise licenses priced at USD 3800, USD 4500, and USD 5800 respectively.
10. Is the market size provided in terms of value or volume?
The market size is provided in terms of value, measured in billion.
11. Are there any specific market keywords associated with the report?
Yes, the market keyword associated with the report is "US Energy Drink Market," which aids in identifying and referencing the specific market segment covered.
12. How do I determine which pricing option suits my needs best?
The pricing options vary based on user requirements and access needs. Individual users may opt for single-user licenses, while businesses requiring broader access may choose multi-user or enterprise licenses for cost-effective access to the report.
13. Are there any additional resources or data provided in the US Energy Drink Market report?
While the report offers comprehensive insights, it's advisable to review the specific contents or supplementary materials provided to ascertain if additional resources or data are available.
14. How can I stay updated on further developments or reports in the US Energy Drink Market?
To stay informed about further developments, trends, and reports in the US Energy Drink Market, consider subscribing to industry newsletters, following relevant companies and organizations, or regularly checking reputable industry news sources and publications.
Methodology
Step 1 - Identification of Relevant Samples Size from Population Database


Step 2 - Approaches for Defining Global Market Size (Value, Volume* & Price*)

Note*: In applicable scenarios
Step 3 - Data Sources
Primary Research
- Web Analytics
- Survey Reports
- Research Institute
- Latest Research Reports
- Opinion Leaders
Secondary Research
- Annual Reports
- White Paper
- Latest Press Release
- Industry Association
- Paid Database
- Investor Presentations

Step 4 - Data Triangulation
Involves using different sources of information in order to increase the validity of a study
These sources are likely to be stakeholders in a program - participants, other researchers, program staff, other community members, and so on.
Then we put all data in single framework & apply various statistical tools to find out the dynamic on the market.
During the analysis stage, feedback from the stakeholder groups would be compared to determine areas of agreement as well as areas of divergence