

Key Insights
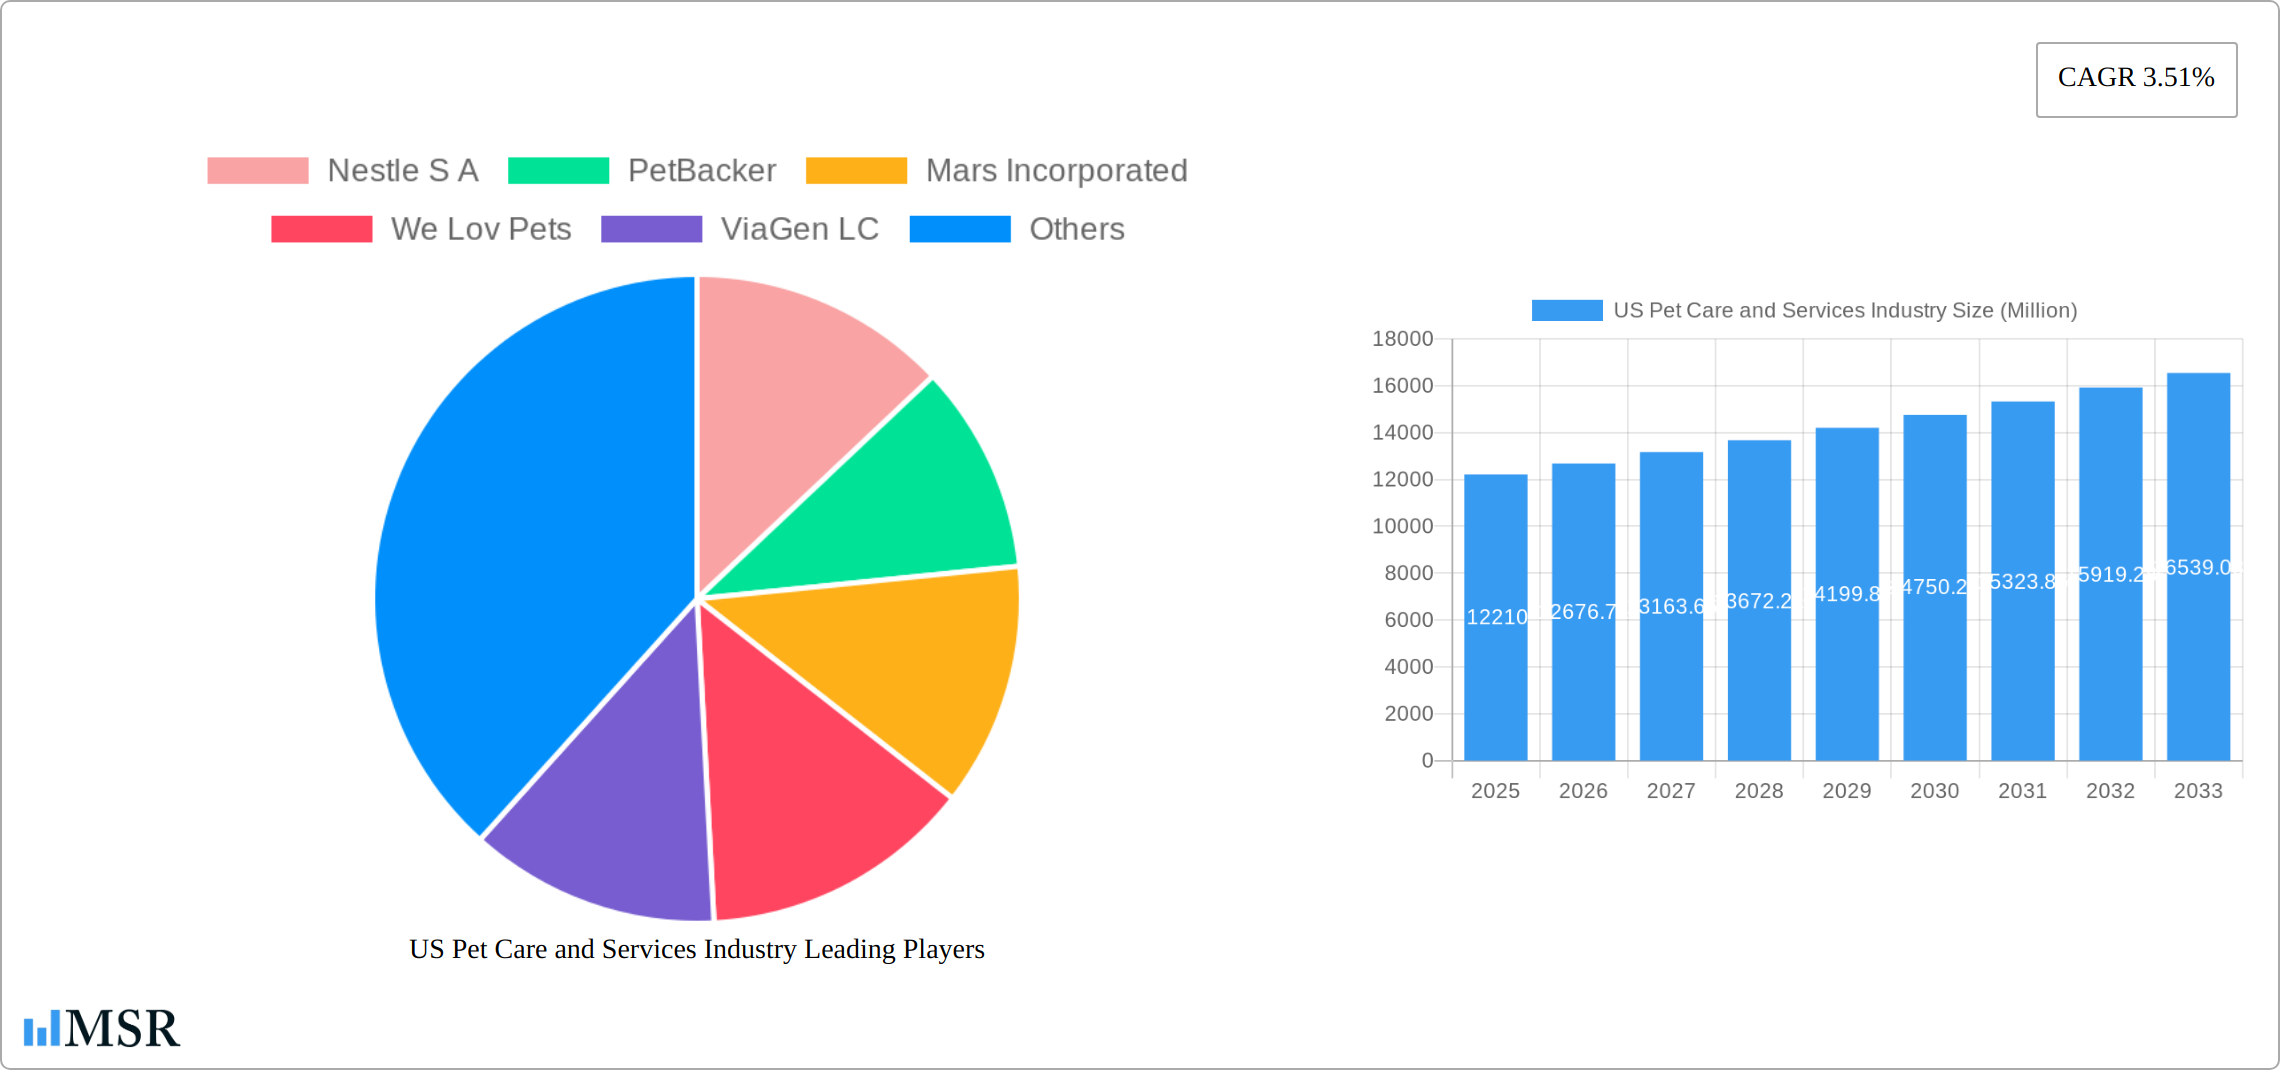
The US pet care and services industry is a robust and expanding market, projected to reach a substantial size driven by increasing pet ownership, humanization of pets, and a rising disposable income among pet owners. The market's Compound Annual Growth Rate (CAGR) of 3.51% from 2019-2033 indicates steady, consistent growth. Key drivers include the increasing preference for premium pet food and specialized pet care products, reflecting a trend towards providing pets with healthier and more enriching lives. The growing popularity of pet services like grooming, boarding, and pet sitting further fuels market expansion, especially in urban areas where convenience and access to specialized care are highly valued. While economic downturns could potentially restrain spending on non-essential pet services, the strong human-animal bond and increasing pet ownership numbers are expected to mitigate this impact, ensuring sustained growth. Segmentation reveals a significant market share held by the dog and cat segments within the pet type category, while pet food dominates the product type segment. This suggests opportunities for innovation and expansion in other areas, such as specialized pet care for less common pets and the development of new services catering to evolving pet owner needs. The regional breakdown, with data available for the United States, highlights potential variations in market size and growth based on regional demographics and economic factors. Further analysis of regional data would provide deeper insights into market behavior.
The forecast period of 2025-2033 provides a crucial window to observe market evolution. By understanding the interplay of market drivers, trends, and restraints, businesses can strategically position themselves for success. For example, companies can focus on developing premium, specialized products and services catering to the growing demand for high-quality pet care. Innovative technological solutions enhancing pet services accessibility and convenience can further capitalize on the industry's upward trajectory. Competitive analysis among leading companies like Nestle S.A., Mars Incorporated, and Rover Inc. highlights the importance of brand recognition, product diversification, and customer loyalty in capturing market share within this competitive landscape. Effective marketing strategies focusing on consumer needs and preferences, combined with a solid understanding of regional dynamics, will be critical for continued success in this dynamic market.
US Pet Care and Services Industry Market Report: 2019-2033
This comprehensive report provides an in-depth analysis of the US Pet Care and Services Industry, offering invaluable insights for industry stakeholders, investors, and businesses seeking to navigate this dynamic market. The study period covers 2019-2033, with 2025 as the base and estimated year. The forecast period spans 2025-2033, and the historical period encompasses 2019-2024. The market is segmented by pet type (cat, dog, horse, other animals), product type (pet food, grooming products, pet care), and service type (grooming, pet transportation, pet boarding, pet sitting, pet walking, other services). Key players analyzed include Nestle S.A., PetBacker, Mars Incorporated, We Lov Pets, ViaGen LC, Petmate, Tail Blazers, PetSmart LLC, Hill's Pet Nutrition Inc, and Rover Inc. The report projects a market size of xx Million by 2025, with a CAGR of xx% during the forecast period.
US Pet Care and Services Industry Market Concentration & Dynamics
The US pet care and services industry exhibits a moderately concentrated market structure, dominated by a few large multinational corporations like Nestle S.A. and Mars Incorporated, alongside a substantial number of smaller, specialized businesses. Market share data reveals that the top 5 players hold approximately xx% of the overall market, while the remaining xx% is fragmented among numerous smaller players. Innovation is driven by both large corporations investing in R&D and smaller companies introducing niche products and services. The regulatory landscape, while generally favorable to industry growth, faces evolving scrutiny regarding pet food labeling, animal welfare, and environmental sustainability. Substitute products, primarily homemade pet food and DIY grooming solutions, exert some pressure, but the convenience and specialized expertise offered by established players maintain strong demand. End-user trends show a growing preference for premium and specialized products, reflecting increased pet humanization and a willingness to invest in pet health and well-being. Mergers and acquisitions (M&A) activity has been significant, with xx M&A deals recorded between 2019 and 2024, indicating consolidation within the industry.
- Market Share: Top 5 players: xx%
- M&A Deal Count (2019-2024): xx
- Key Regulatory Focus: Pet food labeling, animal welfare, environmental sustainability
US Pet Care and Services Industry Industry Insights & Trends
The US pet care and services industry is experiencing robust growth, driven by several key factors. The increasing humanization of pets, coupled with rising disposable incomes, fuels demand for premium pet food, advanced grooming services, and specialized pet care products. Technological advancements, such as personalized pet nutrition plans, telehealth for veterinary care, and innovative pet tech devices, are transforming the industry landscape. Evolving consumer behaviors, including a shift towards online pet product purchasing and subscription services, are further shaping market dynamics. The market size reached approximately xx Million in 2024, and is projected to reach xx Million by 2025, demonstrating a strong growth trajectory. This growth is fueled by factors such as increased pet ownership, rising pet expenditure, and a growing understanding of the importance of pet health and well-being. The market is witnessing a surge in demand for premium and specialized products and services, catering to the evolving needs of pet owners.

Key Markets & Segments Leading US Pet Care and Services Industry
The US pet care and services market shows significant regional variations, with higher concentrations in affluent suburban and urban areas. By pet type, dogs and cats represent the largest segments, accounting for approximately xx% and xx% of the market respectively. However, the "other animals" segment shows high growth potential, driven by increasing ownership of exotic pets and a rise in specialized care services. Within product types, pet food maintains the largest market share, followed by grooming products and pet care accessories. The service sector shows robust growth, with pet sitting, dog walking, and grooming services demonstrating the highest demand.
Drivers for Dominant Segments:
- Dogs & Cats: High pet ownership rates, emotional connection, and willingness to spend on pet care.
- Pet Food: Essential requirement, increasing preference for premium and specialized diets.
- Grooming & Pet Sitting Services: Convenience, time constraints, and demand for specialized care.
US Pet Care and Services Industry Product Developments
Recent innovations include advanced pet foods with functional ingredients for specific health needs, technologically enhanced grooming tools, and pet-tech devices for monitoring health and activity. These developments enhance convenience, improve pet care, and offer personalized solutions, creating competitive advantages for companies adopting these technologies. The focus is shifting towards data-driven insights for personalized pet care, with advancements in nutrition and technology leading the way.
Challenges in the US Pet Care and Services Industry Market
The industry faces challenges including fluctuating raw material prices impacting pet food costs, increased competition among numerous players, and regulatory changes related to animal welfare and product labeling. Supply chain disruptions can also affect product availability and pricing, while maintaining a skilled workforce presents an ongoing challenge. These factors can influence profitability and market share.
Forces Driving US Pet Care and Services Industry Growth
Technological advancements, coupled with increasing pet humanization and higher disposable incomes, are key growth drivers. Rising pet ownership rates and increasing pet expenditure contribute significantly to the market expansion. Favorable regulatory frameworks promoting pet health and welfare also stimulate industry growth.
Long-Term Growth Catalysts in the US Pet Care and Services Industry
Long-term growth will be fueled by strategic partnerships between pet care companies and veterinary clinics, expanding service offerings through acquisitions, and continued innovation in pet food technology and personalized care solutions. The focus on preventative health and well-being for pets will drive sustained market growth.
Emerging Opportunities in US Pet Care and Services Industry
Emerging opportunities include the growth of the pet insurance market, expanding access to veterinary telehealth services, and the development of innovative pet products focusing on sustainability and eco-friendliness. The increasing adoption of subscription services and personalized pet care plans presents significant growth potential.
Leading Players in the US Pet Care and Services Industry Sector
- Nestle S.A.
- PetBacker
- Mars Incorporated
- We Lov Pets
- ViaGen LC
- Petmate
- Tail Blazers
- PetSmart LLC
- Hill's Pet Nutrition Inc
- Rover Inc
Key Milestones in US Pet Care and Services Industry Industry
- January 2023: Village Pet Care launched, signifying a potential shift toward consolidation in the pet care services sector.
- February 2023: Bark&Spark's new probiotic chew launch illustrates the ongoing innovation within pet food and supplements.
Strategic Outlook for US Pet Care and Services Industry Market
The US pet care and services industry exhibits strong growth potential, driven by consistent consumer spending on pet products and services. Strategic acquisitions, technological innovation, and the expansion of services will be critical for companies to capture significant market share and maximize profitability within this evolving market.
US Pet Care and Services Industry Segmentation
-
1. Pet Type
- 1.1. Cat
- 1.2. Dog
- 1.3. Horse
- 1.4. Other Animals
-
2. Product Type
- 2.1. Pet Food
- 2.2. Grooming Products
- 2.3. Pet Care
-
3. Service Type
- 3.1. Grooming
- 3.2. Pet Transportation
- 3.3. Pet Boarding
- 3.4. Pet Sitting
- 3.5. Pet Walking
- 3.6. Other Services
US Pet Care and Services Industry Segmentation By Geography
-
1. North America
- 1.1. United States
- 1.2. Canada
- 1.3. Mexico
-
2. South America
- 2.1. Brazil
- 2.2. Argentina
- 2.3. Rest of South America
-
3. Europe
- 3.1. United Kingdom
- 3.2. Germany
- 3.3. France
- 3.4. Italy
- 3.5. Spain
- 3.6. Russia
- 3.7. Benelux
- 3.8. Nordics
- 3.9. Rest of Europe
-
4. Middle East & Africa
- 4.1. Turkey
- 4.2. Israel
- 4.3. GCC
- 4.4. North Africa
- 4.5. South Africa
- 4.6. Rest of Middle East & Africa
-
5. Asia Pacific
- 5.1. China
- 5.2. India
- 5.3. Japan
- 5.4. South Korea
- 5.5. ASEAN
- 5.6. Oceania
- 5.7. Rest of Asia Pacific

US Pet Care and Services Industry REPORT HIGHLIGHTS
| Aspects | Details |
|---|---|
| Study Period | 2019-2033 |
| Base Year | 2024 |
| Estimated Year | 2025 |
| Forecast Period | 2025-2033 |
| Historical Period | 2019-2024 |
| Growth Rate | CAGR of 3.51% from 2019-2033 |
| Segmentation |
|
Table of Contents
- 1. Introduction
- 1.1. Research Scope
- 1.2. Market Segmentation
- 1.3. Research Methodology
- 1.4. Definitions and Assumptions
- 2. Executive Summary
- 2.1. Introduction
- 3. Market Dynamics
- 3.1. Introduction
- 3.2. Market Drivers
- 3.2.1. Rising Pet Ownership and Pet Insurance; Increased Adoption of Technology for Pet Care
- 3.3. Market Restrains
- 3.3.1. High Cost of Products and Services
- 3.4. Market Trends
- 3.4.1. Dog Segment is Expected to Account for the Large Market Share Over the Forecast Period
- 4. Market Factor Analysis
- 4.1. Porters Five Forces
- 4.2. Supply/Value Chain
- 4.3. PESTEL analysis
- 4.4. Market Entropy
- 4.5. Patent/Trademark Analysis
- 5. Global US Pet Care and Services Industry Analysis, Insights and Forecast, 2019-2031
- 5.1. Market Analysis, Insights and Forecast - by Pet Type
- 5.1.1. Cat
- 5.1.2. Dog
- 5.1.3. Horse
- 5.1.4. Other Animals
- 5.2. Market Analysis, Insights and Forecast - by Product Type
- 5.2.1. Pet Food
- 5.2.2. Grooming Products
- 5.2.3. Pet Care
- 5.3. Market Analysis, Insights and Forecast - by Service Type
- 5.3.1. Grooming
- 5.3.2. Pet Transportation
- 5.3.3. Pet Boarding
- 5.3.4. Pet Sitting
- 5.3.5. Pet Walking
- 5.3.6. Other Services
- 5.4. Market Analysis, Insights and Forecast - by Region
- 5.4.1. North America
- 5.4.2. South America
- 5.4.3. Europe
- 5.4.4. Middle East & Africa
- 5.4.5. Asia Pacific
- 5.1. Market Analysis, Insights and Forecast - by Pet Type
- 6. North America US Pet Care and Services Industry Analysis, Insights and Forecast, 2019-2031
- 6.1. Market Analysis, Insights and Forecast - by Pet Type
- 6.1.1. Cat
- 6.1.2. Dog
- 6.1.3. Horse
- 6.1.4. Other Animals
- 6.2. Market Analysis, Insights and Forecast - by Product Type
- 6.2.1. Pet Food
- 6.2.2. Grooming Products
- 6.2.3. Pet Care
- 6.3. Market Analysis, Insights and Forecast - by Service Type
- 6.3.1. Grooming
- 6.3.2. Pet Transportation
- 6.3.3. Pet Boarding
- 6.3.4. Pet Sitting
- 6.3.5. Pet Walking
- 6.3.6. Other Services
- 6.1. Market Analysis, Insights and Forecast - by Pet Type
- 7. South America US Pet Care and Services Industry Analysis, Insights and Forecast, 2019-2031
- 7.1. Market Analysis, Insights and Forecast - by Pet Type
- 7.1.1. Cat
- 7.1.2. Dog
- 7.1.3. Horse
- 7.1.4. Other Animals
- 7.2. Market Analysis, Insights and Forecast - by Product Type
- 7.2.1. Pet Food
- 7.2.2. Grooming Products
- 7.2.3. Pet Care
- 7.3. Market Analysis, Insights and Forecast - by Service Type
- 7.3.1. Grooming
- 7.3.2. Pet Transportation
- 7.3.3. Pet Boarding
- 7.3.4. Pet Sitting
- 7.3.5. Pet Walking
- 7.3.6. Other Services
- 7.1. Market Analysis, Insights and Forecast - by Pet Type
- 8. Europe US Pet Care and Services Industry Analysis, Insights and Forecast, 2019-2031
- 8.1. Market Analysis, Insights and Forecast - by Pet Type
- 8.1.1. Cat
- 8.1.2. Dog
- 8.1.3. Horse
- 8.1.4. Other Animals
- 8.2. Market Analysis, Insights and Forecast - by Product Type
- 8.2.1. Pet Food
- 8.2.2. Grooming Products
- 8.2.3. Pet Care
- 8.3. Market Analysis, Insights and Forecast - by Service Type
- 8.3.1. Grooming
- 8.3.2. Pet Transportation
- 8.3.3. Pet Boarding
- 8.3.4. Pet Sitting
- 8.3.5. Pet Walking
- 8.3.6. Other Services
- 8.1. Market Analysis, Insights and Forecast - by Pet Type
- 9. Middle East & Africa US Pet Care and Services Industry Analysis, Insights and Forecast, 2019-2031
- 9.1. Market Analysis, Insights and Forecast - by Pet Type
- 9.1.1. Cat
- 9.1.2. Dog
- 9.1.3. Horse
- 9.1.4. Other Animals
- 9.2. Market Analysis, Insights and Forecast - by Product Type
- 9.2.1. Pet Food
- 9.2.2. Grooming Products
- 9.2.3. Pet Care
- 9.3. Market Analysis, Insights and Forecast - by Service Type
- 9.3.1. Grooming
- 9.3.2. Pet Transportation
- 9.3.3. Pet Boarding
- 9.3.4. Pet Sitting
- 9.3.5. Pet Walking
- 9.3.6. Other Services
- 9.1. Market Analysis, Insights and Forecast - by Pet Type
- 10. Asia Pacific US Pet Care and Services Industry Analysis, Insights and Forecast, 2019-2031
- 10.1. Market Analysis, Insights and Forecast - by Pet Type
- 10.1.1. Cat
- 10.1.2. Dog
- 10.1.3. Horse
- 10.1.4. Other Animals
- 10.2. Market Analysis, Insights and Forecast - by Product Type
- 10.2.1. Pet Food
- 10.2.2. Grooming Products
- 10.2.3. Pet Care
- 10.3. Market Analysis, Insights and Forecast - by Service Type
- 10.3.1. Grooming
- 10.3.2. Pet Transportation
- 10.3.3. Pet Boarding
- 10.3.4. Pet Sitting
- 10.3.5. Pet Walking
- 10.3.6. Other Services
- 10.1. Market Analysis, Insights and Forecast - by Pet Type
- 11. Northeast US Pet Care and Services Industry Analysis, Insights and Forecast, 2019-2031
- 12. Southeast US Pet Care and Services Industry Analysis, Insights and Forecast, 2019-2031
- 13. Midwest US Pet Care and Services Industry Analysis, Insights and Forecast, 2019-2031
- 14. Southwest US Pet Care and Services Industry Analysis, Insights and Forecast, 2019-2031
- 15. West US Pet Care and Services Industry Analysis, Insights and Forecast, 2019-2031
- 16. Competitive Analysis
- 16.1. Global Market Share Analysis 2024
- 16.2. Company Profiles
- 16.2.1 Nestle S A
- 16.2.1.1. Overview
- 16.2.1.2. Products
- 16.2.1.3. SWOT Analysis
- 16.2.1.4. Recent Developments
- 16.2.1.5. Financials (Based on Availability)
- 16.2.2 PetBacker
- 16.2.2.1. Overview
- 16.2.2.2. Products
- 16.2.2.3. SWOT Analysis
- 16.2.2.4. Recent Developments
- 16.2.2.5. Financials (Based on Availability)
- 16.2.3 Mars Incorporated
- 16.2.3.1. Overview
- 16.2.3.2. Products
- 16.2.3.3. SWOT Analysis
- 16.2.3.4. Recent Developments
- 16.2.3.5. Financials (Based on Availability)
- 16.2.4 We Lov Pets
- 16.2.4.1. Overview
- 16.2.4.2. Products
- 16.2.4.3. SWOT Analysis
- 16.2.4.4. Recent Developments
- 16.2.4.5. Financials (Based on Availability)
- 16.2.5 ViaGen LC
- 16.2.5.1. Overview
- 16.2.5.2. Products
- 16.2.5.3. SWOT Analysis
- 16.2.5.4. Recent Developments
- 16.2.5.5. Financials (Based on Availability)
- 16.2.6 Petmate
- 16.2.6.1. Overview
- 16.2.6.2. Products
- 16.2.6.3. SWOT Analysis
- 16.2.6.4. Recent Developments
- 16.2.6.5. Financials (Based on Availability)
- 16.2.7 Tail Blazers
- 16.2.7.1. Overview
- 16.2.7.2. Products
- 16.2.7.3. SWOT Analysis
- 16.2.7.4. Recent Developments
- 16.2.7.5. Financials (Based on Availability)
- 16.2.8 PetSmart LLC
- 16.2.8.1. Overview
- 16.2.8.2. Products
- 16.2.8.3. SWOT Analysis
- 16.2.8.4. Recent Developments
- 16.2.8.5. Financials (Based on Availability)
- 16.2.9 Hill's Pet Nutrition Inc
- 16.2.9.1. Overview
- 16.2.9.2. Products
- 16.2.9.3. SWOT Analysis
- 16.2.9.4. Recent Developments
- 16.2.9.5. Financials (Based on Availability)
- 16.2.10 Rover Inc
- 16.2.10.1. Overview
- 16.2.10.2. Products
- 16.2.10.3. SWOT Analysis
- 16.2.10.4. Recent Developments
- 16.2.10.5. Financials (Based on Availability)
- 16.2.1 Nestle S A
List of Figures
- Figure 1: Global US Pet Care and Services Industry Revenue Breakdown (Million, %) by Region 2024 & 2032
- Figure 2: Global US Pet Care and Services Industry Volume Breakdown (K Unit, %) by Region 2024 & 2032
- Figure 3: United states US Pet Care and Services Industry Revenue (Million), by Country 2024 & 2032
- Figure 4: United states US Pet Care and Services Industry Volume (K Unit), by Country 2024 & 2032
- Figure 5: United states US Pet Care and Services Industry Revenue Share (%), by Country 2024 & 2032
- Figure 6: United states US Pet Care and Services Industry Volume Share (%), by Country 2024 & 2032
- Figure 7: North America US Pet Care and Services Industry Revenue (Million), by Pet Type 2024 & 2032
- Figure 8: North America US Pet Care and Services Industry Volume (K Unit), by Pet Type 2024 & 2032
- Figure 9: North America US Pet Care and Services Industry Revenue Share (%), by Pet Type 2024 & 2032
- Figure 10: North America US Pet Care and Services Industry Volume Share (%), by Pet Type 2024 & 2032
- Figure 11: North America US Pet Care and Services Industry Revenue (Million), by Product Type 2024 & 2032
- Figure 12: North America US Pet Care and Services Industry Volume (K Unit), by Product Type 2024 & 2032
- Figure 13: North America US Pet Care and Services Industry Revenue Share (%), by Product Type 2024 & 2032
- Figure 14: North America US Pet Care and Services Industry Volume Share (%), by Product Type 2024 & 2032
- Figure 15: North America US Pet Care and Services Industry Revenue (Million), by Service Type 2024 & 2032
- Figure 16: North America US Pet Care and Services Industry Volume (K Unit), by Service Type 2024 & 2032
- Figure 17: North America US Pet Care and Services Industry Revenue Share (%), by Service Type 2024 & 2032
- Figure 18: North America US Pet Care and Services Industry Volume Share (%), by Service Type 2024 & 2032
- Figure 19: North America US Pet Care and Services Industry Revenue (Million), by Country 2024 & 2032
- Figure 20: North America US Pet Care and Services Industry Volume (K Unit), by Country 2024 & 2032
- Figure 21: North America US Pet Care and Services Industry Revenue Share (%), by Country 2024 & 2032
- Figure 22: North America US Pet Care and Services Industry Volume Share (%), by Country 2024 & 2032
- Figure 23: South America US Pet Care and Services Industry Revenue (Million), by Pet Type 2024 & 2032
- Figure 24: South America US Pet Care and Services Industry Volume (K Unit), by Pet Type 2024 & 2032
- Figure 25: South America US Pet Care and Services Industry Revenue Share (%), by Pet Type 2024 & 2032
- Figure 26: South America US Pet Care and Services Industry Volume Share (%), by Pet Type 2024 & 2032
- Figure 27: South America US Pet Care and Services Industry Revenue (Million), by Product Type 2024 & 2032
- Figure 28: South America US Pet Care and Services Industry Volume (K Unit), by Product Type 2024 & 2032
- Figure 29: South America US Pet Care and Services Industry Revenue Share (%), by Product Type 2024 & 2032
- Figure 30: South America US Pet Care and Services Industry Volume Share (%), by Product Type 2024 & 2032
- Figure 31: South America US Pet Care and Services Industry Revenue (Million), by Service Type 2024 & 2032
- Figure 32: South America US Pet Care and Services Industry Volume (K Unit), by Service Type 2024 & 2032
- Figure 33: South America US Pet Care and Services Industry Revenue Share (%), by Service Type 2024 & 2032
- Figure 34: South America US Pet Care and Services Industry Volume Share (%), by Service Type 2024 & 2032
- Figure 35: South America US Pet Care and Services Industry Revenue (Million), by Country 2024 & 2032
- Figure 36: South America US Pet Care and Services Industry Volume (K Unit), by Country 2024 & 2032
- Figure 37: South America US Pet Care and Services Industry Revenue Share (%), by Country 2024 & 2032
- Figure 38: South America US Pet Care and Services Industry Volume Share (%), by Country 2024 & 2032
- Figure 39: Europe US Pet Care and Services Industry Revenue (Million), by Pet Type 2024 & 2032
- Figure 40: Europe US Pet Care and Services Industry Volume (K Unit), by Pet Type 2024 & 2032
- Figure 41: Europe US Pet Care and Services Industry Revenue Share (%), by Pet Type 2024 & 2032
- Figure 42: Europe US Pet Care and Services Industry Volume Share (%), by Pet Type 2024 & 2032
- Figure 43: Europe US Pet Care and Services Industry Revenue (Million), by Product Type 2024 & 2032
- Figure 44: Europe US Pet Care and Services Industry Volume (K Unit), by Product Type 2024 & 2032
- Figure 45: Europe US Pet Care and Services Industry Revenue Share (%), by Product Type 2024 & 2032
- Figure 46: Europe US Pet Care and Services Industry Volume Share (%), by Product Type 2024 & 2032
- Figure 47: Europe US Pet Care and Services Industry Revenue (Million), by Service Type 2024 & 2032
- Figure 48: Europe US Pet Care and Services Industry Volume (K Unit), by Service Type 2024 & 2032
- Figure 49: Europe US Pet Care and Services Industry Revenue Share (%), by Service Type 2024 & 2032
- Figure 50: Europe US Pet Care and Services Industry Volume Share (%), by Service Type 2024 & 2032
- Figure 51: Europe US Pet Care and Services Industry Revenue (Million), by Country 2024 & 2032
- Figure 52: Europe US Pet Care and Services Industry Volume (K Unit), by Country 2024 & 2032
- Figure 53: Europe US Pet Care and Services Industry Revenue Share (%), by Country 2024 & 2032
- Figure 54: Europe US Pet Care and Services Industry Volume Share (%), by Country 2024 & 2032
- Figure 55: Middle East & Africa US Pet Care and Services Industry Revenue (Million), by Pet Type 2024 & 2032
- Figure 56: Middle East & Africa US Pet Care and Services Industry Volume (K Unit), by Pet Type 2024 & 2032
- Figure 57: Middle East & Africa US Pet Care and Services Industry Revenue Share (%), by Pet Type 2024 & 2032
- Figure 58: Middle East & Africa US Pet Care and Services Industry Volume Share (%), by Pet Type 2024 & 2032
- Figure 59: Middle East & Africa US Pet Care and Services Industry Revenue (Million), by Product Type 2024 & 2032
- Figure 60: Middle East & Africa US Pet Care and Services Industry Volume (K Unit), by Product Type 2024 & 2032
- Figure 61: Middle East & Africa US Pet Care and Services Industry Revenue Share (%), by Product Type 2024 & 2032
- Figure 62: Middle East & Africa US Pet Care and Services Industry Volume Share (%), by Product Type 2024 & 2032
- Figure 63: Middle East & Africa US Pet Care and Services Industry Revenue (Million), by Service Type 2024 & 2032
- Figure 64: Middle East & Africa US Pet Care and Services Industry Volume (K Unit), by Service Type 2024 & 2032
- Figure 65: Middle East & Africa US Pet Care and Services Industry Revenue Share (%), by Service Type 2024 & 2032
- Figure 66: Middle East & Africa US Pet Care and Services Industry Volume Share (%), by Service Type 2024 & 2032
- Figure 67: Middle East & Africa US Pet Care and Services Industry Revenue (Million), by Country 2024 & 2032
- Figure 68: Middle East & Africa US Pet Care and Services Industry Volume (K Unit), by Country 2024 & 2032
- Figure 69: Middle East & Africa US Pet Care and Services Industry Revenue Share (%), by Country 2024 & 2032
- Figure 70: Middle East & Africa US Pet Care and Services Industry Volume Share (%), by Country 2024 & 2032
- Figure 71: Asia Pacific US Pet Care and Services Industry Revenue (Million), by Pet Type 2024 & 2032
- Figure 72: Asia Pacific US Pet Care and Services Industry Volume (K Unit), by Pet Type 2024 & 2032
- Figure 73: Asia Pacific US Pet Care and Services Industry Revenue Share (%), by Pet Type 2024 & 2032
- Figure 74: Asia Pacific US Pet Care and Services Industry Volume Share (%), by Pet Type 2024 & 2032
- Figure 75: Asia Pacific US Pet Care and Services Industry Revenue (Million), by Product Type 2024 & 2032
- Figure 76: Asia Pacific US Pet Care and Services Industry Volume (K Unit), by Product Type 2024 & 2032
- Figure 77: Asia Pacific US Pet Care and Services Industry Revenue Share (%), by Product Type 2024 & 2032
- Figure 78: Asia Pacific US Pet Care and Services Industry Volume Share (%), by Product Type 2024 & 2032
- Figure 79: Asia Pacific US Pet Care and Services Industry Revenue (Million), by Service Type 2024 & 2032
- Figure 80: Asia Pacific US Pet Care and Services Industry Volume (K Unit), by Service Type 2024 & 2032
- Figure 81: Asia Pacific US Pet Care and Services Industry Revenue Share (%), by Service Type 2024 & 2032
- Figure 82: Asia Pacific US Pet Care and Services Industry Volume Share (%), by Service Type 2024 & 2032
- Figure 83: Asia Pacific US Pet Care and Services Industry Revenue (Million), by Country 2024 & 2032
- Figure 84: Asia Pacific US Pet Care and Services Industry Volume (K Unit), by Country 2024 & 2032
- Figure 85: Asia Pacific US Pet Care and Services Industry Revenue Share (%), by Country 2024 & 2032
- Figure 86: Asia Pacific US Pet Care and Services Industry Volume Share (%), by Country 2024 & 2032
List of Tables
- Table 1: Global US Pet Care and Services Industry Revenue Million Forecast, by Region 2019 & 2032
- Table 2: Global US Pet Care and Services Industry Volume K Unit Forecast, by Region 2019 & 2032
- Table 3: Global US Pet Care and Services Industry Revenue Million Forecast, by Pet Type 2019 & 2032
- Table 4: Global US Pet Care and Services Industry Volume K Unit Forecast, by Pet Type 2019 & 2032
- Table 5: Global US Pet Care and Services Industry Revenue Million Forecast, by Product Type 2019 & 2032
- Table 6: Global US Pet Care and Services Industry Volume K Unit Forecast, by Product Type 2019 & 2032
- Table 7: Global US Pet Care and Services Industry Revenue Million Forecast, by Service Type 2019 & 2032
- Table 8: Global US Pet Care and Services Industry Volume K Unit Forecast, by Service Type 2019 & 2032
- Table 9: Global US Pet Care and Services Industry Revenue Million Forecast, by Region 2019 & 2032
- Table 10: Global US Pet Care and Services Industry Volume K Unit Forecast, by Region 2019 & 2032
- Table 11: Global US Pet Care and Services Industry Revenue Million Forecast, by Country 2019 & 2032
- Table 12: Global US Pet Care and Services Industry Volume K Unit Forecast, by Country 2019 & 2032
- Table 13: Northeast US Pet Care and Services Industry Revenue (Million) Forecast, by Application 2019 & 2032
- Table 14: Northeast US Pet Care and Services Industry Volume (K Unit) Forecast, by Application 2019 & 2032
- Table 15: Southeast US Pet Care and Services Industry Revenue (Million) Forecast, by Application 2019 & 2032
- Table 16: Southeast US Pet Care and Services Industry Volume (K Unit) Forecast, by Application 2019 & 2032
- Table 17: Midwest US Pet Care and Services Industry Revenue (Million) Forecast, by Application 2019 & 2032
- Table 18: Midwest US Pet Care and Services Industry Volume (K Unit) Forecast, by Application 2019 & 2032
- Table 19: Southwest US Pet Care and Services Industry Revenue (Million) Forecast, by Application 2019 & 2032
- Table 20: Southwest US Pet Care and Services Industry Volume (K Unit) Forecast, by Application 2019 & 2032
- Table 21: West US Pet Care and Services Industry Revenue (Million) Forecast, by Application 2019 & 2032
- Table 22: West US Pet Care and Services Industry Volume (K Unit) Forecast, by Application 2019 & 2032
- Table 23: Global US Pet Care and Services Industry Revenue Million Forecast, by Pet Type 2019 & 2032
- Table 24: Global US Pet Care and Services Industry Volume K Unit Forecast, by Pet Type 2019 & 2032
- Table 25: Global US Pet Care and Services Industry Revenue Million Forecast, by Product Type 2019 & 2032
- Table 26: Global US Pet Care and Services Industry Volume K Unit Forecast, by Product Type 2019 & 2032
- Table 27: Global US Pet Care and Services Industry Revenue Million Forecast, by Service Type 2019 & 2032
- Table 28: Global US Pet Care and Services Industry Volume K Unit Forecast, by Service Type 2019 & 2032
- Table 29: Global US Pet Care and Services Industry Revenue Million Forecast, by Country 2019 & 2032
- Table 30: Global US Pet Care and Services Industry Volume K Unit Forecast, by Country 2019 & 2032
- Table 31: United States US Pet Care and Services Industry Revenue (Million) Forecast, by Application 2019 & 2032
- Table 32: United States US Pet Care and Services Industry Volume (K Unit) Forecast, by Application 2019 & 2032
- Table 33: Canada US Pet Care and Services Industry Revenue (Million) Forecast, by Application 2019 & 2032
- Table 34: Canada US Pet Care and Services Industry Volume (K Unit) Forecast, by Application 2019 & 2032
- Table 35: Mexico US Pet Care and Services Industry Revenue (Million) Forecast, by Application 2019 & 2032
- Table 36: Mexico US Pet Care and Services Industry Volume (K Unit) Forecast, by Application 2019 & 2032
- Table 37: Global US Pet Care and Services Industry Revenue Million Forecast, by Pet Type 2019 & 2032
- Table 38: Global US Pet Care and Services Industry Volume K Unit Forecast, by Pet Type 2019 & 2032
- Table 39: Global US Pet Care and Services Industry Revenue Million Forecast, by Product Type 2019 & 2032
- Table 40: Global US Pet Care and Services Industry Volume K Unit Forecast, by Product Type 2019 & 2032
- Table 41: Global US Pet Care and Services Industry Revenue Million Forecast, by Service Type 2019 & 2032
- Table 42: Global US Pet Care and Services Industry Volume K Unit Forecast, by Service Type 2019 & 2032
- Table 43: Global US Pet Care and Services Industry Revenue Million Forecast, by Country 2019 & 2032
- Table 44: Global US Pet Care and Services Industry Volume K Unit Forecast, by Country 2019 & 2032
- Table 45: Brazil US Pet Care and Services Industry Revenue (Million) Forecast, by Application 2019 & 2032
- Table 46: Brazil US Pet Care and Services Industry Volume (K Unit) Forecast, by Application 2019 & 2032
- Table 47: Argentina US Pet Care and Services Industry Revenue (Million) Forecast, by Application 2019 & 2032
- Table 48: Argentina US Pet Care and Services Industry Volume (K Unit) Forecast, by Application 2019 & 2032
- Table 49: Rest of South America US Pet Care and Services Industry Revenue (Million) Forecast, by Application 2019 & 2032
- Table 50: Rest of South America US Pet Care and Services Industry Volume (K Unit) Forecast, by Application 2019 & 2032
- Table 51: Global US Pet Care and Services Industry Revenue Million Forecast, by Pet Type 2019 & 2032
- Table 52: Global US Pet Care and Services Industry Volume K Unit Forecast, by Pet Type 2019 & 2032
- Table 53: Global US Pet Care and Services Industry Revenue Million Forecast, by Product Type 2019 & 2032
- Table 54: Global US Pet Care and Services Industry Volume K Unit Forecast, by Product Type 2019 & 2032
- Table 55: Global US Pet Care and Services Industry Revenue Million Forecast, by Service Type 2019 & 2032
- Table 56: Global US Pet Care and Services Industry Volume K Unit Forecast, by Service Type 2019 & 2032
- Table 57: Global US Pet Care and Services Industry Revenue Million Forecast, by Country 2019 & 2032
- Table 58: Global US Pet Care and Services Industry Volume K Unit Forecast, by Country 2019 & 2032
- Table 59: United Kingdom US Pet Care and Services Industry Revenue (Million) Forecast, by Application 2019 & 2032
- Table 60: United Kingdom US Pet Care and Services Industry Volume (K Unit) Forecast, by Application 2019 & 2032
- Table 61: Germany US Pet Care and Services Industry Revenue (Million) Forecast, by Application 2019 & 2032
- Table 62: Germany US Pet Care and Services Industry Volume (K Unit) Forecast, by Application 2019 & 2032
- Table 63: France US Pet Care and Services Industry Revenue (Million) Forecast, by Application 2019 & 2032
- Table 64: France US Pet Care and Services Industry Volume (K Unit) Forecast, by Application 2019 & 2032
- Table 65: Italy US Pet Care and Services Industry Revenue (Million) Forecast, by Application 2019 & 2032
- Table 66: Italy US Pet Care and Services Industry Volume (K Unit) Forecast, by Application 2019 & 2032
- Table 67: Spain US Pet Care and Services Industry Revenue (Million) Forecast, by Application 2019 & 2032
- Table 68: Spain US Pet Care and Services Industry Volume (K Unit) Forecast, by Application 2019 & 2032
- Table 69: Russia US Pet Care and Services Industry Revenue (Million) Forecast, by Application 2019 & 2032
- Table 70: Russia US Pet Care and Services Industry Volume (K Unit) Forecast, by Application 2019 & 2032
- Table 71: Benelux US Pet Care and Services Industry Revenue (Million) Forecast, by Application 2019 & 2032
- Table 72: Benelux US Pet Care and Services Industry Volume (K Unit) Forecast, by Application 2019 & 2032
- Table 73: Nordics US Pet Care and Services Industry Revenue (Million) Forecast, by Application 2019 & 2032
- Table 74: Nordics US Pet Care and Services Industry Volume (K Unit) Forecast, by Application 2019 & 2032
- Table 75: Rest of Europe US Pet Care and Services Industry Revenue (Million) Forecast, by Application 2019 & 2032
- Table 76: Rest of Europe US Pet Care and Services Industry Volume (K Unit) Forecast, by Application 2019 & 2032
- Table 77: Global US Pet Care and Services Industry Revenue Million Forecast, by Pet Type 2019 & 2032
- Table 78: Global US Pet Care and Services Industry Volume K Unit Forecast, by Pet Type 2019 & 2032
- Table 79: Global US Pet Care and Services Industry Revenue Million Forecast, by Product Type 2019 & 2032
- Table 80: Global US Pet Care and Services Industry Volume K Unit Forecast, by Product Type 2019 & 2032
- Table 81: Global US Pet Care and Services Industry Revenue Million Forecast, by Service Type 2019 & 2032
- Table 82: Global US Pet Care and Services Industry Volume K Unit Forecast, by Service Type 2019 & 2032
- Table 83: Global US Pet Care and Services Industry Revenue Million Forecast, by Country 2019 & 2032
- Table 84: Global US Pet Care and Services Industry Volume K Unit Forecast, by Country 2019 & 2032
- Table 85: Turkey US Pet Care and Services Industry Revenue (Million) Forecast, by Application 2019 & 2032
- Table 86: Turkey US Pet Care and Services Industry Volume (K Unit) Forecast, by Application 2019 & 2032
- Table 87: Israel US Pet Care and Services Industry Revenue (Million) Forecast, by Application 2019 & 2032
- Table 88: Israel US Pet Care and Services Industry Volume (K Unit) Forecast, by Application 2019 & 2032
- Table 89: GCC US Pet Care and Services Industry Revenue (Million) Forecast, by Application 2019 & 2032
- Table 90: GCC US Pet Care and Services Industry Volume (K Unit) Forecast, by Application 2019 & 2032
- Table 91: North Africa US Pet Care and Services Industry Revenue (Million) Forecast, by Application 2019 & 2032
- Table 92: North Africa US Pet Care and Services Industry Volume (K Unit) Forecast, by Application 2019 & 2032
- Table 93: South Africa US Pet Care and Services Industry Revenue (Million) Forecast, by Application 2019 & 2032
- Table 94: South Africa US Pet Care and Services Industry Volume (K Unit) Forecast, by Application 2019 & 2032
- Table 95: Rest of Middle East & Africa US Pet Care and Services Industry Revenue (Million) Forecast, by Application 2019 & 2032
- Table 96: Rest of Middle East & Africa US Pet Care and Services Industry Volume (K Unit) Forecast, by Application 2019 & 2032
- Table 97: Global US Pet Care and Services Industry Revenue Million Forecast, by Pet Type 2019 & 2032
- Table 98: Global US Pet Care and Services Industry Volume K Unit Forecast, by Pet Type 2019 & 2032
- Table 99: Global US Pet Care and Services Industry Revenue Million Forecast, by Product Type 2019 & 2032
- Table 100: Global US Pet Care and Services Industry Volume K Unit Forecast, by Product Type 2019 & 2032
- Table 101: Global US Pet Care and Services Industry Revenue Million Forecast, by Service Type 2019 & 2032
- Table 102: Global US Pet Care and Services Industry Volume K Unit Forecast, by Service Type 2019 & 2032
- Table 103: Global US Pet Care and Services Industry Revenue Million Forecast, by Country 2019 & 2032
- Table 104: Global US Pet Care and Services Industry Volume K Unit Forecast, by Country 2019 & 2032
- Table 105: China US Pet Care and Services Industry Revenue (Million) Forecast, by Application 2019 & 2032
- Table 106: China US Pet Care and Services Industry Volume (K Unit) Forecast, by Application 2019 & 2032
- Table 107: India US Pet Care and Services Industry Revenue (Million) Forecast, by Application 2019 & 2032
- Table 108: India US Pet Care and Services Industry Volume (K Unit) Forecast, by Application 2019 & 2032
- Table 109: Japan US Pet Care and Services Industry Revenue (Million) Forecast, by Application 2019 & 2032
- Table 110: Japan US Pet Care and Services Industry Volume (K Unit) Forecast, by Application 2019 & 2032
- Table 111: South Korea US Pet Care and Services Industry Revenue (Million) Forecast, by Application 2019 & 2032
- Table 112: South Korea US Pet Care and Services Industry Volume (K Unit) Forecast, by Application 2019 & 2032
- Table 113: ASEAN US Pet Care and Services Industry Revenue (Million) Forecast, by Application 2019 & 2032
- Table 114: ASEAN US Pet Care and Services Industry Volume (K Unit) Forecast, by Application 2019 & 2032
- Table 115: Oceania US Pet Care and Services Industry Revenue (Million) Forecast, by Application 2019 & 2032
- Table 116: Oceania US Pet Care and Services Industry Volume (K Unit) Forecast, by Application 2019 & 2032
- Table 117: Rest of Asia Pacific US Pet Care and Services Industry Revenue (Million) Forecast, by Application 2019 & 2032
- Table 118: Rest of Asia Pacific US Pet Care and Services Industry Volume (K Unit) Forecast, by Application 2019 & 2032
Frequently Asked Questions
1. What is the projected Compound Annual Growth Rate (CAGR) of the US Pet Care and Services Industry?
The projected CAGR is approximately 3.51%.
2. Which companies are prominent players in the US Pet Care and Services Industry?
Key companies in the market include Nestle S A, PetBacker, Mars Incorporated, We Lov Pets, ViaGen LC, Petmate, Tail Blazers, PetSmart LLC, Hill's Pet Nutrition Inc, Rover Inc.
3. What are the main segments of the US Pet Care and Services Industry?
The market segments include Pet Type , Product Type, Service Type.
4. Can you provide details about the market size?
The market size is estimated to be USD 12.21 Million as of 2022.
5. What are some drivers contributing to market growth?
Rising Pet Ownership and Pet Insurance; Increased Adoption of Technology for Pet Care.
6. What are the notable trends driving market growth?
Dog Segment is Expected to Account for the Large Market Share Over the Forecast Period.
7. Are there any restraints impacting market growth?
High Cost of Products and Services.
8. Can you provide examples of recent developments in the market?
February 2023: Bark&Spark released a new Probiotic Chew for Dogs. Bark&Spark's chews are touted as perfectly dosed and compatible with any dog's diet, with just a few chews a day giving the desired effects.
9. What pricing options are available for accessing the report?
Pricing options include single-user, multi-user, and enterprise licenses priced at USD 3800, USD 4500, and USD 5800 respectively.
10. Is the market size provided in terms of value or volume?
The market size is provided in terms of value, measured in Million and volume, measured in K Unit.
11. Are there any specific market keywords associated with the report?
Yes, the market keyword associated with the report is "US Pet Care and Services Industry," which aids in identifying and referencing the specific market segment covered.
12. How do I determine which pricing option suits my needs best?
The pricing options vary based on user requirements and access needs. Individual users may opt for single-user licenses, while businesses requiring broader access may choose multi-user or enterprise licenses for cost-effective access to the report.
13. Are there any additional resources or data provided in the US Pet Care and Services Industry report?
While the report offers comprehensive insights, it's advisable to review the specific contents or supplementary materials provided to ascertain if additional resources or data are available.
14. How can I stay updated on further developments or reports in the US Pet Care and Services Industry?
To stay informed about further developments, trends, and reports in the US Pet Care and Services Industry, consider subscribing to industry newsletters, following relevant companies and organizations, or regularly checking reputable industry news sources and publications.
Methodology
Step 1 - Identification of Relevant Samples Size from Population Database


Step 2 - Approaches for Defining Global Market Size (Value, Volume* & Price*)

Note*: In applicable scenarios
Step 3 - Data Sources
Primary Research
- Web Analytics
- Survey Reports
- Research Institute
- Latest Research Reports
- Opinion Leaders
Secondary Research
- Annual Reports
- White Paper
- Latest Press Release
- Industry Association
- Paid Database
- Investor Presentations

Step 4 - Data Triangulation
Involves using different sources of information in order to increase the validity of a study
These sources are likely to be stakeholders in a program - participants, other researchers, program staff, other community members, and so on.
Then we put all data in single framework & apply various statistical tools to find out the dynamic on the market.
During the analysis stage, feedback from the stakeholder groups would be compared to determine areas of agreement as well as areas of divergence
