

Key Insights
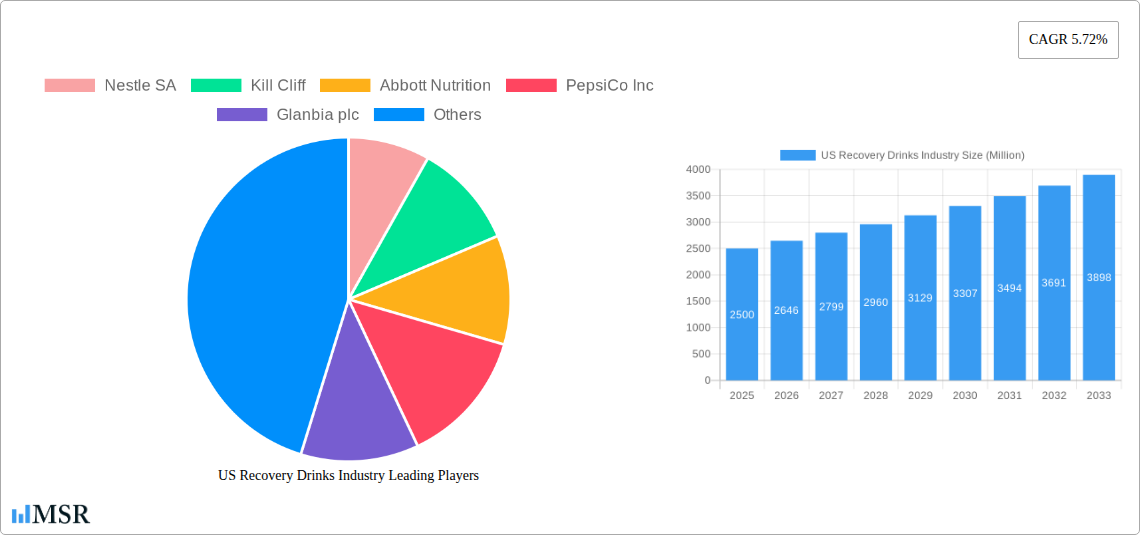
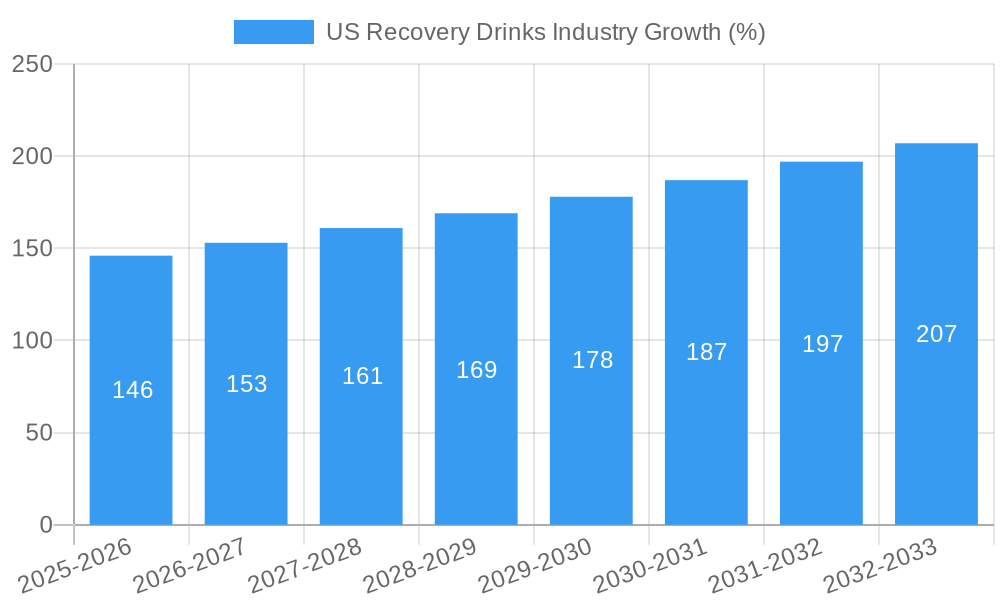
The US recovery drinks market, valued at approximately $2.5 billion in 2025, is projected to experience robust growth, exhibiting a Compound Annual Growth Rate (CAGR) of 5.72% from 2025 to 2033. This expansion is driven by several key factors. The rising popularity of fitness and athletic activities, coupled with increasing consumer awareness of the importance of post-workout recovery, fuels demand for functional beverages that replenish electrolytes, carbohydrates, and proteins. Furthermore, the market benefits from product innovation, with manufacturers introducing a wider array of flavors, formats (RTD, powders), and functional ingredients tailored to specific needs, such as enhanced hydration or muscle recovery. The growth is also being supported by the increasing adoption of online retail channels, offering convenient access to a diverse range of products. However, challenges exist, including potential concerns about added sugar content in some products and the fluctuating prices of key raw materials.
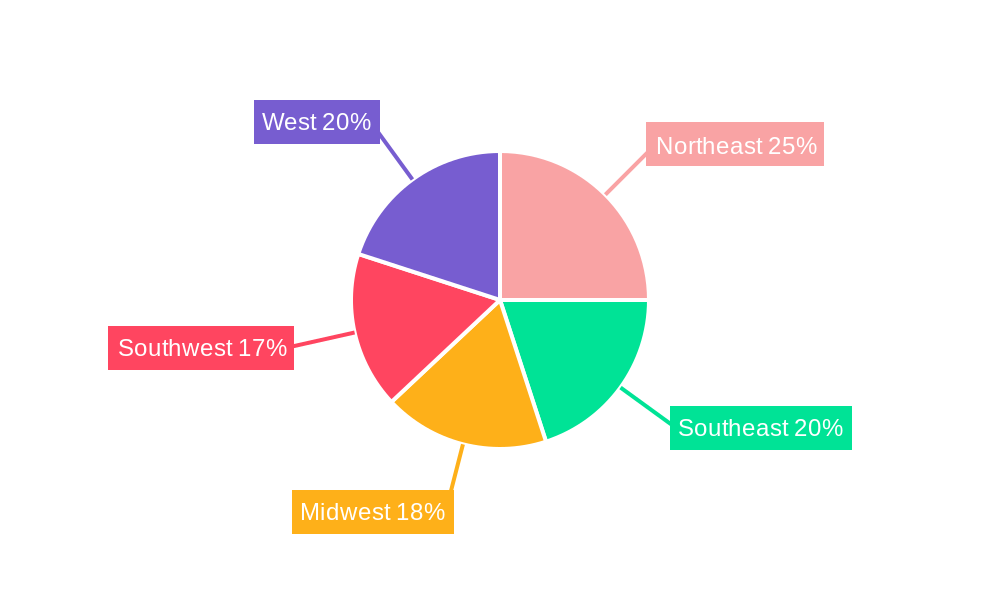
Market segmentation reveals the dominance of ready-to-drink (RTD) recovery drinks, favored for their convenience. Supermarkets and hypermarkets represent the primary distribution channel, reflecting consumer purchasing habits. Key players like Nestle SA, PepsiCo Inc., and Glanbia plc are strategically investing in product development and marketing initiatives to capitalize on this expanding market. Regional variations exist, with the Northeast and West regions anticipated to show strong growth, driven by higher health consciousness and disposable incomes. The forecast period (2025-2033) promises sustained market expansion, influenced by the convergence of health trends, consumer preferences, and ongoing product innovation. However, effective marketing and product formulation strategies will be crucial for brands to maintain competitive advantage in a progressively crowded market.
US Recovery Drinks Industry: A Comprehensive Market Report (2019-2033)
This comprehensive report provides a detailed analysis of the US recovery drinks industry, offering invaluable insights for stakeholders seeking to navigate this dynamic market. The report covers the period from 2019 to 2033, with a focus on the estimated year 2025 and a forecast period extending to 2033. The study encompasses key segments, leading players, and emerging trends, offering actionable strategies for success. The market size is projected to reach xx Million by 2033, exhibiting a CAGR of xx% during the forecast period.
US Recovery Drinks Industry Market Concentration & Dynamics
The US recovery drinks market is moderately concentrated, with key players like Nestle SA, PepsiCo Inc., and Glanbia plc holding significant market share. However, the presence of numerous smaller players, particularly in the specialty and online retail segments, contributes to a competitive landscape. Market share data for 2025 suggests Nestle SA holds approximately xx%, PepsiCo Inc. at xx%, and Glanbia plc at xx%, with the remaining share distributed among other players including Abbott Nutrition, Danone SA, Kill Cliff, Energy Lab Nutrition, and Fluid Sports Nutrition. The industry is witnessing increasing innovation, particularly in product formulations and delivery systems. Regulatory frameworks surrounding health claims and labeling are evolving, requiring manufacturers to adapt their strategies. Substitute products, such as electrolyte-enhanced waters and sports drinks, exert competitive pressure. Consumer trends are shifting toward natural, functional, and convenient recovery drinks. Mergers and acquisitions (M&A) activity in the sector has been moderate in recent years, with an estimated xx M&A deals completed between 2019 and 2024.
US Recovery Drinks Industry Industry Insights & Trends
The US recovery drinks market is driven by several factors, including rising health consciousness, increased participation in fitness activities, and the growing popularity of functional beverages. Technological advancements in formulation and packaging enhance product shelf life and appeal. Consumer preferences are shifting toward clean-label products, with a focus on natural ingredients and reduced sugar content. The market size reached xx Million in 2024, showing significant growth from xx Million in 2019. This growth trajectory is expected to continue, driven by the factors mentioned above, with the projected market size reaching xx Million by 2025 and xx Million by 2033. The compounded annual growth rate (CAGR) during the forecast period (2025-2033) is estimated at xx%.
Key Markets & Segments Leading US Recovery Drinks Industry
The dominant segment in the US recovery drinks market is the RTD (Ready-to-Drink) category, owing to its convenience and immediate consumption. Supermarkets/Hypermarkets remain the primary distribution channel, capturing a significant market share due to their widespread availability and established distribution networks.
- Drivers for RTD Segment: Convenience, immediate consumption, wider product variety.
- Drivers for Supermarkets/Hypermarkets Channel: High accessibility, established distribution, large consumer base.
- Geographic Dominance: The West Coast and South regions show higher consumption due to warmer climates and a stronger fitness culture. However, growth in other regions is expected to be significant.
The powder segment offers potential growth due to its longer shelf life and cost-effectiveness, but requires increased consumer education to increase acceptance. Specialty stores/health stores also represent a significant distribution channel due to their focus on health and wellness products.
US Recovery Drinks Industry Product Developments
Recent product innovations have focused on enhancing the functional benefits of recovery drinks, including incorporating ingredients like collagen peptides, branched-chain amino acids (BCAAs), and adaptogens to target muscle recovery, hydration, and overall wellness. Advances in packaging technology, such as shelf-stable formulations and eco-friendly containers, are improving product appeal and sustainability. These product developments are enhancing the competitive landscape, offering consumers a wider range of options and fueling industry growth.
Challenges in the US Recovery Drinks Industry Market
The US recovery drinks market faces several challenges, including stringent regulatory requirements around health claims and ingredient labeling, which increase compliance costs. Supply chain disruptions and rising raw material prices can significantly impact production costs and profitability. Intense competition from established players and emerging brands adds pressure on pricing and product differentiation. These challenges could potentially reduce the market growth rate by xx% if not addressed effectively.
Forces Driving US Recovery Drinks Industry Growth
Key growth drivers include rising consumer awareness of health and wellness, increased participation in sports and fitness activities, and the rising popularity of functional foods and beverages. Technological advancements in product formulation and delivery systems are enhancing the functionality and appeal of recovery drinks. Favorable regulatory frameworks promoting innovation and consumer safety are also driving industry growth.
Long-Term Growth Catalysts in the US Recovery Drinks Industry
Long-term growth will be fueled by ongoing product innovation, strategic partnerships between manufacturers and retailers, and expansion into new markets and distribution channels. Further research into the health benefits of specific ingredients, and consumer education efforts, will drive the expansion of this market.
Emerging Opportunities in US Recovery Drinks Industry
Emerging opportunities include the development of personalized recovery drinks tailored to individual needs, the exploration of novel ingredients with functional benefits, and the expansion into niche markets such as elderly care and specialized sports nutrition. Growing demand for plant-based and sustainable options offers a further scope for new product development.
Leading Players in the US Recovery Drinks Industry Sector
- Nestle SA
- Kill Cliff
- Abbott Nutrition
- PepsiCo Inc
- Glanbia plc
- Energy Lab Nutrition
- Fluid Sports Nutrition
- Danone SA
Key Milestones in US Recovery Drinks Industry Industry
- 2020: Launch of several plant-based recovery drinks by key players.
- 2021: Increased regulatory scrutiny on health claims leading to reformulation of some products.
- 2022: Major M&A activity with a large player acquiring a smaller, innovative brand.
- 2023: Introduction of new delivery systems, such as single-serve pouches and powdered sticks.
Strategic Outlook for US Recovery Drinks Industry Market
The US recovery drinks market holds significant long-term potential, driven by evolving consumer preferences and ongoing technological advancements. Strategic opportunities lie in developing innovative products targeting specific consumer segments, expanding distribution networks, and building strong brand loyalty. Companies adopting a proactive approach to regulation and sustainable practices will be well-positioned to capture market share and drive future growth.
US Recovery Drinks Industry Segmentation
-
1. Product Type
- 1.1. RTD
- 1.2. Powder
-
2. Distribution Channel
- 2.1. Supermarkets/ Hypermarkets
- 2.2. Specialty Stores/Health Stores
- 2.3. Convenience Stores
- 2.4. Online Retail Stores
- 2.5. Others
US Recovery Drinks Industry Segmentation By Geography
-
1. North America
- 1.1. United States
- 1.2. Canada
- 1.3. Mexico
-
2. South America
- 2.1. Brazil
- 2.2. Argentina
- 2.3. Rest of South America
-
3. Europe
- 3.1. United Kingdom
- 3.2. Germany
- 3.3. France
- 3.4. Italy
- 3.5. Spain
- 3.6. Russia
- 3.7. Benelux
- 3.8. Nordics
- 3.9. Rest of Europe
-
4. Middle East & Africa
- 4.1. Turkey
- 4.2. Israel
- 4.3. GCC
- 4.4. North Africa
- 4.5. South Africa
- 4.6. Rest of Middle East & Africa
-
5. Asia Pacific
- 5.1. China
- 5.2. India
- 5.3. Japan
- 5.4. South Korea
- 5.5. ASEAN
- 5.6. Oceania
- 5.7. Rest of Asia Pacific
US Recovery Drinks Industry REPORT HIGHLIGHTS
| Aspects | Details |
|---|---|
| Study Period | 2019-2033 |
| Base Year | 2024 |
| Estimated Year | 2025 |
| Forecast Period | 2025-2033 |
| Historical Period | 2019-2024 |
| Growth Rate | CAGR of 5.72% from 2019-2033 |
| Segmentation |
|
Table of Contents
- 1. Introduction
- 1.1. Research Scope
- 1.2. Market Segmentation
- 1.3. Research Methodology
- 1.4. Definitions and Assumptions
- 2. Executive Summary
- 2.1. Introduction
- 3. Market Dynamics
- 3.1. Introduction
- 3.2. Market Drivers
- 3.2.1. Demand for specialty and organic coffee pods and capsules; Innovations in packaging formats
- 3.3. Market Restrains
- 3.3.1. Availability of counterfeit products
- 3.4. Market Trends
- 3.4.1 Growing Physical Activity Participation Rate
- 3.4.2 Coupled With Marketing Campaigns
- 4. Market Factor Analysis
- 4.1. Porters Five Forces
- 4.2. Supply/Value Chain
- 4.3. PESTEL analysis
- 4.4. Market Entropy
- 4.5. Patent/Trademark Analysis
- 5. Global US Recovery Drinks Industry Analysis, Insights and Forecast, 2019-2031
- 5.1. Market Analysis, Insights and Forecast - by Product Type
- 5.1.1. RTD
- 5.1.2. Powder
- 5.2. Market Analysis, Insights and Forecast - by Distribution Channel
- 5.2.1. Supermarkets/ Hypermarkets
- 5.2.2. Specialty Stores/Health Stores
- 5.2.3. Convenience Stores
- 5.2.4. Online Retail Stores
- 5.2.5. Others
- 5.3. Market Analysis, Insights and Forecast - by Region
- 5.3.1. North America
- 5.3.2. South America
- 5.3.3. Europe
- 5.3.4. Middle East & Africa
- 5.3.5. Asia Pacific
- 5.1. Market Analysis, Insights and Forecast - by Product Type
- 6. North America US Recovery Drinks Industry Analysis, Insights and Forecast, 2019-2031
- 6.1. Market Analysis, Insights and Forecast - by Product Type
- 6.1.1. RTD
- 6.1.2. Powder
- 6.2. Market Analysis, Insights and Forecast - by Distribution Channel
- 6.2.1. Supermarkets/ Hypermarkets
- 6.2.2. Specialty Stores/Health Stores
- 6.2.3. Convenience Stores
- 6.2.4. Online Retail Stores
- 6.2.5. Others
- 6.1. Market Analysis, Insights and Forecast - by Product Type
- 7. South America US Recovery Drinks Industry Analysis, Insights and Forecast, 2019-2031
- 7.1. Market Analysis, Insights and Forecast - by Product Type
- 7.1.1. RTD
- 7.1.2. Powder
- 7.2. Market Analysis, Insights and Forecast - by Distribution Channel
- 7.2.1. Supermarkets/ Hypermarkets
- 7.2.2. Specialty Stores/Health Stores
- 7.2.3. Convenience Stores
- 7.2.4. Online Retail Stores
- 7.2.5. Others
- 7.1. Market Analysis, Insights and Forecast - by Product Type
- 8. Europe US Recovery Drinks Industry Analysis, Insights and Forecast, 2019-2031
- 8.1. Market Analysis, Insights and Forecast - by Product Type
- 8.1.1. RTD
- 8.1.2. Powder
- 8.2. Market Analysis, Insights and Forecast - by Distribution Channel
- 8.2.1. Supermarkets/ Hypermarkets
- 8.2.2. Specialty Stores/Health Stores
- 8.2.3. Convenience Stores
- 8.2.4. Online Retail Stores
- 8.2.5. Others
- 8.1. Market Analysis, Insights and Forecast - by Product Type
- 9. Middle East & Africa US Recovery Drinks Industry Analysis, Insights and Forecast, 2019-2031
- 9.1. Market Analysis, Insights and Forecast - by Product Type
- 9.1.1. RTD
- 9.1.2. Powder
- 9.2. Market Analysis, Insights and Forecast - by Distribution Channel
- 9.2.1. Supermarkets/ Hypermarkets
- 9.2.2. Specialty Stores/Health Stores
- 9.2.3. Convenience Stores
- 9.2.4. Online Retail Stores
- 9.2.5. Others
- 9.1. Market Analysis, Insights and Forecast - by Product Type
- 10. Asia Pacific US Recovery Drinks Industry Analysis, Insights and Forecast, 2019-2031
- 10.1. Market Analysis, Insights and Forecast - by Product Type
- 10.1.1. RTD
- 10.1.2. Powder
- 10.2. Market Analysis, Insights and Forecast - by Distribution Channel
- 10.2.1. Supermarkets/ Hypermarkets
- 10.2.2. Specialty Stores/Health Stores
- 10.2.3. Convenience Stores
- 10.2.4. Online Retail Stores
- 10.2.5. Others
- 10.1. Market Analysis, Insights and Forecast - by Product Type
- 11. Northeast US Recovery Drinks Industry Analysis, Insights and Forecast, 2019-2031
- 12. Southeast US Recovery Drinks Industry Analysis, Insights and Forecast, 2019-2031
- 13. Midwest US Recovery Drinks Industry Analysis, Insights and Forecast, 2019-2031
- 14. Southwest US Recovery Drinks Industry Analysis, Insights and Forecast, 2019-2031
- 15. West US Recovery Drinks Industry Analysis, Insights and Forecast, 2019-2031
- 16. Competitive Analysis
- 16.1. Global Market Share Analysis 2024
- 16.2. Company Profiles
- 16.2.1 Nestle SA
- 16.2.1.1. Overview
- 16.2.1.2. Products
- 16.2.1.3. SWOT Analysis
- 16.2.1.4. Recent Developments
- 16.2.1.5. Financials (Based on Availability)
- 16.2.2 Kill Cliff
- 16.2.2.1. Overview
- 16.2.2.2. Products
- 16.2.2.3. SWOT Analysis
- 16.2.2.4. Recent Developments
- 16.2.2.5. Financials (Based on Availability)
- 16.2.3 Abbott Nutrition
- 16.2.3.1. Overview
- 16.2.3.2. Products
- 16.2.3.3. SWOT Analysis
- 16.2.3.4. Recent Developments
- 16.2.3.5. Financials (Based on Availability)
- 16.2.4 PepsiCo Inc
- 16.2.4.1. Overview
- 16.2.4.2. Products
- 16.2.4.3. SWOT Analysis
- 16.2.4.4. Recent Developments
- 16.2.4.5. Financials (Based on Availability)
- 16.2.5 Glanbia plc
- 16.2.5.1. Overview
- 16.2.5.2. Products
- 16.2.5.3. SWOT Analysis
- 16.2.5.4. Recent Developments
- 16.2.5.5. Financials (Based on Availability)
- 16.2.6 Energy Lab Nutrition
- 16.2.6.1. Overview
- 16.2.6.2. Products
- 16.2.6.3. SWOT Analysis
- 16.2.6.4. Recent Developments
- 16.2.6.5. Financials (Based on Availability)
- 16.2.7 Fluid Sports Nutrition*List Not Exhaustive
- 16.2.7.1. Overview
- 16.2.7.2. Products
- 16.2.7.3. SWOT Analysis
- 16.2.7.4. Recent Developments
- 16.2.7.5. Financials (Based on Availability)
- 16.2.8 Danone SA
- 16.2.8.1. Overview
- 16.2.8.2. Products
- 16.2.8.3. SWOT Analysis
- 16.2.8.4. Recent Developments
- 16.2.8.5. Financials (Based on Availability)
- 16.2.1 Nestle SA
List of Figures
- Figure 1: Global US Recovery Drinks Industry Revenue Breakdown (Million, %) by Region 2024 & 2032
- Figure 2: United states US Recovery Drinks Industry Revenue (Million), by Country 2024 & 2032
- Figure 3: United states US Recovery Drinks Industry Revenue Share (%), by Country 2024 & 2032
- Figure 4: North America US Recovery Drinks Industry Revenue (Million), by Product Type 2024 & 2032
- Figure 5: North America US Recovery Drinks Industry Revenue Share (%), by Product Type 2024 & 2032
- Figure 6: North America US Recovery Drinks Industry Revenue (Million), by Distribution Channel 2024 & 2032
- Figure 7: North America US Recovery Drinks Industry Revenue Share (%), by Distribution Channel 2024 & 2032
- Figure 8: North America US Recovery Drinks Industry Revenue (Million), by Country 2024 & 2032
- Figure 9: North America US Recovery Drinks Industry Revenue Share (%), by Country 2024 & 2032
- Figure 10: South America US Recovery Drinks Industry Revenue (Million), by Product Type 2024 & 2032
- Figure 11: South America US Recovery Drinks Industry Revenue Share (%), by Product Type 2024 & 2032
- Figure 12: South America US Recovery Drinks Industry Revenue (Million), by Distribution Channel 2024 & 2032
- Figure 13: South America US Recovery Drinks Industry Revenue Share (%), by Distribution Channel 2024 & 2032
- Figure 14: South America US Recovery Drinks Industry Revenue (Million), by Country 2024 & 2032
- Figure 15: South America US Recovery Drinks Industry Revenue Share (%), by Country 2024 & 2032
- Figure 16: Europe US Recovery Drinks Industry Revenue (Million), by Product Type 2024 & 2032
- Figure 17: Europe US Recovery Drinks Industry Revenue Share (%), by Product Type 2024 & 2032
- Figure 18: Europe US Recovery Drinks Industry Revenue (Million), by Distribution Channel 2024 & 2032
- Figure 19: Europe US Recovery Drinks Industry Revenue Share (%), by Distribution Channel 2024 & 2032
- Figure 20: Europe US Recovery Drinks Industry Revenue (Million), by Country 2024 & 2032
- Figure 21: Europe US Recovery Drinks Industry Revenue Share (%), by Country 2024 & 2032
- Figure 22: Middle East & Africa US Recovery Drinks Industry Revenue (Million), by Product Type 2024 & 2032
- Figure 23: Middle East & Africa US Recovery Drinks Industry Revenue Share (%), by Product Type 2024 & 2032
- Figure 24: Middle East & Africa US Recovery Drinks Industry Revenue (Million), by Distribution Channel 2024 & 2032
- Figure 25: Middle East & Africa US Recovery Drinks Industry Revenue Share (%), by Distribution Channel 2024 & 2032
- Figure 26: Middle East & Africa US Recovery Drinks Industry Revenue (Million), by Country 2024 & 2032
- Figure 27: Middle East & Africa US Recovery Drinks Industry Revenue Share (%), by Country 2024 & 2032
- Figure 28: Asia Pacific US Recovery Drinks Industry Revenue (Million), by Product Type 2024 & 2032
- Figure 29: Asia Pacific US Recovery Drinks Industry Revenue Share (%), by Product Type 2024 & 2032
- Figure 30: Asia Pacific US Recovery Drinks Industry Revenue (Million), by Distribution Channel 2024 & 2032
- Figure 31: Asia Pacific US Recovery Drinks Industry Revenue Share (%), by Distribution Channel 2024 & 2032
- Figure 32: Asia Pacific US Recovery Drinks Industry Revenue (Million), by Country 2024 & 2032
- Figure 33: Asia Pacific US Recovery Drinks Industry Revenue Share (%), by Country 2024 & 2032
List of Tables
- Table 1: Global US Recovery Drinks Industry Revenue Million Forecast, by Region 2019 & 2032
- Table 2: Global US Recovery Drinks Industry Revenue Million Forecast, by Product Type 2019 & 2032
- Table 3: Global US Recovery Drinks Industry Revenue Million Forecast, by Distribution Channel 2019 & 2032
- Table 4: Global US Recovery Drinks Industry Revenue Million Forecast, by Region 2019 & 2032
- Table 5: Global US Recovery Drinks Industry Revenue Million Forecast, by Country 2019 & 2032
- Table 6: Northeast US Recovery Drinks Industry Revenue (Million) Forecast, by Application 2019 & 2032
- Table 7: Southeast US Recovery Drinks Industry Revenue (Million) Forecast, by Application 2019 & 2032
- Table 8: Midwest US Recovery Drinks Industry Revenue (Million) Forecast, by Application 2019 & 2032
- Table 9: Southwest US Recovery Drinks Industry Revenue (Million) Forecast, by Application 2019 & 2032
- Table 10: West US Recovery Drinks Industry Revenue (Million) Forecast, by Application 2019 & 2032
- Table 11: Global US Recovery Drinks Industry Revenue Million Forecast, by Product Type 2019 & 2032
- Table 12: Global US Recovery Drinks Industry Revenue Million Forecast, by Distribution Channel 2019 & 2032
- Table 13: Global US Recovery Drinks Industry Revenue Million Forecast, by Country 2019 & 2032
- Table 14: United States US Recovery Drinks Industry Revenue (Million) Forecast, by Application 2019 & 2032
- Table 15: Canada US Recovery Drinks Industry Revenue (Million) Forecast, by Application 2019 & 2032
- Table 16: Mexico US Recovery Drinks Industry Revenue (Million) Forecast, by Application 2019 & 2032
- Table 17: Global US Recovery Drinks Industry Revenue Million Forecast, by Product Type 2019 & 2032
- Table 18: Global US Recovery Drinks Industry Revenue Million Forecast, by Distribution Channel 2019 & 2032
- Table 19: Global US Recovery Drinks Industry Revenue Million Forecast, by Country 2019 & 2032
- Table 20: Brazil US Recovery Drinks Industry Revenue (Million) Forecast, by Application 2019 & 2032
- Table 21: Argentina US Recovery Drinks Industry Revenue (Million) Forecast, by Application 2019 & 2032
- Table 22: Rest of South America US Recovery Drinks Industry Revenue (Million) Forecast, by Application 2019 & 2032
- Table 23: Global US Recovery Drinks Industry Revenue Million Forecast, by Product Type 2019 & 2032
- Table 24: Global US Recovery Drinks Industry Revenue Million Forecast, by Distribution Channel 2019 & 2032
- Table 25: Global US Recovery Drinks Industry Revenue Million Forecast, by Country 2019 & 2032
- Table 26: United Kingdom US Recovery Drinks Industry Revenue (Million) Forecast, by Application 2019 & 2032
- Table 27: Germany US Recovery Drinks Industry Revenue (Million) Forecast, by Application 2019 & 2032
- Table 28: France US Recovery Drinks Industry Revenue (Million) Forecast, by Application 2019 & 2032
- Table 29: Italy US Recovery Drinks Industry Revenue (Million) Forecast, by Application 2019 & 2032
- Table 30: Spain US Recovery Drinks Industry Revenue (Million) Forecast, by Application 2019 & 2032
- Table 31: Russia US Recovery Drinks Industry Revenue (Million) Forecast, by Application 2019 & 2032
- Table 32: Benelux US Recovery Drinks Industry Revenue (Million) Forecast, by Application 2019 & 2032
- Table 33: Nordics US Recovery Drinks Industry Revenue (Million) Forecast, by Application 2019 & 2032
- Table 34: Rest of Europe US Recovery Drinks Industry Revenue (Million) Forecast, by Application 2019 & 2032
- Table 35: Global US Recovery Drinks Industry Revenue Million Forecast, by Product Type 2019 & 2032
- Table 36: Global US Recovery Drinks Industry Revenue Million Forecast, by Distribution Channel 2019 & 2032
- Table 37: Global US Recovery Drinks Industry Revenue Million Forecast, by Country 2019 & 2032
- Table 38: Turkey US Recovery Drinks Industry Revenue (Million) Forecast, by Application 2019 & 2032
- Table 39: Israel US Recovery Drinks Industry Revenue (Million) Forecast, by Application 2019 & 2032
- Table 40: GCC US Recovery Drinks Industry Revenue (Million) Forecast, by Application 2019 & 2032
- Table 41: North Africa US Recovery Drinks Industry Revenue (Million) Forecast, by Application 2019 & 2032
- Table 42: South Africa US Recovery Drinks Industry Revenue (Million) Forecast, by Application 2019 & 2032
- Table 43: Rest of Middle East & Africa US Recovery Drinks Industry Revenue (Million) Forecast, by Application 2019 & 2032
- Table 44: Global US Recovery Drinks Industry Revenue Million Forecast, by Product Type 2019 & 2032
- Table 45: Global US Recovery Drinks Industry Revenue Million Forecast, by Distribution Channel 2019 & 2032
- Table 46: Global US Recovery Drinks Industry Revenue Million Forecast, by Country 2019 & 2032
- Table 47: China US Recovery Drinks Industry Revenue (Million) Forecast, by Application 2019 & 2032
- Table 48: India US Recovery Drinks Industry Revenue (Million) Forecast, by Application 2019 & 2032
- Table 49: Japan US Recovery Drinks Industry Revenue (Million) Forecast, by Application 2019 & 2032
- Table 50: South Korea US Recovery Drinks Industry Revenue (Million) Forecast, by Application 2019 & 2032
- Table 51: ASEAN US Recovery Drinks Industry Revenue (Million) Forecast, by Application 2019 & 2032
- Table 52: Oceania US Recovery Drinks Industry Revenue (Million) Forecast, by Application 2019 & 2032
- Table 53: Rest of Asia Pacific US Recovery Drinks Industry Revenue (Million) Forecast, by Application 2019 & 2032
Frequently Asked Questions
1. What is the projected Compound Annual Growth Rate (CAGR) of the US Recovery Drinks Industry?
The projected CAGR is approximately 5.72%.
2. Which companies are prominent players in the US Recovery Drinks Industry?
Key companies in the market include Nestle SA, Kill Cliff, Abbott Nutrition, PepsiCo Inc, Glanbia plc, Energy Lab Nutrition, Fluid Sports Nutrition*List Not Exhaustive, Danone SA.
3. What are the main segments of the US Recovery Drinks Industry?
The market segments include Product Type, Distribution Channel.
4. Can you provide details about the market size?
The market size is estimated to be USD XX Million as of 2022.
5. What are some drivers contributing to market growth?
Demand for specialty and organic coffee pods and capsules; Innovations in packaging formats.
6. What are the notable trends driving market growth?
Growing Physical Activity Participation Rate. Coupled With Marketing Campaigns.
7. Are there any restraints impacting market growth?
Availability of counterfeit products.
8. Can you provide examples of recent developments in the market?
N/A
9. What pricing options are available for accessing the report?
Pricing options include single-user, multi-user, and enterprise licenses priced at USD 3800, USD 4500, and USD 5800 respectively.
10. Is the market size provided in terms of value or volume?
The market size is provided in terms of value, measured in Million.
11. Are there any specific market keywords associated with the report?
Yes, the market keyword associated with the report is "US Recovery Drinks Industry," which aids in identifying and referencing the specific market segment covered.
12. How do I determine which pricing option suits my needs best?
The pricing options vary based on user requirements and access needs. Individual users may opt for single-user licenses, while businesses requiring broader access may choose multi-user or enterprise licenses for cost-effective access to the report.
13. Are there any additional resources or data provided in the US Recovery Drinks Industry report?
While the report offers comprehensive insights, it's advisable to review the specific contents or supplementary materials provided to ascertain if additional resources or data are available.
14. How can I stay updated on further developments or reports in the US Recovery Drinks Industry?
To stay informed about further developments, trends, and reports in the US Recovery Drinks Industry, consider subscribing to industry newsletters, following relevant companies and organizations, or regularly checking reputable industry news sources and publications.
Methodology
Step 1 - Identification of Relevant Samples Size from Population Database


Step 2 - Approaches for Defining Global Market Size (Value, Volume* & Price*)

Note*: In applicable scenarios
Step 3 - Data Sources
Primary Research
- Web Analytics
- Survey Reports
- Research Institute
- Latest Research Reports
- Opinion Leaders
Secondary Research
- Annual Reports
- White Paper
- Latest Press Release
- Industry Association
- Paid Database
- Investor Presentations

Step 4 - Data Triangulation
Involves using different sources of information in order to increase the validity of a study
These sources are likely to be stakeholders in a program - participants, other researchers, program staff, other community members, and so on.
Then we put all data in single framework & apply various statistical tools to find out the dynamic on the market.
During the analysis stage, feedback from the stakeholder groups would be compared to determine areas of agreement as well as areas of divergence
