

Key Insights
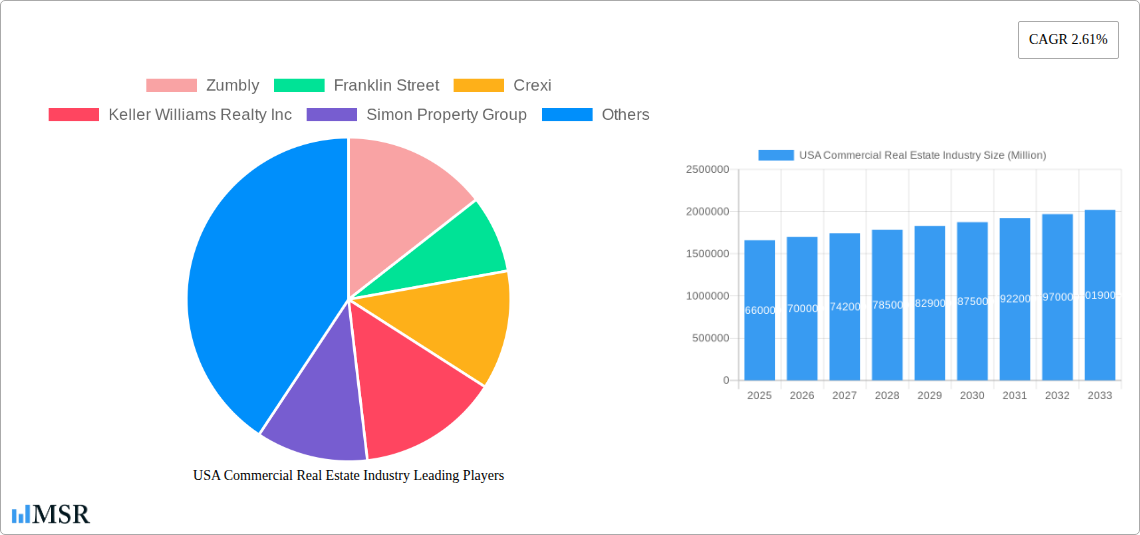
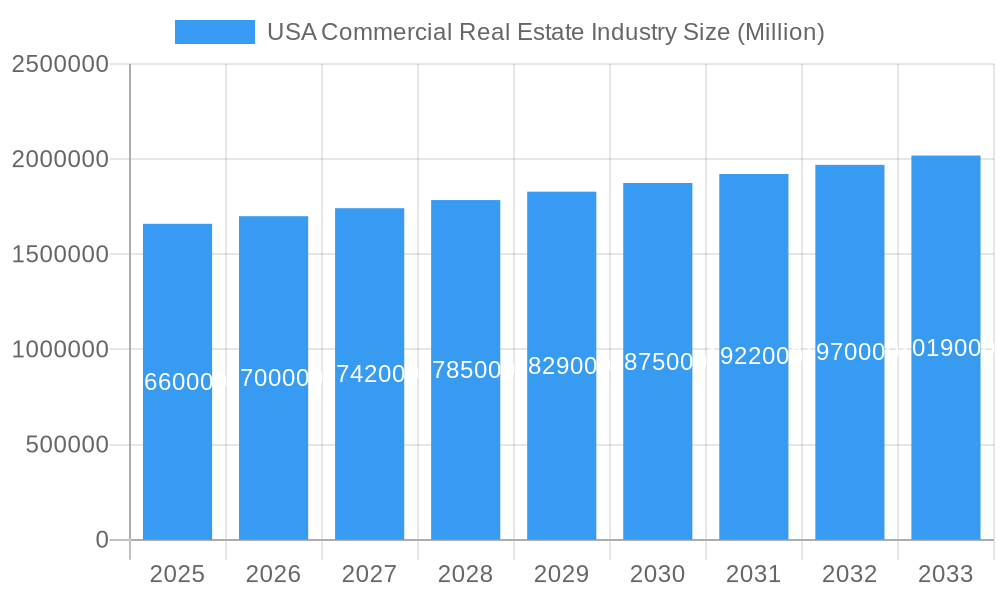
The US commercial real estate (CRE) market, valued at $1.66 trillion in 2025, is projected to experience steady growth with a compound annual growth rate (CAGR) of 2.61% from 2025 to 2033. This growth is driven by several key factors. Strong economic fundamentals, including a robust job market and increasing business investment, are fueling demand for office, retail, and industrial spaces. The rise of e-commerce continues to stimulate the logistics sector, driving the need for larger and more strategically located warehouses and distribution centers. Furthermore, growth in urban populations and changing lifestyle preferences are bolstering demand within the multi-family and hospitality segments. However, factors like rising interest rates, inflation, and potential economic slowdowns pose challenges to the market's consistent expansion. Geographic variations exist; major cities like New York, Los Angeles, and San Francisco are expected to see higher growth rates compared to smaller markets due to their strong economic activity and concentration of businesses. The segmentation within the CRE market, including office, retail, industrial, logistics, multi-family, and hospitality properties, offers diverse investment opportunities depending on market conditions and investor risk tolerance. The competitive landscape is characterized by both large national firms and local players, creating a dynamic and evolving market structure. Analysis of regional trends across the Northeast, Southeast, Midwest, Southwest, and West regions reveals varying growth trajectories depending upon local economic conditions and specific property types.
USA Commercial Real Estate Industry Market Size (In Million)
The forecast period (2025-2033) anticipates a continuation of these trends, with growth potentially moderating in the latter years depending on macroeconomic factors. The resilience of the CRE market is expected to continue but at a potentially slower pace than in previous years due to macroeconomic uncertainties. Specific market segments, like the industrial and logistics sectors, may experience more robust growth than others, indicating strategic investment opportunities within these areas. The ongoing evolution of hybrid work models and the impact of technological advancements on commercial space usage will significantly influence the market dynamics throughout the forecast period, demanding adaptive strategies from investors and developers. Careful consideration of these factors is crucial for effective investment decisions within the US commercial real estate sector.
USA Commercial Real Estate Industry Company Market Share
USA Commercial Real Estate Industry: A Comprehensive Market Report (2019-2033)
This in-depth report provides a comprehensive analysis of the USA commercial real estate industry, covering market dynamics, key trends, leading players, and future growth prospects. From 2019 to 2033, the sector has undergone significant transformation, shaped by technological disruptions, evolving consumer preferences, and macroeconomic fluctuations. This report, using 2025 as the base year and projecting until 2033, offers crucial insights for investors, developers, and industry stakeholders navigating this dynamic landscape. The market size is projected to reach xx Million by 2025 and xx Million by 2033, exhibiting a Compound Annual Growth Rate (CAGR) of xx%.
USA Commercial Real Estate Industry Market Concentration & Dynamics
The USA commercial real estate market exhibits a moderately concentrated landscape, with several large players holding significant market share. Key metrics, including market share data and M&A deal counts, reveal a dynamic environment influenced by mergers and acquisitions (M&A) activity. While exact market share data varies by segment (Office, Retail, Industrial, Logistics, Multi-family, Hospitality), national players like Simon Property Group and regional leaders maintain strong positions. The industry's innovation ecosystem is characterized by PropTech advancements, impacting property management, leasing, and investment strategies.
- Market Concentration: High in certain segments (e.g., large-scale malls), moderate in others (e.g., multi-family).
- Innovation: Rapid advancements in PropTech, including CRM systems, property management software, and data analytics platforms.
- Regulatory Framework: Complex and varies by state and locality, impacting development costs and timelines.
- Substitute Products: Limited direct substitutes, but alternative investment options (e.g., stocks, bonds) compete for capital.
- End-User Trends: Demand for sustainable, technologically advanced, and amenity-rich spaces.
- M&A Activity: A significant number of deals, particularly in the 2019-2024 historical period (xx deals), indicating industry consolidation. The projected number of M&A deals for 2025-2033 is xx.
USA Commercial Real Estate Industry Industry Insights & Trends
The US commercial real estate market is characterized by strong growth drivers, including a robust economy (pre-pandemic and projected post-pandemic recovery), increasing urbanization, and a growing demand for flexible workspaces. However, technological disruptions and evolving consumer behaviors are reshaping the industry. The adoption of PropTech solutions increases operational efficiency and enhances the tenant experience. The shift toward remote work has impacted office demand, while e-commerce growth continues to fuel demand for industrial and logistics space. Market size is expected to grow significantly during the forecast period.
Key Markets & Segments Leading USA Commercial Real Estate Industry
While all segments contribute to the overall market, the Industrial/Logistics sector shows robust growth, driven by e-commerce expansion. Within key cities, New York, Los Angeles, and San Francisco remain dominant, fueled by strong economic activity and population density.
- Dominant Segments: Industrial/Logistics and Multi-family show the strongest growth.
- Key City Drivers:
- New York: High demand for office and multi-family, strong financial sector.
- Los Angeles: Significant growth in entertainment, technology, and logistics sectors.
- San Francisco: High demand for technology-related office spaces.
- Other Key Cities: Exhibit varying degrees of growth depending on local economic conditions and infrastructure developments. These cities have a total commercial real estate market value of approximately xx Million in 2025.
- Growth Drivers: Strong population growth in certain areas, expansion of key industries (technology, logistics), and continuous infrastructure development contribute to the growth.
USA Commercial Real Estate Industry Product Developments
Product innovation in the sector focuses on sustainable building materials, smart building technology, and flexible workspaces catering to evolving tenant needs. Advancements in property management software and data analytics provide significant competitive advantages. This leads to an optimized tenant experience and streamlined operations.
Challenges in the USA Commercial Real Estate Industry Market
The industry faces several challenges, including rising construction costs, supply chain disruptions, increased regulatory scrutiny, and competition from alternative investment assets. These factors impact profitability and development timelines. For example, supply chain disruptions in 2022-2023 led to a xx% increase in construction costs.
Forces Driving USA Commercial Real Estate Industry Growth
Key growth drivers include technological advancements (PropTech), strong economic growth (prior to and post pandemic recovery), and government incentives for sustainable development. These factors fuel both market expansion and innovation within the industry.
Long-Term Growth Catalysts in the USA Commercial Real Estate Industry
Long-term growth will be driven by continued technological innovation, strategic partnerships between traditional real estate firms and tech companies, and expansion into new markets and asset classes. These strategies will enable the industry to effectively adapt to changing market conditions.
Emerging Opportunities in USA Commercial Real Estate Industry
Emerging opportunities lie in the development of sustainable and resilient infrastructure, the integration of smart building technologies, and the expansion into new asset classes, such as data centers and life sciences facilities. These trends reflect a shift towards a more efficient and technology-driven industry.
Leading Players in the USA Commercial Real Estate Industry Sector
- Zumbly
- Franklin Street
- Crexi
- Keller Williams Realty Inc
- Simon Property Group
- Hightower
- Mohr Partners
- Lamudi
- Coldwell Banker
- ERA Real Estate
- RE/MAX
- John Propp Commercial Group
- HqO
- Century
- Progressive Real Estate Partners
- Shannon-Waltchack
Key Milestones in USA Commercial Real Estate Industry Industry
- 2020: Significant market disruption due to the COVID-19 pandemic.
- 2021-2022: Increased adoption of PropTech solutions and remote work strategies.
- 2023: Ongoing recovery and adaptation to post-pandemic conditions, focus on sustainable development.
- [Insert other significant milestones with dates and brief descriptions of impact]
Strategic Outlook for USA Commercial Real Estate Industry Market
The future of the US commercial real estate market is positive, driven by strong long-term growth drivers and innovative solutions to current challenges. Strategic opportunities lie in adapting to evolving consumer preferences, embracing technological advancements, and fostering sustainable and resilient development practices. This will position the industry for continued success in the years to come.
USA Commercial Real Estate Industry Segmentation
-
1. Type
- 1.1. Offices
- 1.2. Retail
- 1.3. Industrial
- 1.4. Logistics
- 1.5. Multi-family
- 1.6. Hospitality
-
2. Key City
- 2.1. New York
- 2.2. Chicago
- 2.3. Los Angeles
- 2.4. San Francisco
- 2.5. Boston
- 2.6. Denver
- 2.7. Houston
- 2.8. Phoenix
- 2.9. Atlanta
- 2.10. Salt Lake City
USA Commercial Real Estate Industry Segmentation By Geography
-
1. North America
- 1.1. United States
- 1.2. Canada
- 1.3. Mexico
-
2. South America
- 2.1. Brazil
- 2.2. Argentina
- 2.3. Rest of South America
-
3. Europe
- 3.1. United Kingdom
- 3.2. Germany
- 3.3. France
- 3.4. Italy
- 3.5. Spain
- 3.6. Russia
- 3.7. Benelux
- 3.8. Nordics
- 3.9. Rest of Europe
-
4. Middle East & Africa
- 4.1. Turkey
- 4.2. Israel
- 4.3. GCC
- 4.4. North Africa
- 4.5. South Africa
- 4.6. Rest of Middle East & Africa
-
5. Asia Pacific
- 5.1. China
- 5.2. India
- 5.3. Japan
- 5.4. South Korea
- 5.5. ASEAN
- 5.6. Oceania
- 5.7. Rest of Asia Pacific
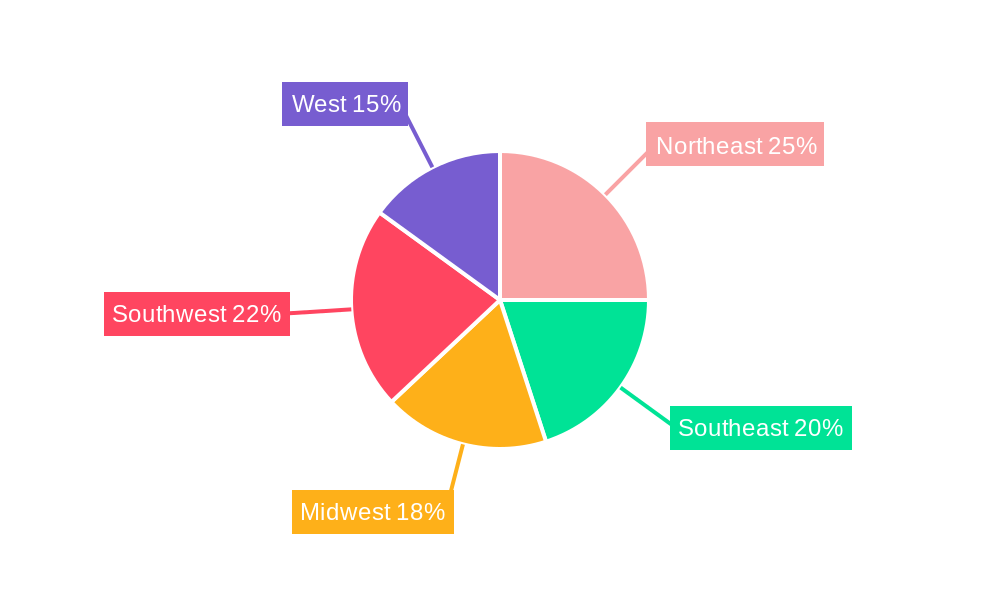
USA Commercial Real Estate Industry Regional Market Share
Geographic Coverage of USA Commercial Real Estate Industry
USA Commercial Real Estate Industry REPORT HIGHLIGHTS
| Aspects | Details |
|---|---|
| Study Period | 2020-2034 |
| Base Year | 2025 |
| Estimated Year | 2026 |
| Forecast Period | 2026-2034 |
| Historical Period | 2020-2025 |
| Growth Rate | CAGR of 2.61% from 2020-2034 |
| Segmentation |
|
Table of Contents
- 1. Introduction
- 1.1. Research Scope
- 1.2. Market Segmentation
- 1.3. Research Methodology
- 1.4. Definitions and Assumptions
- 2. Executive Summary
- 2.1. Introduction
- 3. Market Dynamics
- 3.1. Introduction
- 3.2. Market Drivers
- 3.2.1. Increasing number of startups
- 3.3. Market Restrains
- 3.3.1. Low Awareness and Privacy Issues
- 3.4. Market Trends
- 3.4.1. Industrial Sector Expected to Record High Demand
- 4. Market Factor Analysis
- 4.1. Porters Five Forces
- 4.2. Supply/Value Chain
- 4.3. PESTEL analysis
- 4.4. Market Entropy
- 4.5. Patent/Trademark Analysis
- 5. Global USA Commercial Real Estate Industry Analysis, Insights and Forecast, 2020-2032
- 5.1. Market Analysis, Insights and Forecast - by Type
- 5.1.1. Offices
- 5.1.2. Retail
- 5.1.3. Industrial
- 5.1.4. Logistics
- 5.1.5. Multi-family
- 5.1.6. Hospitality
- 5.2. Market Analysis, Insights and Forecast - by Key City
- 5.2.1. New York
- 5.2.2. Chicago
- 5.2.3. Los Angeles
- 5.2.4. San Francisco
- 5.2.5. Boston
- 5.2.6. Denver
- 5.2.7. Houston
- 5.2.8. Phoenix
- 5.2.9. Atlanta
- 5.2.10. Salt Lake City
- 5.3. Market Analysis, Insights and Forecast - by Region
- 5.3.1. North America
- 5.3.2. South America
- 5.3.3. Europe
- 5.3.4. Middle East & Africa
- 5.3.5. Asia Pacific
- 5.1. Market Analysis, Insights and Forecast - by Type
- 6. North America USA Commercial Real Estate Industry Analysis, Insights and Forecast, 2020-2032
- 6.1. Market Analysis, Insights and Forecast - by Type
- 6.1.1. Offices
- 6.1.2. Retail
- 6.1.3. Industrial
- 6.1.4. Logistics
- 6.1.5. Multi-family
- 6.1.6. Hospitality
- 6.2. Market Analysis, Insights and Forecast - by Key City
- 6.2.1. New York
- 6.2.2. Chicago
- 6.2.3. Los Angeles
- 6.2.4. San Francisco
- 6.2.5. Boston
- 6.2.6. Denver
- 6.2.7. Houston
- 6.2.8. Phoenix
- 6.2.9. Atlanta
- 6.2.10. Salt Lake City
- 6.1. Market Analysis, Insights and Forecast - by Type
- 7. South America USA Commercial Real Estate Industry Analysis, Insights and Forecast, 2020-2032
- 7.1. Market Analysis, Insights and Forecast - by Type
- 7.1.1. Offices
- 7.1.2. Retail
- 7.1.3. Industrial
- 7.1.4. Logistics
- 7.1.5. Multi-family
- 7.1.6. Hospitality
- 7.2. Market Analysis, Insights and Forecast - by Key City
- 7.2.1. New York
- 7.2.2. Chicago
- 7.2.3. Los Angeles
- 7.2.4. San Francisco
- 7.2.5. Boston
- 7.2.6. Denver
- 7.2.7. Houston
- 7.2.8. Phoenix
- 7.2.9. Atlanta
- 7.2.10. Salt Lake City
- 7.1. Market Analysis, Insights and Forecast - by Type
- 8. Europe USA Commercial Real Estate Industry Analysis, Insights and Forecast, 2020-2032
- 8.1. Market Analysis, Insights and Forecast - by Type
- 8.1.1. Offices
- 8.1.2. Retail
- 8.1.3. Industrial
- 8.1.4. Logistics
- 8.1.5. Multi-family
- 8.1.6. Hospitality
- 8.2. Market Analysis, Insights and Forecast - by Key City
- 8.2.1. New York
- 8.2.2. Chicago
- 8.2.3. Los Angeles
- 8.2.4. San Francisco
- 8.2.5. Boston
- 8.2.6. Denver
- 8.2.7. Houston
- 8.2.8. Phoenix
- 8.2.9. Atlanta
- 8.2.10. Salt Lake City
- 8.1. Market Analysis, Insights and Forecast - by Type
- 9. Middle East & Africa USA Commercial Real Estate Industry Analysis, Insights and Forecast, 2020-2032
- 9.1. Market Analysis, Insights and Forecast - by Type
- 9.1.1. Offices
- 9.1.2. Retail
- 9.1.3. Industrial
- 9.1.4. Logistics
- 9.1.5. Multi-family
- 9.1.6. Hospitality
- 9.2. Market Analysis, Insights and Forecast - by Key City
- 9.2.1. New York
- 9.2.2. Chicago
- 9.2.3. Los Angeles
- 9.2.4. San Francisco
- 9.2.5. Boston
- 9.2.6. Denver
- 9.2.7. Houston
- 9.2.8. Phoenix
- 9.2.9. Atlanta
- 9.2.10. Salt Lake City
- 9.1. Market Analysis, Insights and Forecast - by Type
- 10. Asia Pacific USA Commercial Real Estate Industry Analysis, Insights and Forecast, 2020-2032
- 10.1. Market Analysis, Insights and Forecast - by Type
- 10.1.1. Offices
- 10.1.2. Retail
- 10.1.3. Industrial
- 10.1.4. Logistics
- 10.1.5. Multi-family
- 10.1.6. Hospitality
- 10.2. Market Analysis, Insights and Forecast - by Key City
- 10.2.1. New York
- 10.2.2. Chicago
- 10.2.3. Los Angeles
- 10.2.4. San Francisco
- 10.2.5. Boston
- 10.2.6. Denver
- 10.2.7. Houston
- 10.2.8. Phoenix
- 10.2.9. Atlanta
- 10.2.10. Salt Lake City
- 10.1. Market Analysis, Insights and Forecast - by Type
- 11. Competitive Analysis
- 11.1. Global Market Share Analysis 2025
- 11.2. Company Profiles
- 11.2.1 Zumbly
- 11.2.1.1. Overview
- 11.2.1.2. Products
- 11.2.1.3. SWOT Analysis
- 11.2.1.4. Recent Developments
- 11.2.1.5. Financials (Based on Availability)
- 11.2.2 Franklin Street
- 11.2.2.1. Overview
- 11.2.2.2. Products
- 11.2.2.3. SWOT Analysis
- 11.2.2.4. Recent Developments
- 11.2.2.5. Financials (Based on Availability)
- 11.2.3 Crexi
- 11.2.3.1. Overview
- 11.2.3.2. Products
- 11.2.3.3. SWOT Analysis
- 11.2.3.4. Recent Developments
- 11.2.3.5. Financials (Based on Availability)
- 11.2.4 Keller Williams Realty Inc
- 11.2.4.1. Overview
- 11.2.4.2. Products
- 11.2.4.3. SWOT Analysis
- 11.2.4.4. Recent Developments
- 11.2.4.5. Financials (Based on Availability)
- 11.2.5 Simon Property Group
- 11.2.5.1. Overview
- 11.2.5.2. Products
- 11.2.5.3. SWOT Analysis
- 11.2.5.4. Recent Developments
- 11.2.5.5. Financials (Based on Availability)
- 11.2.6 Hightower
- 11.2.6.1. Overview
- 11.2.6.2. Products
- 11.2.6.3. SWOT Analysis
- 11.2.6.4. Recent Developments
- 11.2.6.5. Financials (Based on Availability)
- 11.2.7 Mohr Partners
- 11.2.7.1. Overview
- 11.2.7.2. Products
- 11.2.7.3. SWOT Analysis
- 11.2.7.4. Recent Developments
- 11.2.7.5. Financials (Based on Availability)
- 11.2.8 Lamudi
- 11.2.8.1. Overview
- 11.2.8.2. Products
- 11.2.8.3. SWOT Analysis
- 11.2.8.4. Recent Developments
- 11.2.8.5. Financials (Based on Availability)
- 11.2.9 Coldwell Banker
- 11.2.9.1. Overview
- 11.2.9.2. Products
- 11.2.9.3. SWOT Analysis
- 11.2.9.4. Recent Developments
- 11.2.9.5. Financials (Based on Availability)
- 11.2.10 ERA Real Estate
- 11.2.10.1. Overview
- 11.2.10.2. Products
- 11.2.10.3. SWOT Analysis
- 11.2.10.4. Recent Developments
- 11.2.10.5. Financials (Based on Availability)
- 11.2.11 RE/MAX
- 11.2.11.1. Overview
- 11.2.11.2. Products
- 11.2.11.3. SWOT Analysis
- 11.2.11.4. Recent Developments
- 11.2.11.5. Financials (Based on Availability)
- 11.2.12 John Propp Commercial Group
- 11.2.12.1. Overview
- 11.2.12.2. Products
- 11.2.12.3. SWOT Analysis
- 11.2.12.4. Recent Developments
- 11.2.12.5. Financials (Based on Availability)
- 11.2.13 HqO**List Not Exhaustive
- 11.2.13.1. Overview
- 11.2.13.2. Products
- 11.2.13.3. SWOT Analysis
- 11.2.13.4. Recent Developments
- 11.2.13.5. Financials (Based on Availability)
- 11.2.14 Century
- 11.2.14.1. Overview
- 11.2.14.2. Products
- 11.2.14.3. SWOT Analysis
- 11.2.14.4. Recent Developments
- 11.2.14.5. Financials (Based on Availability)
- 11.2.15 Progressive Real Estate Partners
- 11.2.15.1. Overview
- 11.2.15.2. Products
- 11.2.15.3. SWOT Analysis
- 11.2.15.4. Recent Developments
- 11.2.15.5. Financials (Based on Availability)
- 11.2.16 Shannon-Waltchack
- 11.2.16.1. Overview
- 11.2.16.2. Products
- 11.2.16.3. SWOT Analysis
- 11.2.16.4. Recent Developments
- 11.2.16.5. Financials (Based on Availability)
- 11.2.1 Zumbly
List of Figures
- Figure 1: Global USA Commercial Real Estate Industry Revenue Breakdown (Million, %) by Region 2025 & 2033
- Figure 2: North America USA Commercial Real Estate Industry Revenue (Million), by Type 2025 & 2033
- Figure 3: North America USA Commercial Real Estate Industry Revenue Share (%), by Type 2025 & 2033
- Figure 4: North America USA Commercial Real Estate Industry Revenue (Million), by Key City 2025 & 2033
- Figure 5: North America USA Commercial Real Estate Industry Revenue Share (%), by Key City 2025 & 2033
- Figure 6: North America USA Commercial Real Estate Industry Revenue (Million), by Country 2025 & 2033
- Figure 7: North America USA Commercial Real Estate Industry Revenue Share (%), by Country 2025 & 2033
- Figure 8: South America USA Commercial Real Estate Industry Revenue (Million), by Type 2025 & 2033
- Figure 9: South America USA Commercial Real Estate Industry Revenue Share (%), by Type 2025 & 2033
- Figure 10: South America USA Commercial Real Estate Industry Revenue (Million), by Key City 2025 & 2033
- Figure 11: South America USA Commercial Real Estate Industry Revenue Share (%), by Key City 2025 & 2033
- Figure 12: South America USA Commercial Real Estate Industry Revenue (Million), by Country 2025 & 2033
- Figure 13: South America USA Commercial Real Estate Industry Revenue Share (%), by Country 2025 & 2033
- Figure 14: Europe USA Commercial Real Estate Industry Revenue (Million), by Type 2025 & 2033
- Figure 15: Europe USA Commercial Real Estate Industry Revenue Share (%), by Type 2025 & 2033
- Figure 16: Europe USA Commercial Real Estate Industry Revenue (Million), by Key City 2025 & 2033
- Figure 17: Europe USA Commercial Real Estate Industry Revenue Share (%), by Key City 2025 & 2033
- Figure 18: Europe USA Commercial Real Estate Industry Revenue (Million), by Country 2025 & 2033
- Figure 19: Europe USA Commercial Real Estate Industry Revenue Share (%), by Country 2025 & 2033
- Figure 20: Middle East & Africa USA Commercial Real Estate Industry Revenue (Million), by Type 2025 & 2033
- Figure 21: Middle East & Africa USA Commercial Real Estate Industry Revenue Share (%), by Type 2025 & 2033
- Figure 22: Middle East & Africa USA Commercial Real Estate Industry Revenue (Million), by Key City 2025 & 2033
- Figure 23: Middle East & Africa USA Commercial Real Estate Industry Revenue Share (%), by Key City 2025 & 2033
- Figure 24: Middle East & Africa USA Commercial Real Estate Industry Revenue (Million), by Country 2025 & 2033
- Figure 25: Middle East & Africa USA Commercial Real Estate Industry Revenue Share (%), by Country 2025 & 2033
- Figure 26: Asia Pacific USA Commercial Real Estate Industry Revenue (Million), by Type 2025 & 2033
- Figure 27: Asia Pacific USA Commercial Real Estate Industry Revenue Share (%), by Type 2025 & 2033
- Figure 28: Asia Pacific USA Commercial Real Estate Industry Revenue (Million), by Key City 2025 & 2033
- Figure 29: Asia Pacific USA Commercial Real Estate Industry Revenue Share (%), by Key City 2025 & 2033
- Figure 30: Asia Pacific USA Commercial Real Estate Industry Revenue (Million), by Country 2025 & 2033
- Figure 31: Asia Pacific USA Commercial Real Estate Industry Revenue Share (%), by Country 2025 & 2033
List of Tables
- Table 1: Global USA Commercial Real Estate Industry Revenue Million Forecast, by Type 2020 & 2033
- Table 2: Global USA Commercial Real Estate Industry Revenue Million Forecast, by Key City 2020 & 2033
- Table 3: Global USA Commercial Real Estate Industry Revenue Million Forecast, by Region 2020 & 2033
- Table 4: Global USA Commercial Real Estate Industry Revenue Million Forecast, by Type 2020 & 2033
- Table 5: Global USA Commercial Real Estate Industry Revenue Million Forecast, by Key City 2020 & 2033
- Table 6: Global USA Commercial Real Estate Industry Revenue Million Forecast, by Country 2020 & 2033
- Table 7: United States USA Commercial Real Estate Industry Revenue (Million) Forecast, by Application 2020 & 2033
- Table 8: Canada USA Commercial Real Estate Industry Revenue (Million) Forecast, by Application 2020 & 2033
- Table 9: Mexico USA Commercial Real Estate Industry Revenue (Million) Forecast, by Application 2020 & 2033
- Table 10: Global USA Commercial Real Estate Industry Revenue Million Forecast, by Type 2020 & 2033
- Table 11: Global USA Commercial Real Estate Industry Revenue Million Forecast, by Key City 2020 & 2033
- Table 12: Global USA Commercial Real Estate Industry Revenue Million Forecast, by Country 2020 & 2033
- Table 13: Brazil USA Commercial Real Estate Industry Revenue (Million) Forecast, by Application 2020 & 2033
- Table 14: Argentina USA Commercial Real Estate Industry Revenue (Million) Forecast, by Application 2020 & 2033
- Table 15: Rest of South America USA Commercial Real Estate Industry Revenue (Million) Forecast, by Application 2020 & 2033
- Table 16: Global USA Commercial Real Estate Industry Revenue Million Forecast, by Type 2020 & 2033
- Table 17: Global USA Commercial Real Estate Industry Revenue Million Forecast, by Key City 2020 & 2033
- Table 18: Global USA Commercial Real Estate Industry Revenue Million Forecast, by Country 2020 & 2033
- Table 19: United Kingdom USA Commercial Real Estate Industry Revenue (Million) Forecast, by Application 2020 & 2033
- Table 20: Germany USA Commercial Real Estate Industry Revenue (Million) Forecast, by Application 2020 & 2033
- Table 21: France USA Commercial Real Estate Industry Revenue (Million) Forecast, by Application 2020 & 2033
- Table 22: Italy USA Commercial Real Estate Industry Revenue (Million) Forecast, by Application 2020 & 2033
- Table 23: Spain USA Commercial Real Estate Industry Revenue (Million) Forecast, by Application 2020 & 2033
- Table 24: Russia USA Commercial Real Estate Industry Revenue (Million) Forecast, by Application 2020 & 2033
- Table 25: Benelux USA Commercial Real Estate Industry Revenue (Million) Forecast, by Application 2020 & 2033
- Table 26: Nordics USA Commercial Real Estate Industry Revenue (Million) Forecast, by Application 2020 & 2033
- Table 27: Rest of Europe USA Commercial Real Estate Industry Revenue (Million) Forecast, by Application 2020 & 2033
- Table 28: Global USA Commercial Real Estate Industry Revenue Million Forecast, by Type 2020 & 2033
- Table 29: Global USA Commercial Real Estate Industry Revenue Million Forecast, by Key City 2020 & 2033
- Table 30: Global USA Commercial Real Estate Industry Revenue Million Forecast, by Country 2020 & 2033
- Table 31: Turkey USA Commercial Real Estate Industry Revenue (Million) Forecast, by Application 2020 & 2033
- Table 32: Israel USA Commercial Real Estate Industry Revenue (Million) Forecast, by Application 2020 & 2033
- Table 33: GCC USA Commercial Real Estate Industry Revenue (Million) Forecast, by Application 2020 & 2033
- Table 34: North Africa USA Commercial Real Estate Industry Revenue (Million) Forecast, by Application 2020 & 2033
- Table 35: South Africa USA Commercial Real Estate Industry Revenue (Million) Forecast, by Application 2020 & 2033
- Table 36: Rest of Middle East & Africa USA Commercial Real Estate Industry Revenue (Million) Forecast, by Application 2020 & 2033
- Table 37: Global USA Commercial Real Estate Industry Revenue Million Forecast, by Type 2020 & 2033
- Table 38: Global USA Commercial Real Estate Industry Revenue Million Forecast, by Key City 2020 & 2033
- Table 39: Global USA Commercial Real Estate Industry Revenue Million Forecast, by Country 2020 & 2033
- Table 40: China USA Commercial Real Estate Industry Revenue (Million) Forecast, by Application 2020 & 2033
- Table 41: India USA Commercial Real Estate Industry Revenue (Million) Forecast, by Application 2020 & 2033
- Table 42: Japan USA Commercial Real Estate Industry Revenue (Million) Forecast, by Application 2020 & 2033
- Table 43: South Korea USA Commercial Real Estate Industry Revenue (Million) Forecast, by Application 2020 & 2033
- Table 44: ASEAN USA Commercial Real Estate Industry Revenue (Million) Forecast, by Application 2020 & 2033
- Table 45: Oceania USA Commercial Real Estate Industry Revenue (Million) Forecast, by Application 2020 & 2033
- Table 46: Rest of Asia Pacific USA Commercial Real Estate Industry Revenue (Million) Forecast, by Application 2020 & 2033
Frequently Asked Questions
1. What is the projected Compound Annual Growth Rate (CAGR) of the USA Commercial Real Estate Industry?
The projected CAGR is approximately 2.61%.
2. Which companies are prominent players in the USA Commercial Real Estate Industry?
Key companies in the market include Zumbly, Franklin Street, Crexi, Keller Williams Realty Inc, Simon Property Group, Hightower, Mohr Partners, Lamudi, Coldwell Banker, ERA Real Estate, RE/MAX, John Propp Commercial Group, HqO**List Not Exhaustive, Century, Progressive Real Estate Partners, Shannon-Waltchack.
3. What are the main segments of the USA Commercial Real Estate Industry?
The market segments include Type, Key City.
4. Can you provide details about the market size?
The market size is estimated to be USD 1.66 Million as of 2022.
5. What are some drivers contributing to market growth?
Increasing number of startups.
6. What are the notable trends driving market growth?
Industrial Sector Expected to Record High Demand.
7. Are there any restraints impacting market growth?
Low Awareness and Privacy Issues.
8. Can you provide examples of recent developments in the market?
N/A
9. What pricing options are available for accessing the report?
Pricing options include single-user, multi-user, and enterprise licenses priced at USD 3800, USD 4500, and USD 5800 respectively.
10. Is the market size provided in terms of value or volume?
The market size is provided in terms of value, measured in Million.
11. Are there any specific market keywords associated with the report?
Yes, the market keyword associated with the report is "USA Commercial Real Estate Industry," which aids in identifying and referencing the specific market segment covered.
12. How do I determine which pricing option suits my needs best?
The pricing options vary based on user requirements and access needs. Individual users may opt for single-user licenses, while businesses requiring broader access may choose multi-user or enterprise licenses for cost-effective access to the report.
13. Are there any additional resources or data provided in the USA Commercial Real Estate Industry report?
While the report offers comprehensive insights, it's advisable to review the specific contents or supplementary materials provided to ascertain if additional resources or data are available.
14. How can I stay updated on further developments or reports in the USA Commercial Real Estate Industry?
To stay informed about further developments, trends, and reports in the USA Commercial Real Estate Industry, consider subscribing to industry newsletters, following relevant companies and organizations, or regularly checking reputable industry news sources and publications.
Methodology
Step 1 - Identification of Relevant Samples Size from Population Database


Step 2 - Approaches for Defining Global Market Size (Value, Volume* & Price*)

Note*: In applicable scenarios
Step 3 - Data Sources
Primary Research
- Web Analytics
- Survey Reports
- Research Institute
- Latest Research Reports
- Opinion Leaders
Secondary Research
- Annual Reports
- White Paper
- Latest Press Release
- Industry Association
- Paid Database
- Investor Presentations

Step 4 - Data Triangulation
Involves using different sources of information in order to increase the validity of a study
These sources are likely to be stakeholders in a program - participants, other researchers, program staff, other community members, and so on.
Then we put all data in single framework & apply various statistical tools to find out the dynamic on the market.
During the analysis stage, feedback from the stakeholder groups would be compared to determine areas of agreement as well as areas of divergence