

Key Insights
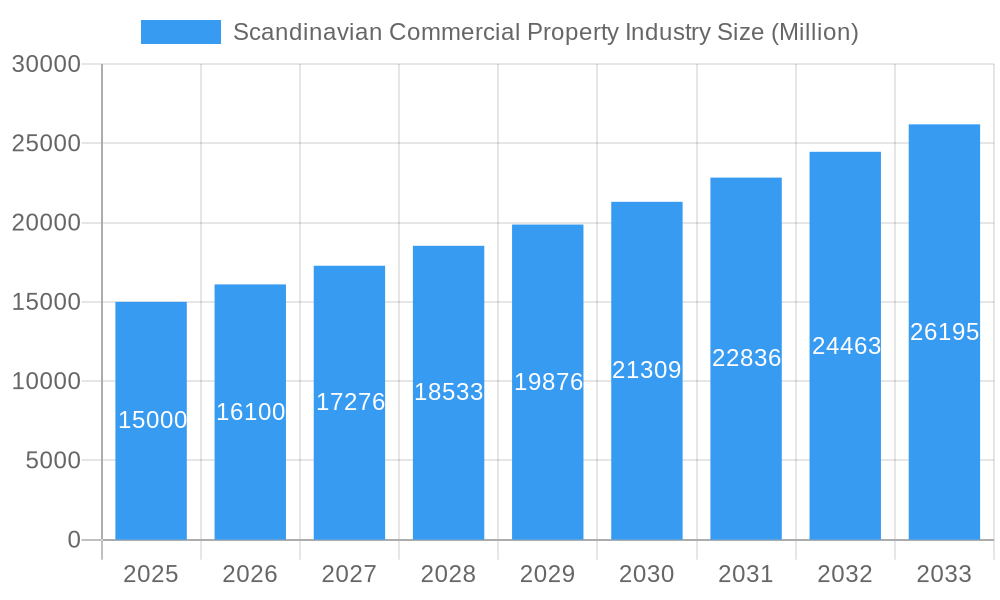
The Scandinavian commercial property market, covering Denmark, Norway, and Sweden, demonstrates a strong investment outlook. Projections indicate a Compound Annual Growth Rate (CAGR) of 3.75% from a base year of 2025 to 2033. Key growth drivers include robust regional economic performance, particularly in major urban centers like Oslo, Stockholm, and Copenhagen, which stimulates demand across office, retail, and logistics sectors. The expanding technology industry and a commitment to sustainable development are also propelling the construction of modern, energy-efficient properties. Potential challenges such as interest rate fluctuations and global economic instability are present. Nevertheless, the market's diversity, encompassing offices, retail, industrial, logistics, multi-family, and hospitality segments, provides inherent resilience. Prominent entities like Citycon, BPT Group, Jeudan A/S, Vasakronan AB, and Cushman & Wakefield, alongside emerging developers and agencies, are actively shaping the market. The increasing adoption of sustainable building practices and adaptability to evolving work models, such as hybrid arrangements, are significantly influencing investment strategies and long-term market trajectories.
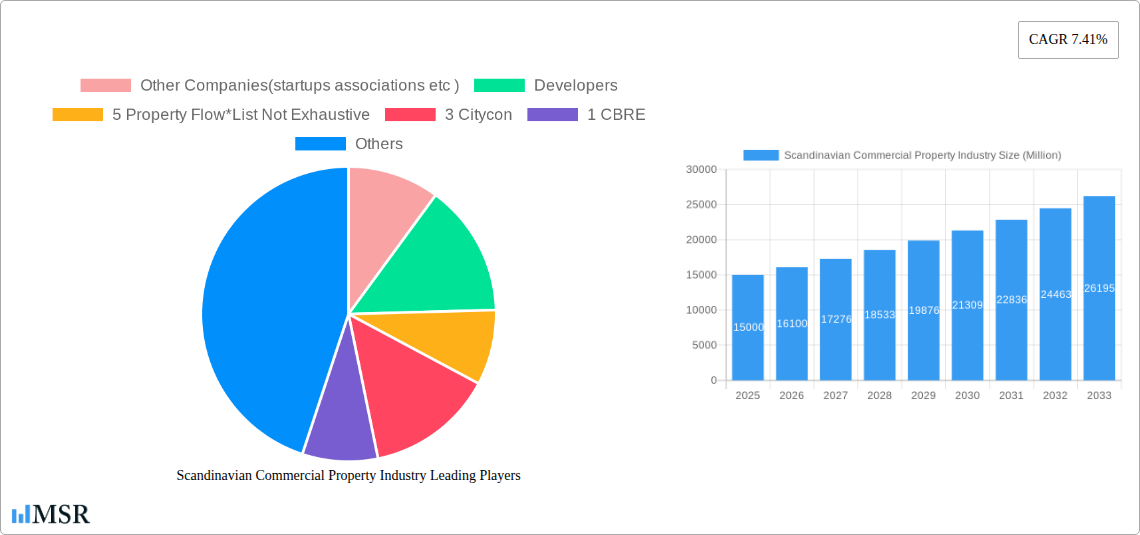
Scandinavian Commercial Property Industry Market Size (In Million)
Market segmentation by property type reveals a balanced landscape. While office space remains a significant component, the growth in e-commerce is driving expansion in logistics and warehousing facilities. The hospitality sector is also anticipated to recover, supported by increasing tourism and business travel. Geographical concentration in major cities highlights established business infrastructure; however, opportunities are emerging in secondary cities due to ongoing urban development and population growth. The overall market presents considerable promise. Investors are advised to closely monitor macroeconomic conditions and adapt strategies to evolving trends in sustainability, technological advancements, and shifting workplace dynamics. A competitive market environment is evident, characterized by both established international firms and specialized local players.
Scandinavian Commercial Property Industry Company Market Share
Scandinavian Commercial Property Industry: 2019-2033 Market Report
Dive deep into the lucrative Scandinavian commercial property market with this comprehensive report, projecting growth trends from 2019 to 2033. This in-depth analysis provides invaluable insights for investors, developers, and industry stakeholders seeking to navigate this dynamic sector. The report leverages extensive data analysis and incorporates expert opinions to forecast market dynamics and identify key opportunities. With a focus on Denmark, Norway, and Sweden, this report covers key cities like Oslo, Stockholm, and Copenhagen, examining office, retail, industrial, logistics, multi-family, and hospitality segments.
Scandinavian Commercial Property Industry Market Concentration & Dynamics
This section analyzes the market concentration, innovation, regulatory landscape, and competitive dynamics within the Scandinavian commercial property industry from 2019-2033. We examine market share distribution among key players, highlighting mergers and acquisitions (M&A) activity, and identify emerging trends impacting market structure.
Market Concentration: The Scandinavian commercial property market demonstrates a moderately concentrated structure, with a few large players holding significant market share. However, a vibrant ecosystem of smaller developers and real estate agencies also contributes significantly to the overall market volume. The estimated market size in 2025 is approximately xx Million, with a projected CAGR of xx% during 2025-2033.
Innovation Ecosystems: A strong focus on sustainable development and technological integration (PropTech) is driving innovation. The emergence of PropTech startups is reshaping processes and creating opportunities for efficiency gains.
Regulatory Frameworks: Regulatory frameworks across the three Scandinavian countries influence development and investment decisions. Variations in regulations across borders require careful consideration for strategic planning.
Substitute Products and End-User Trends: The rise of co-working spaces and flexible office solutions presents alternative options to traditional office leases. Shifting end-user preferences, particularly towards sustainable and technologically advanced spaces, are influencing investment strategies.
M&A Activities: The historical period (2019-2024) witnessed xx M&A deals, with a predicted increase to xx deals during the forecast period (2025-2033), signifying a dynamic and consolidating market. Market leaders such as NREP (Logicenters) and others continue to expand their portfolios through acquisitions.
Scandinavian Commercial Property Industry Industry Insights & Trends
This section provides a detailed analysis of market growth drivers, technological disruptions, and evolving consumer behavior shaping the Scandinavian commercial property industry. We will explore the key factors influencing market expansion and analyze their impact on investment strategies.
The Scandinavian commercial property market is characterized by robust growth driven by factors such as a strong economy, increasing urbanization, and a growing population. Technological advancements, particularly in areas such as smart buildings and PropTech solutions, are revolutionizing the industry, leading to increased efficiency and improved tenant experiences. The market size in 2024 was approximately xx Million, with an expected expansion to xx Million by 2025. Technological advancements in areas such as building automation and data analytics are driving efficiency gains and creating new opportunities for investors. Changing consumer preferences are influencing property development, with a growing focus on sustainable and flexible workspaces. The estimated CAGR for the forecast period (2025-2033) is xx%.
Key Markets & Segments Leading Scandinavian Commercial Property Industry
This section identifies the dominant regions, countries, and property types within the Scandinavian commercial property market. The analysis highlights market drivers and provides in-depth insights into the leading segments.
By Country:
- Sweden: Strong economic growth and significant investments in infrastructure contribute to the dominance of the Swedish market, particularly in Stockholm.
- Norway: Oslo’s robust economy and expanding population drive high demand for commercial properties, especially offices.
- Denmark: Copenhagen benefits from a strong financial sector and growing tourism, creating a healthy demand for various property types.
By Type:
- Offices: High demand for modern, flexible office spaces, driven by a strong economy and a growing workforce, makes this a significant segment.
- Logistics: Growth in e-commerce is fueling demand for logistics facilities, driving significant investment in this area across the region.
- Retail: While facing challenges from e-commerce, the retail segment remains relevant, particularly in prime locations and with a focus on experiential retail.
Key City Drivers:
- Oslo: Strong economic growth, a thriving tech scene, and significant government investments drive demand.
- Stockholm: A dynamic and innovative economy, coupled with a high concentration of multinational companies, fuels high demand.
- Copenhagen: A blend of a strong financial sector, tourism, and a robust tech ecosystem ensures consistent market activity.
Scandinavian Commercial Property Industry Product Developments
The Scandinavian commercial property industry is witnessing significant innovation in building design, construction materials, and technology integration. Smart building technologies, sustainable designs, and flexible workspace configurations are enhancing the appeal and functionality of commercial properties. These innovations are creating competitive advantages for developers and attracting a wider range of tenants.
Challenges in the Scandinavian Commercial Property Industry Market
The Scandinavian commercial property market faces several challenges, including rising construction costs, increased competition, and potential regulatory changes. Supply chain disruptions and fluctuating interest rates also present uncertainties in the market. These factors can affect project timelines and profitability. The impact of these challenges on market growth can be significant and requires careful planning.
Forces Driving Scandinavian Commercial Property Industry Growth
The Scandinavian commercial property market is poised for continued growth driven by several factors. These include robust economic growth across the region, an increase in urbanization, and technological advancements that improve efficiency and tenant experience. Government investments in infrastructure, coupled with a favorable regulatory environment in certain areas, further contribute to market expansion.
Long-Term Growth Catalysts in the Scandinavian Commercial Property Industry
Long-term growth in the Scandinavian commercial property sector will depend on several catalysts. Continued innovation in sustainable building practices and technological integration will be essential. Strategic partnerships between developers and technology companies, as well as expansions into new markets or property types, will also be pivotal for long-term success.
Emerging Opportunities in Scandinavian Commercial Property Industry
Emerging opportunities in the Scandinavian market include the growing demand for sustainable and energy-efficient buildings. The expanding PropTech sector offers opportunities for technological innovation in property management and tenant services. Furthermore, the growth of co-working spaces and flexible office solutions represents a significant area for investment and expansion.
Leading Players in the Scandinavian Commercial Property Industry Sector
- Other Companies (startups, associations, etc.)
- Developers:
- Property Flow
- Citycon (Citycon)
- BPT Group
- Jeudan A/S (Jeudan A/S)
- Vasakronan AB (Vasakronan AB)
- Cushman and Wakefield (Cushman and Wakefield)
- Real Estate Agencies:
- Colliers International (Colliers International)
- Europages
- NREP (Logicenters) (NREP)
- Nordkap
- Spotscale
- WEC360
- Stronghold
- CBRE (CBRE)
Key Milestones in Scandinavian Commercial Property Industry Industry
- 2020: Increased focus on sustainable building practices and ESG (environmental, social, and governance) factors.
- 2021: Several significant M&A deals reshaped the market landscape.
- 2022: PropTech investment surges as digital transformation accelerates.
- 2023: Growing emphasis on flexible and hybrid workspaces.
- 2024: Increased adoption of smart building technologies. (Further milestones to be added based on available data for 2025 onwards.)
Strategic Outlook for Scandinavian Commercial Property Industry Market
The Scandinavian commercial property market presents significant long-term growth potential. The continued demand for high-quality, sustainable, and technologically advanced spaces, coupled with robust economic growth and supportive government policies, will drive significant investment and development. Strategic partnerships, technological advancements, and a focus on sustainable practices will be key to maximizing growth opportunities in the years to come.
Scandinavian Commercial Property Industry Segmentation
-
1. Type
- 1.1. Offices
- 1.2. Retail
- 1.3. Industrial
- 1.4. Logistics
- 1.5. Multi-family
- 1.6. Hospitality
-
2. Countries
- 2.1. Denmark
- 2.2. Norway
- 2.3. Sweden
-
3. Key Cities
- 3.1. Oslo
- 3.2. Stockholm
- 3.3. Copenhagen
Scandinavian Commercial Property Industry Segmentation By Geography
-
1. North America
- 1.1. United States
- 1.2. Canada
- 1.3. Mexico
-
2. South America
- 2.1. Brazil
- 2.2. Argentina
- 2.3. Rest of South America
-
3. Europe
- 3.1. United Kingdom
- 3.2. Germany
- 3.3. France
- 3.4. Italy
- 3.5. Spain
- 3.6. Russia
- 3.7. Benelux
- 3.8. Nordics
- 3.9. Rest of Europe
-
4. Middle East & Africa
- 4.1. Turkey
- 4.2. Israel
- 4.3. GCC
- 4.4. North Africa
- 4.5. South Africa
- 4.6. Rest of Middle East & Africa
-
5. Asia Pacific
- 5.1. China
- 5.2. India
- 5.3. Japan
- 5.4. South Korea
- 5.5. ASEAN
- 5.6. Oceania
- 5.7. Rest of Asia Pacific
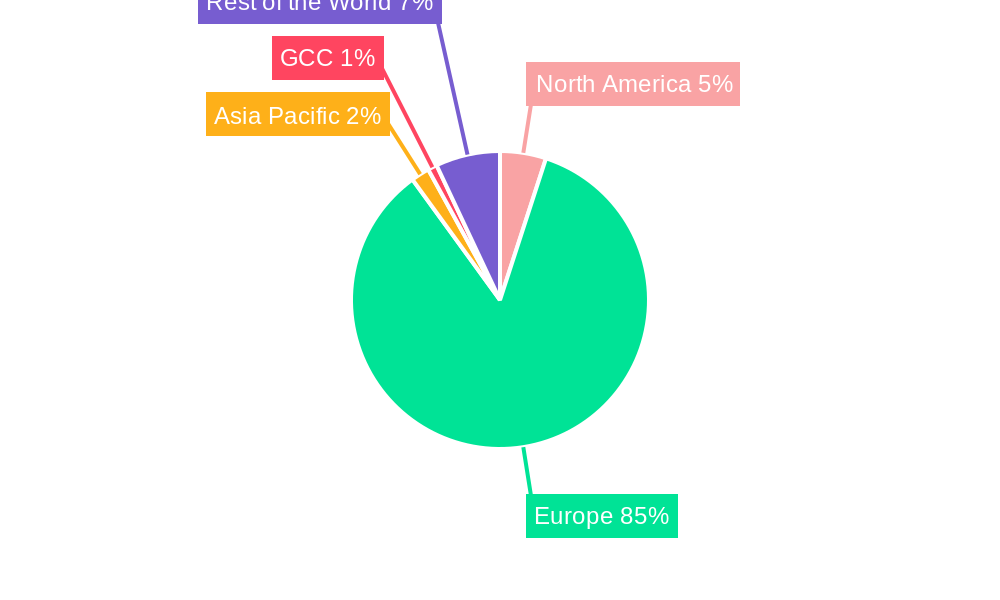
Scandinavian Commercial Property Industry Regional Market Share
Geographic Coverage of Scandinavian Commercial Property Industry
Scandinavian Commercial Property Industry REPORT HIGHLIGHTS
| Aspects | Details |
|---|---|
| Study Period | 2020-2034 |
| Base Year | 2025 |
| Estimated Year | 2026 |
| Forecast Period | 2026-2034 |
| Historical Period | 2020-2025 |
| Growth Rate | CAGR of 3.75% from 2020-2034 |
| Segmentation |
|
Table of Contents
- 1. Introduction
- 1.1. Research Scope
- 1.2. Market Segmentation
- 1.3. Research Objective
- 1.4. Definitions and Assumptions
- 2. Executive Summary
- 2.1. Market Snapshot
- 3. Market Dynamics
- 3.1. Market Drivers
- 3.2. Market Restrains
- 3.3. Market Trends
- 3.4. Market Opportunities
- 4. Market Factor Analysis
- 4.1. Porters Five Forces
- 4.1.1. Bargaining Power of Suppliers
- 4.1.2. Bargaining Power of Buyers
- 4.1.3. Threat of New Entrants
- 4.1.4. Threat of Substitutes
- 4.1.5. Competitive Rivalry
- 4.2. PESTEL analysis
- 4.3. BCG Analysis
- 4.3.1. Stars (High Growth, High Market Share)
- 4.3.2. Cash Cows (Low Growth, High Market Share)
- 4.3.3. Question Mark (High Growth, Low Market Share)
- 4.3.4. Dogs (Low Growth, Low Market Share)
- 4.4. Ansoff Matrix Analysis
- 4.5. Supply Chain Analysis
- 4.6. Regulatory Landscape
- 4.7. Current Market Potential and Opportunity Assessment (TAM–SAM–SOM Framework)
- 4.8. MSR Analyst Note
- 4.1. Porters Five Forces
- 5. Market Analysis, Insights and Forecast 2021-2033
- 5.1. Market Analysis, Insights and Forecast - by Type
- 5.1.1. Offices
- 5.1.2. Retail
- 5.1.3. Industrial
- 5.1.4. Logistics
- 5.1.5. Multi-family
- 5.1.6. Hospitality
- 5.2. Market Analysis, Insights and Forecast - by Countries
- 5.2.1. Denmark
- 5.2.2. Norway
- 5.2.3. Sweden
- 5.3. Market Analysis, Insights and Forecast - by Key Cities
- 5.3.1. Oslo
- 5.3.2. Stockholm
- 5.3.3. Copenhagen
- 5.4. Market Analysis, Insights and Forecast - by Region
- 5.4.1. North America
- 5.4.2. South America
- 5.4.3. Europe
- 5.4.4. Middle East & Africa
- 5.4.5. Asia Pacific
- 5.1. Market Analysis, Insights and Forecast - by Type
- 6. Global Scandinavian Commercial Property Industry Analysis, Insights and Forecast, 2021-2033
- 6.1. Market Analysis, Insights and Forecast - by Type
- 6.1.1. Offices
- 6.1.2. Retail
- 6.1.3. Industrial
- 6.1.4. Logistics
- 6.1.5. Multi-family
- 6.1.6. Hospitality
- 6.2. Market Analysis, Insights and Forecast - by Countries
- 6.2.1. Denmark
- 6.2.2. Norway
- 6.2.3. Sweden
- 6.3. Market Analysis, Insights and Forecast - by Key Cities
- 6.3.1. Oslo
- 6.3.2. Stockholm
- 6.3.3. Copenhagen
- 6.1. Market Analysis, Insights and Forecast - by Type
- 7. North America Scandinavian Commercial Property Industry Analysis, Insights and Forecast, 2020-2032
- 7.1. Market Analysis, Insights and Forecast - by Type
- 7.1.1. Offices
- 7.1.2. Retail
- 7.1.3. Industrial
- 7.1.4. Logistics
- 7.1.5. Multi-family
- 7.1.6. Hospitality
- 7.2. Market Analysis, Insights and Forecast - by Countries
- 7.2.1. Denmark
- 7.2.2. Norway
- 7.2.3. Sweden
- 7.3. Market Analysis, Insights and Forecast - by Key Cities
- 7.3.1. Oslo
- 7.3.2. Stockholm
- 7.3.3. Copenhagen
- 7.1. Market Analysis, Insights and Forecast - by Type
- 8. South America Scandinavian Commercial Property Industry Analysis, Insights and Forecast, 2020-2032
- 8.1. Market Analysis, Insights and Forecast - by Type
- 8.1.1. Offices
- 8.1.2. Retail
- 8.1.3. Industrial
- 8.1.4. Logistics
- 8.1.5. Multi-family
- 8.1.6. Hospitality
- 8.2. Market Analysis, Insights and Forecast - by Countries
- 8.2.1. Denmark
- 8.2.2. Norway
- 8.2.3. Sweden
- 8.3. Market Analysis, Insights and Forecast - by Key Cities
- 8.3.1. Oslo
- 8.3.2. Stockholm
- 8.3.3. Copenhagen
- 8.1. Market Analysis, Insights and Forecast - by Type
- 9. Europe Scandinavian Commercial Property Industry Analysis, Insights and Forecast, 2020-2032
- 9.1. Market Analysis, Insights and Forecast - by Type
- 9.1.1. Offices
- 9.1.2. Retail
- 9.1.3. Industrial
- 9.1.4. Logistics
- 9.1.5. Multi-family
- 9.1.6. Hospitality
- 9.2. Market Analysis, Insights and Forecast - by Countries
- 9.2.1. Denmark
- 9.2.2. Norway
- 9.2.3. Sweden
- 9.3. Market Analysis, Insights and Forecast - by Key Cities
- 9.3.1. Oslo
- 9.3.2. Stockholm
- 9.3.3. Copenhagen
- 9.1. Market Analysis, Insights and Forecast - by Type
- 10. Middle East & Africa Scandinavian Commercial Property Industry Analysis, Insights and Forecast, 2020-2032
- 10.1. Market Analysis, Insights and Forecast - by Type
- 10.1.1. Offices
- 10.1.2. Retail
- 10.1.3. Industrial
- 10.1.4. Logistics
- 10.1.5. Multi-family
- 10.1.6. Hospitality
- 10.2. Market Analysis, Insights and Forecast - by Countries
- 10.2.1. Denmark
- 10.2.2. Norway
- 10.2.3. Sweden
- 10.3. Market Analysis, Insights and Forecast - by Key Cities
- 10.3.1. Oslo
- 10.3.2. Stockholm
- 10.3.3. Copenhagen
- 10.1. Market Analysis, Insights and Forecast - by Type
- 11. Asia Pacific Scandinavian Commercial Property Industry Analysis, Insights and Forecast, 2020-2032
- 11.1. Market Analysis, Insights and Forecast - by Type
- 11.1.1. Offices
- 11.1.2. Retail
- 11.1.3. Industrial
- 11.1.4. Logistics
- 11.1.5. Multi-family
- 11.1.6. Hospitality
- 11.2. Market Analysis, Insights and Forecast - by Countries
- 11.2.1. Denmark
- 11.2.2. Norway
- 11.2.3. Sweden
- 11.3. Market Analysis, Insights and Forecast - by Key Cities
- 11.3.1. Oslo
- 11.3.2. Stockholm
- 11.3.3. Copenhagen
- 11.1. Market Analysis, Insights and Forecast - by Type
- 12. Competitive Analysis
- 12.1. Company Profiles
- 12.1.1 Other Companies(startups associations etc )
- 12.1.1.1. Company Overview
- 12.1.1.2. Products
- 12.1.1.3. Company Financials
- 12.1.1.4. SWOT Analysis
- 12.1.2 Developers
- 12.1.2.1. Company Overview
- 12.1.2.2. Products
- 12.1.2.3. Company Financials
- 12.1.2.4. SWOT Analysis
- 12.1.3 5 Property Flow*List Not Exhaustive
- 12.1.3.1. Company Overview
- 12.1.3.2. Products
- 12.1.3.3. Company Financials
- 12.1.3.4. SWOT Analysis
- 12.1.4 3 Citycon
- 12.1.4.1. Company Overview
- 12.1.4.2. Products
- 12.1.4.3. Company Financials
- 12.1.4.4. SWOT Analysis
- 12.1.5 1 CBRE
- 12.1.5.1. Company Overview
- 12.1.5.2. Products
- 12.1.5.3. Company Financials
- 12.1.5.4. SWOT Analysis
- 12.1.6 5 BPT Group
- 12.1.6.1. Company Overview
- 12.1.6.2. Products
- 12.1.6.3. Company Financials
- 12.1.6.4. SWOT Analysis
- 12.1.7 2 Jeudan A/S
- 12.1.7.1. Company Overview
- 12.1.7.2. Products
- 12.1.7.3. Company Financials
- 12.1.7.4. SWOT Analysis
- 12.1.8 1 Vasakronan AB
- 12.1.8.1. Company Overview
- 12.1.8.2. Products
- 12.1.8.3. Company Financials
- 12.1.8.4. SWOT Analysis
- 12.1.9 4 Cushman and wakefield
- 12.1.9.1. Company Overview
- 12.1.9.2. Products
- 12.1.9.3. Company Financials
- 12.1.9.4. SWOT Analysis
- 12.1.10 Real Estate Agencies
- 12.1.10.1. Company Overview
- 12.1.10.2. Products
- 12.1.10.3. Company Financials
- 12.1.10.4. SWOT Analysis
- 12.1.11 3 Colliers international
- 12.1.11.1. Company Overview
- 12.1.11.2. Products
- 12.1.11.3. Company Financials
- 12.1.11.4. SWOT Analysis
- 12.1.12 2 Europages
- 12.1.12.1. Company Overview
- 12.1.12.2. Products
- 12.1.12.3. Company Financials
- 12.1.12.4. SWOT Analysis
- 12.1.13 4 NREP (Logicenters)
- 12.1.13.1. Company Overview
- 12.1.13.2. Products
- 12.1.13.3. Company Financials
- 12.1.13.4. SWOT Analysis
- 12.1.14 2 Nordkap
- 12.1.14.1. Company Overview
- 12.1.14.2. Products
- 12.1.14.3. Company Financials
- 12.1.14.4. SWOT Analysis
- 12.1.15 3 Spotscale
- 12.1.15.1. Company Overview
- 12.1.15.2. Products
- 12.1.15.3. Company Financials
- 12.1.15.4. SWOT Analysis
- 12.1.16 4 WEC360
- 12.1.16.1. Company Overview
- 12.1.16.2. Products
- 12.1.16.3. Company Financials
- 12.1.16.4. SWOT Analysis
- 12.1.17 1 Stronghold
- 12.1.17.1. Company Overview
- 12.1.17.2. Products
- 12.1.17.3. Company Financials
- 12.1.17.4. SWOT Analysis
- 12.1.1 Other Companies(startups associations etc )
- 12.2. Market Entropy
- 12.2.1 Company's Key Areas Served
- 12.2.2 Recent Developments
- 12.3. Company Market Share Analysis 2025
- 12.3.1 Top 5 Companies Market Share Analysis
- 12.3.2 Top 3 Companies Market Share Analysis
- 12.4. List of Potential Customers
- 13. Research Methodology
List of Figures
- Figure 1: Global Scandinavian Commercial Property Industry Revenue Breakdown (million, %) by Region 2025 & 2033
- Figure 2: North America Scandinavian Commercial Property Industry Revenue (million), by Type 2025 & 2033
- Figure 3: North America Scandinavian Commercial Property Industry Revenue Share (%), by Type 2025 & 2033
- Figure 4: North America Scandinavian Commercial Property Industry Revenue (million), by Countries 2025 & 2033
- Figure 5: North America Scandinavian Commercial Property Industry Revenue Share (%), by Countries 2025 & 2033
- Figure 6: North America Scandinavian Commercial Property Industry Revenue (million), by Key Cities 2025 & 2033
- Figure 7: North America Scandinavian Commercial Property Industry Revenue Share (%), by Key Cities 2025 & 2033
- Figure 8: North America Scandinavian Commercial Property Industry Revenue (million), by Country 2025 & 2033
- Figure 9: North America Scandinavian Commercial Property Industry Revenue Share (%), by Country 2025 & 2033
- Figure 10: South America Scandinavian Commercial Property Industry Revenue (million), by Type 2025 & 2033
- Figure 11: South America Scandinavian Commercial Property Industry Revenue Share (%), by Type 2025 & 2033
- Figure 12: South America Scandinavian Commercial Property Industry Revenue (million), by Countries 2025 & 2033
- Figure 13: South America Scandinavian Commercial Property Industry Revenue Share (%), by Countries 2025 & 2033
- Figure 14: South America Scandinavian Commercial Property Industry Revenue (million), by Key Cities 2025 & 2033
- Figure 15: South America Scandinavian Commercial Property Industry Revenue Share (%), by Key Cities 2025 & 2033
- Figure 16: South America Scandinavian Commercial Property Industry Revenue (million), by Country 2025 & 2033
- Figure 17: South America Scandinavian Commercial Property Industry Revenue Share (%), by Country 2025 & 2033
- Figure 18: Europe Scandinavian Commercial Property Industry Revenue (million), by Type 2025 & 2033
- Figure 19: Europe Scandinavian Commercial Property Industry Revenue Share (%), by Type 2025 & 2033
- Figure 20: Europe Scandinavian Commercial Property Industry Revenue (million), by Countries 2025 & 2033
- Figure 21: Europe Scandinavian Commercial Property Industry Revenue Share (%), by Countries 2025 & 2033
- Figure 22: Europe Scandinavian Commercial Property Industry Revenue (million), by Key Cities 2025 & 2033
- Figure 23: Europe Scandinavian Commercial Property Industry Revenue Share (%), by Key Cities 2025 & 2033
- Figure 24: Europe Scandinavian Commercial Property Industry Revenue (million), by Country 2025 & 2033
- Figure 25: Europe Scandinavian Commercial Property Industry Revenue Share (%), by Country 2025 & 2033
- Figure 26: Middle East & Africa Scandinavian Commercial Property Industry Revenue (million), by Type 2025 & 2033
- Figure 27: Middle East & Africa Scandinavian Commercial Property Industry Revenue Share (%), by Type 2025 & 2033
- Figure 28: Middle East & Africa Scandinavian Commercial Property Industry Revenue (million), by Countries 2025 & 2033
- Figure 29: Middle East & Africa Scandinavian Commercial Property Industry Revenue Share (%), by Countries 2025 & 2033
- Figure 30: Middle East & Africa Scandinavian Commercial Property Industry Revenue (million), by Key Cities 2025 & 2033
- Figure 31: Middle East & Africa Scandinavian Commercial Property Industry Revenue Share (%), by Key Cities 2025 & 2033
- Figure 32: Middle East & Africa Scandinavian Commercial Property Industry Revenue (million), by Country 2025 & 2033
- Figure 33: Middle East & Africa Scandinavian Commercial Property Industry Revenue Share (%), by Country 2025 & 2033
- Figure 34: Asia Pacific Scandinavian Commercial Property Industry Revenue (million), by Type 2025 & 2033
- Figure 35: Asia Pacific Scandinavian Commercial Property Industry Revenue Share (%), by Type 2025 & 2033
- Figure 36: Asia Pacific Scandinavian Commercial Property Industry Revenue (million), by Countries 2025 & 2033
- Figure 37: Asia Pacific Scandinavian Commercial Property Industry Revenue Share (%), by Countries 2025 & 2033
- Figure 38: Asia Pacific Scandinavian Commercial Property Industry Revenue (million), by Key Cities 2025 & 2033
- Figure 39: Asia Pacific Scandinavian Commercial Property Industry Revenue Share (%), by Key Cities 2025 & 2033
- Figure 40: Asia Pacific Scandinavian Commercial Property Industry Revenue (million), by Country 2025 & 2033
- Figure 41: Asia Pacific Scandinavian Commercial Property Industry Revenue Share (%), by Country 2025 & 2033
List of Tables
- Table 1: Global Scandinavian Commercial Property Industry Revenue million Forecast, by Type 2020 & 2033
- Table 2: Global Scandinavian Commercial Property Industry Revenue million Forecast, by Countries 2020 & 2033
- Table 3: Global Scandinavian Commercial Property Industry Revenue million Forecast, by Key Cities 2020 & 2033
- Table 4: Global Scandinavian Commercial Property Industry Revenue million Forecast, by Region 2020 & 2033
- Table 5: Global Scandinavian Commercial Property Industry Revenue million Forecast, by Type 2020 & 2033
- Table 6: Global Scandinavian Commercial Property Industry Revenue million Forecast, by Countries 2020 & 2033
- Table 7: Global Scandinavian Commercial Property Industry Revenue million Forecast, by Key Cities 2020 & 2033
- Table 8: Global Scandinavian Commercial Property Industry Revenue million Forecast, by Country 2020 & 2033
- Table 9: United States Scandinavian Commercial Property Industry Revenue (million) Forecast, by Application 2020 & 2033
- Table 10: Canada Scandinavian Commercial Property Industry Revenue (million) Forecast, by Application 2020 & 2033
- Table 11: Mexico Scandinavian Commercial Property Industry Revenue (million) Forecast, by Application 2020 & 2033
- Table 12: Global Scandinavian Commercial Property Industry Revenue million Forecast, by Type 2020 & 2033
- Table 13: Global Scandinavian Commercial Property Industry Revenue million Forecast, by Countries 2020 & 2033
- Table 14: Global Scandinavian Commercial Property Industry Revenue million Forecast, by Key Cities 2020 & 2033
- Table 15: Global Scandinavian Commercial Property Industry Revenue million Forecast, by Country 2020 & 2033
- Table 16: Brazil Scandinavian Commercial Property Industry Revenue (million) Forecast, by Application 2020 & 2033
- Table 17: Argentina Scandinavian Commercial Property Industry Revenue (million) Forecast, by Application 2020 & 2033
- Table 18: Rest of South America Scandinavian Commercial Property Industry Revenue (million) Forecast, by Application 2020 & 2033
- Table 19: Global Scandinavian Commercial Property Industry Revenue million Forecast, by Type 2020 & 2033
- Table 20: Global Scandinavian Commercial Property Industry Revenue million Forecast, by Countries 2020 & 2033
- Table 21: Global Scandinavian Commercial Property Industry Revenue million Forecast, by Key Cities 2020 & 2033
- Table 22: Global Scandinavian Commercial Property Industry Revenue million Forecast, by Country 2020 & 2033
- Table 23: United Kingdom Scandinavian Commercial Property Industry Revenue (million) Forecast, by Application 2020 & 2033
- Table 24: Germany Scandinavian Commercial Property Industry Revenue (million) Forecast, by Application 2020 & 2033
- Table 25: France Scandinavian Commercial Property Industry Revenue (million) Forecast, by Application 2020 & 2033
- Table 26: Italy Scandinavian Commercial Property Industry Revenue (million) Forecast, by Application 2020 & 2033
- Table 27: Spain Scandinavian Commercial Property Industry Revenue (million) Forecast, by Application 2020 & 2033
- Table 28: Russia Scandinavian Commercial Property Industry Revenue (million) Forecast, by Application 2020 & 2033
- Table 29: Benelux Scandinavian Commercial Property Industry Revenue (million) Forecast, by Application 2020 & 2033
- Table 30: Nordics Scandinavian Commercial Property Industry Revenue (million) Forecast, by Application 2020 & 2033
- Table 31: Rest of Europe Scandinavian Commercial Property Industry Revenue (million) Forecast, by Application 2020 & 2033
- Table 32: Global Scandinavian Commercial Property Industry Revenue million Forecast, by Type 2020 & 2033
- Table 33: Global Scandinavian Commercial Property Industry Revenue million Forecast, by Countries 2020 & 2033
- Table 34: Global Scandinavian Commercial Property Industry Revenue million Forecast, by Key Cities 2020 & 2033
- Table 35: Global Scandinavian Commercial Property Industry Revenue million Forecast, by Country 2020 & 2033
- Table 36: Turkey Scandinavian Commercial Property Industry Revenue (million) Forecast, by Application 2020 & 2033
- Table 37: Israel Scandinavian Commercial Property Industry Revenue (million) Forecast, by Application 2020 & 2033
- Table 38: GCC Scandinavian Commercial Property Industry Revenue (million) Forecast, by Application 2020 & 2033
- Table 39: North Africa Scandinavian Commercial Property Industry Revenue (million) Forecast, by Application 2020 & 2033
- Table 40: South Africa Scandinavian Commercial Property Industry Revenue (million) Forecast, by Application 2020 & 2033
- Table 41: Rest of Middle East & Africa Scandinavian Commercial Property Industry Revenue (million) Forecast, by Application 2020 & 2033
- Table 42: Global Scandinavian Commercial Property Industry Revenue million Forecast, by Type 2020 & 2033
- Table 43: Global Scandinavian Commercial Property Industry Revenue million Forecast, by Countries 2020 & 2033
- Table 44: Global Scandinavian Commercial Property Industry Revenue million Forecast, by Key Cities 2020 & 2033
- Table 45: Global Scandinavian Commercial Property Industry Revenue million Forecast, by Country 2020 & 2033
- Table 46: China Scandinavian Commercial Property Industry Revenue (million) Forecast, by Application 2020 & 2033
- Table 47: India Scandinavian Commercial Property Industry Revenue (million) Forecast, by Application 2020 & 2033
- Table 48: Japan Scandinavian Commercial Property Industry Revenue (million) Forecast, by Application 2020 & 2033
- Table 49: South Korea Scandinavian Commercial Property Industry Revenue (million) Forecast, by Application 2020 & 2033
- Table 50: ASEAN Scandinavian Commercial Property Industry Revenue (million) Forecast, by Application 2020 & 2033
- Table 51: Oceania Scandinavian Commercial Property Industry Revenue (million) Forecast, by Application 2020 & 2033
- Table 52: Rest of Asia Pacific Scandinavian Commercial Property Industry Revenue (million) Forecast, by Application 2020 & 2033
Frequently Asked Questions
1. What is the projected Compound Annual Growth Rate (CAGR) of the Scandinavian Commercial Property Industry?
The projected CAGR is approximately 3.75%.
2. Which companies are prominent players in the Scandinavian Commercial Property Industry?
Key companies in the market include Other Companies(startups associations etc ), Developers, 5 Property Flow*List Not Exhaustive, 3 Citycon, 1 CBRE, 5 BPT Group, 2 Jeudan A/S, 1 Vasakronan AB, 4 Cushman and wakefield, Real Estate Agencies, 3 Colliers international, 2 Europages, 4 NREP (Logicenters), 2 Nordkap, 3 Spotscale, 4 WEC360, 1 Stronghold.
3. What are the main segments of the Scandinavian Commercial Property Industry?
The market segments include Type, Countries, Key Cities.
4. Can you provide details about the market size?
The market size is estimated to be USD 234.9 million as of 2022.
5. What are some drivers contributing to market growth?
Overall economic growth driving the market; The growth of business and industries driving the market.
6. What are the notable trends driving market growth?
Increase in Transaction Volume in the Office Market of Scandinavian Countries.
7. Are there any restraints impacting market growth?
Fluctuating economic conditions hindering the growth of the market; Difficulty in landownership and leasing rights affecting the market.
8. Can you provide examples of recent developments in the market?
N/A
9. What pricing options are available for accessing the report?
Pricing options include single-user, multi-user, and enterprise licenses priced at USD 3800, USD 4500, and USD 5800 respectively.
10. Is the market size provided in terms of value or volume?
The market size is provided in terms of value, measured in million.
11. Are there any specific market keywords associated with the report?
Yes, the market keyword associated with the report is "Scandinavian Commercial Property Industry," which aids in identifying and referencing the specific market segment covered.
12. How do I determine which pricing option suits my needs best?
The pricing options vary based on user requirements and access needs. Individual users may opt for single-user licenses, while businesses requiring broader access may choose multi-user or enterprise licenses for cost-effective access to the report.
13. Are there any additional resources or data provided in the Scandinavian Commercial Property Industry report?
While the report offers comprehensive insights, it's advisable to review the specific contents or supplementary materials provided to ascertain if additional resources or data are available.
14. How can I stay updated on further developments or reports in the Scandinavian Commercial Property Industry?
To stay informed about further developments, trends, and reports in the Scandinavian Commercial Property Industry, consider subscribing to industry newsletters, following relevant companies and organizations, or regularly checking reputable industry news sources and publications.
Methodology
Step 1 - Identification of Relevant Samples Size from Population Database


Step 2 - Approaches for Defining Global Market Size (Value, Volume* & Price*)

Note*: In applicable scenarios
Step 3 - Data Sources
Primary Research
- Web Analytics
- Survey Reports
- Research Institute
- Latest Research Reports
- Opinion Leaders
Secondary Research
- Annual Reports
- White Paper
- Latest Press Release
- Industry Association
- Paid Database
- Investor Presentations

Step 4 - Data Triangulation
Involves using different sources of information in order to increase the validity of a study
These sources are likely to be stakeholders in a program - participants, other researchers, program staff, other community members, and so on.
Then we put all data in single framework & apply various statistical tools to find out the dynamic on the market.
During the analysis stage, feedback from the stakeholder groups would be compared to determine areas of agreement as well as areas of divergence