

Key Insights
The UAE flexible office market, including private offices, co-working, and virtual office solutions, is poised for significant expansion. Driven by a dynamic economy, a flourishing startup ecosystem, and a widespread adoption of agile work models, the market is projected to grow at a compound annual growth rate (CAGR) of 9.16%. The market size, estimated at $1.23 billion in the base year 2025, will see substantial growth through 2033. Key sectors fueling this demand include IT and telecommunications, media and entertainment, and retail and consumer goods. Dubai, Abu Dhabi, and Sharjah are prominent hubs, attracting substantial investment in advanced workspaces. A competitive landscape features both international firms like Servcorp and Regus, and local players such as Letswork Inc and Astrolabs. While real estate price fluctuations and economic uncertainties present potential challenges, the market's strength lies in its diverse offerings and adaptability to evolving workforce needs.
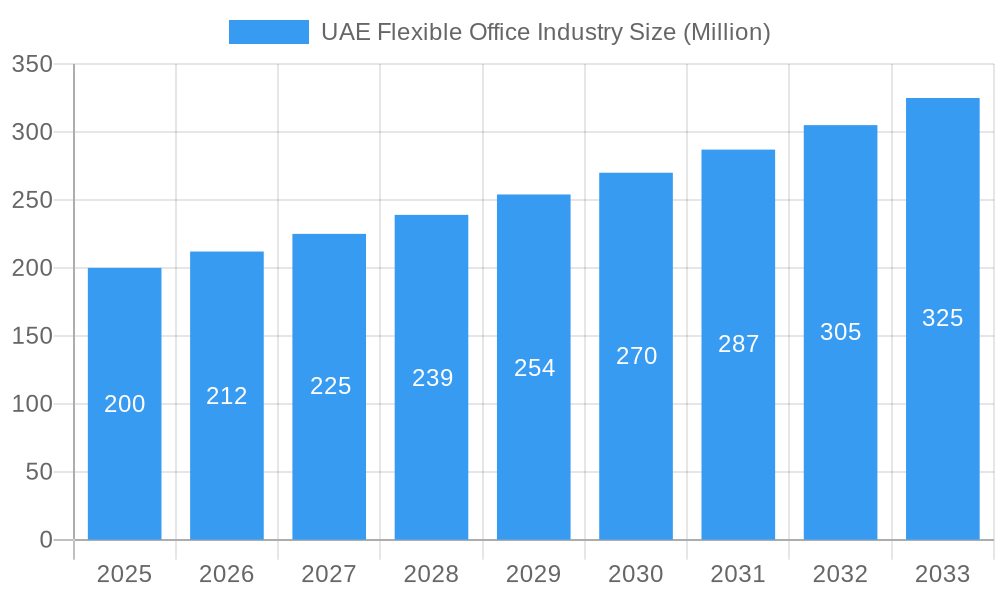
UAE Flexible Office Industry Market Size (In Billion)
Government support for entrepreneurship and innovation is a primary catalyst, fostering a robust startup environment that directly translates to increased demand for flexible workspaces. Technological advancements and improved digital infrastructure further enable remote work capabilities, enhancing the attractiveness of virtual office solutions. Businesses seeking operational agility and cost-effectiveness are increasingly opting for co-working spaces and private offices, reinforcing market growth. Intensified competition will likely see technological innovation and service differentiation become key determinants of market share. The expanding tourism sector and the resulting increase in international business presence further stimulate demand for flexible office solutions across major UAE cities.
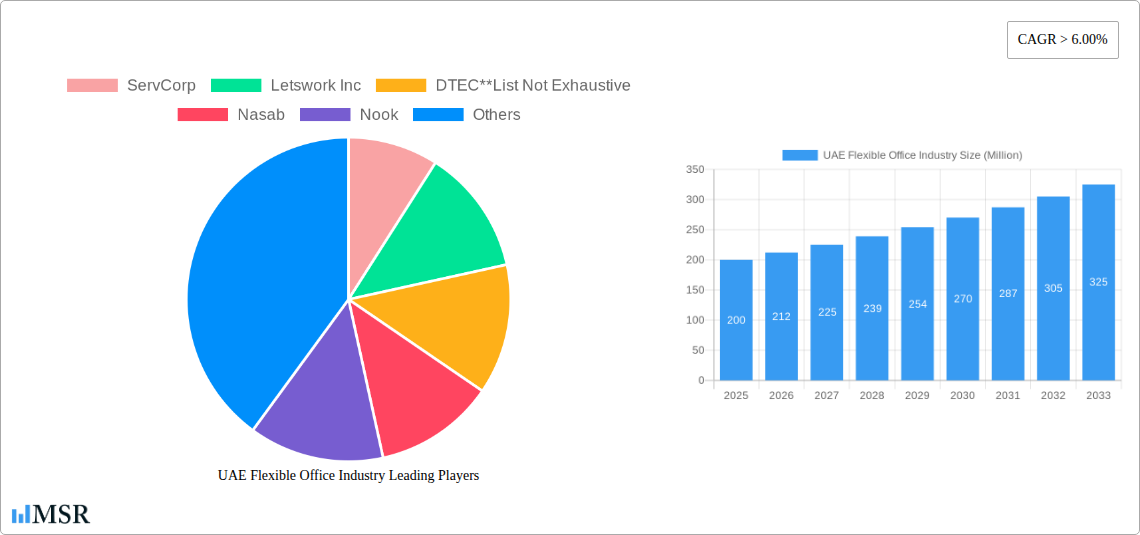
UAE Flexible Office Industry Company Market Share
UAE Flexible Office Industry: A Comprehensive Market Report (2019-2033)
This comprehensive report provides an in-depth analysis of the burgeoning UAE flexible office industry, offering invaluable insights for investors, industry stakeholders, and businesses seeking to navigate this dynamic market. Covering the period from 2019 to 2033, with a focus on 2025, this report unveils the key trends, challenges, and opportunities shaping the future of flexible workspaces in the UAE. The report meticulously examines market concentration, leading players like Servcorp, Letswork Inc, DTEC, Nasab, Nook, Astrolabs, Instant Group, WeWork Management LLC, WitWork, and Regus Group (list not exhaustive), and significant market segments including private offices, co-working spaces, and virtual offices across major UAE cities – Dubai, Abu Dhabi, Sharjah, and the Rest of UAE. The analysis encompasses end-user sectors such as IT & Telecommunications, Media & Entertainment, and Retail & Consumer Goods.
UAE Flexible Office Industry Market Concentration & Dynamics
The UAE flexible office market exhibits a moderately concentrated landscape, with a few major players commanding significant market share. However, the sector is witnessing increasing competition from smaller, specialized providers catering to niche demands. The market's dynamics are driven by a vibrant innovation ecosystem fueled by technological advancements, a supportive regulatory framework that encourages entrepreneurship, and the increasing popularity of flexible work arrangements. Substitute products, such as traditional leased offices, pose a challenge, but the flexibility and cost-effectiveness of flexible offices continue to drive adoption. End-user trends are shifting towards hybrid work models and agile organizational structures, further boosting demand. M&A activity has been moderate, with approximately xx deals recorded in the historical period (2019-2024), indicating a growing interest in consolidation and expansion within the industry. We project a xx% increase in M&A activity by 2033. Market share data for key players is presented in Appendix A.
UAE Flexible Office Industry Industry Insights & Trends
The UAE flexible office market experienced substantial growth during the historical period (2019-2024), with a compound annual growth rate (CAGR) of xx%. This robust growth is primarily attributed to the increasing adoption of flexible work arrangements by businesses of all sizes, driven by factors such as cost optimization, enhanced employee satisfaction, and increased workplace flexibility. Technological disruptions, such as the rise of booking platforms and smart office technologies, are further shaping the industry landscape. Evolving consumer behavior, characterized by a preference for collaborative workspaces and a focus on wellness and sustainability, also contributes significantly to the market's expansion. The market size in 2025 is estimated at approximately AED xx Million, projected to reach AED xx Million by 2033, driven by factors such as the rising number of startups, the increasing demand for flexible workspaces from multinational corporations, and the government's initiatives to promote innovation and entrepreneurship.
Key Markets & Segments Leading UAE Flexible Office Industry
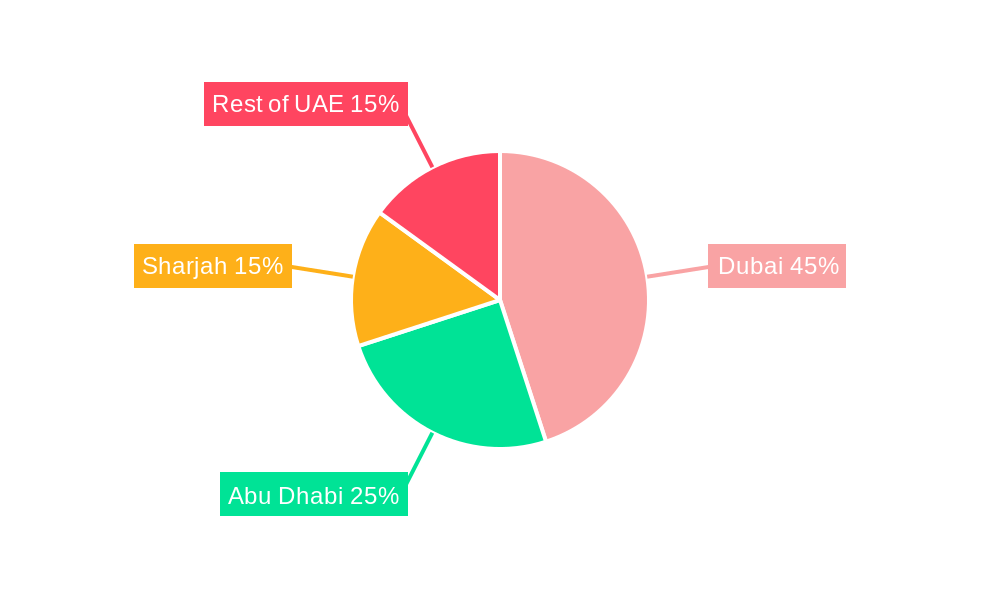
By City: Dubai dominates the UAE flexible office market, accounting for approximately xx% of the total market share in 2025. This dominance is driven by its robust economy, well-developed infrastructure, and large concentration of businesses. Abu Dhabi and Sharjah follow as significant markets, while the "Rest of UAE" segment exhibits steady growth potential. Drivers for Dubai's dominance include a strong business environment, excellent infrastructure, and a large talent pool. Abu Dhabi benefits from government initiatives promoting diversification and attracting foreign investment. Sharjah's appeal stems from its affordable costs and strategic location.
By Type: Co-working spaces constitute the largest segment in 2025, capturing approximately xx% of the market share. The popularity of co-working spaces is fueled by their cost-effectiveness, networking opportunities, and flexible lease terms. Private offices represent a significant segment, particularly among established businesses seeking a more private and customized workspace. Virtual offices cater to entrepreneurs and remote workers seeking a professional business address and communication services.
By End-User: The IT and Telecommunications sector is a key driver of demand, followed by Media and Entertainment and Retail and Consumer Goods. This is due to the increasing adoption of flexible work arrangements and the growing number of startups and freelancers in these sectors.
UAE Flexible Office Industry Product Developments
The UAE flexible office industry is characterized by continuous product innovation, with a focus on technology integration to enhance the user experience. Smart office technologies, including integrated booking systems, access control systems, and environmental controls, are becoming increasingly prevalent. The emphasis is on creating flexible, adaptable, and technologically advanced spaces catering to evolving workplace needs. This includes features like collaborative workspaces, meeting rooms with advanced video conferencing capabilities, and wellness amenities. The competitive edge lies in providing bespoke solutions, superior customer service, and a focus on creating inspiring and productive work environments.
Challenges in the UAE Flexible Office Industry Market
The UAE flexible office market faces challenges such as high real estate costs in prime locations, increasing competition from established players and new entrants, and the need to adapt to changing technological advancements. Regulatory hurdles, particularly concerning licensing and compliance, also pose a challenge. The recent global economic uncertainty has impacted demand, albeit slightly, with an estimated xx% reduction in new lease agreements in the last quarter of 2024. Supply chain disruptions, especially during the pandemic, also affected the availability of furniture and other amenities, delaying project completions.
Forces Driving UAE Flexible Office Industry Growth
The growth of the UAE flexible office industry is propelled by several key factors. The rise of the gig economy and the increasing number of freelancers and entrepreneurs are driving demand for flexible workspaces. Government initiatives promoting innovation and entrepreneurship create a favorable business environment. Furthermore, the increasing adoption of hybrid work models by large corporations is further contributing to market expansion. Technological advancements are streamlining operations and enhancing the customer experience. The continuous influx of foreign investment also contributes to the market's growth.
Long-Term Growth Catalysts in the UAE Flexible Office Industry
Long-term growth will be fueled by continuous innovation in workspace design and technology, fostering the development of smarter, more sustainable, and adaptable spaces. Strategic partnerships between flexible office providers and technology companies will enhance offerings and drive market penetration. Expanding into new markets within the UAE and targeting underserved segments will unlock additional growth potential.
Emerging Opportunities in UAE Flexible Office Industry
The industry presents several compelling opportunities. The rise of co-living spaces integrated with flexible workspaces offers a unique value proposition. Leveraging technology to personalize the workspace experience and offer customized solutions to individual users represents a significant opportunity. Focusing on sustainability and wellness in office design will cater to the growing demand for eco-friendly and health-conscious workspaces. Expansion into secondary cities and targeting specific industry niches can also unlock new avenues for growth.
Leading Players in the UAE Flexible Office Industry Sector
- Servcorp
- Letswork Inc
- DTEC
- Nasab
- Nook
- Astrolabs
- Instant Group
- WeWork Management LLC
- WitWork
- Regus Group
Key Milestones in UAE Flexible Office Industry Industry
January 2022: Cloud Spaces launches a state-of-the-art flexible working facility at Yas Mall, expanding the availability of high-quality flexible workspaces and supporting the growth of the freelance and SME sectors.
February 2022: Merex Investment leases 150,000 sq ft to Talabat for its regional headquarters at City Walk, Dubai, showcasing significant corporate commitment to flexible office spaces and impacting the demand for large-scale flexible office solutions.
Strategic Outlook for UAE Flexible Office Industry Market
The UAE flexible office market is poised for sustained growth over the forecast period (2025-2033), driven by economic diversification, technological innovation, and evolving workplace preferences. Strategic opportunities exist in leveraging technology to enhance the user experience, developing sustainable and wellness-focused spaces, and expanding into underserved markets. The sector’s future success hinges on agility, innovation, and a deep understanding of the evolving needs of the modern workforce. The market's potential is considerable, and companies that can adapt and innovate will be best positioned for long-term success.
UAE Flexible Office Industry Segmentation
-
1. Type
- 1.1. Co-working Space
- 1.2. Serviced offices / Executive suites
- 1.3. Others (Hybrid, Virtual Office)
-
2. End Use
- 2.1. Information Technology (IT and ITES)
- 2.2. BFSI (Banking, Financial Services, and Insurance)
- 2.3. Business Consulting & Professional Services
- 2.4. Others
-
3. User
- 3.1. Freelancers
- 3.2. Enterprises
- 3.3. Start-Ups
- 3.4. Others
UAE Flexible Office Industry Segmentation By Geography
-
1. North America
- 1.1. United States
- 1.2. Canada
- 1.3. Mexico
-
2. South America
- 2.1. Brazil
- 2.2. Argentina
- 2.3. Rest of South America
-
3. Europe
- 3.1. United Kingdom
- 3.2. Germany
- 3.3. France
- 3.4. Italy
- 3.5. Spain
- 3.6. Russia
- 3.7. Benelux
- 3.8. Nordics
- 3.9. Rest of Europe
-
4. Middle East & Africa
- 4.1. Turkey
- 4.2. Israel
- 4.3. GCC
- 4.4. North Africa
- 4.5. South Africa
- 4.6. Rest of Middle East & Africa
-
5. Asia Pacific
- 5.1. China
- 5.2. India
- 5.3. Japan
- 5.4. South Korea
- 5.5. ASEAN
- 5.6. Oceania
- 5.7. Rest of Asia Pacific
UAE Flexible Office Industry Regional Market Share
Geographic Coverage of UAE Flexible Office Industry
UAE Flexible Office Industry REPORT HIGHLIGHTS
| Aspects | Details |
|---|---|
| Study Period | 2020-2034 |
| Base Year | 2025 |
| Estimated Year | 2026 |
| Forecast Period | 2026-2034 |
| Historical Period | 2020-2025 |
| Growth Rate | CAGR of 9.16% from 2020-2034 |
| Segmentation |
|
Table of Contents
- 1. Introduction
- 1.1. Research Scope
- 1.2. Market Segmentation
- 1.3. Research Objective
- 1.4. Definitions and Assumptions
- 2. Executive Summary
- 2.1. Market Snapshot
- 3. Market Dynamics
- 3.1. Market Drivers
- 3.2. Market Restrains
- 3.3. Market Trends
- 3.4. Market Opportunities
- 4. Market Factor Analysis
- 4.1. Porters Five Forces
- 4.1.1. Bargaining Power of Suppliers
- 4.1.2. Bargaining Power of Buyers
- 4.1.3. Threat of New Entrants
- 4.1.4. Threat of Substitutes
- 4.1.5. Competitive Rivalry
- 4.2. PESTEL analysis
- 4.3. BCG Analysis
- 4.3.1. Stars (High Growth, High Market Share)
- 4.3.2. Cash Cows (Low Growth, High Market Share)
- 4.3.3. Question Mark (High Growth, Low Market Share)
- 4.3.4. Dogs (Low Growth, Low Market Share)
- 4.4. Ansoff Matrix Analysis
- 4.5. Supply Chain Analysis
- 4.6. Regulatory Landscape
- 4.7. Current Market Potential and Opportunity Assessment (TAM–SAM–SOM Framework)
- 4.8. MSR Analyst Note
- 4.1. Porters Five Forces
- 5. Market Analysis, Insights and Forecast 2021-2033
- 5.1. Market Analysis, Insights and Forecast - by Type
- 5.1.1. Co-working Space
- 5.1.2. Serviced offices / Executive suites
- 5.1.3. Others (Hybrid, Virtual Office)
- 5.2. Market Analysis, Insights and Forecast - by End Use
- 5.2.1. Information Technology (IT and ITES)
- 5.2.2. BFSI (Banking, Financial Services, and Insurance)
- 5.2.3. Business Consulting & Professional Services
- 5.2.4. Others
- 5.3. Market Analysis, Insights and Forecast - by User
- 5.3.1. Freelancers
- 5.3.2. Enterprises
- 5.3.3. Start-Ups
- 5.3.4. Others
- 5.4. Market Analysis, Insights and Forecast - by Region
- 5.4.1. North America
- 5.4.2. South America
- 5.4.3. Europe
- 5.4.4. Middle East & Africa
- 5.4.5. Asia Pacific
- 5.1. Market Analysis, Insights and Forecast - by Type
- 6. Global UAE Flexible Office Industry Analysis, Insights and Forecast, 2021-2033
- 6.1. Market Analysis, Insights and Forecast - by Type
- 6.1.1. Co-working Space
- 6.1.2. Serviced offices / Executive suites
- 6.1.3. Others (Hybrid, Virtual Office)
- 6.2. Market Analysis, Insights and Forecast - by End Use
- 6.2.1. Information Technology (IT and ITES)
- 6.2.2. BFSI (Banking, Financial Services, and Insurance)
- 6.2.3. Business Consulting & Professional Services
- 6.2.4. Others
- 6.3. Market Analysis, Insights and Forecast - by User
- 6.3.1. Freelancers
- 6.3.2. Enterprises
- 6.3.3. Start-Ups
- 6.3.4. Others
- 6.1. Market Analysis, Insights and Forecast - by Type
- 7. North America UAE Flexible Office Industry Analysis, Insights and Forecast, 2020-2032
- 7.1. Market Analysis, Insights and Forecast - by Type
- 7.1.1. Co-working Space
- 7.1.2. Serviced offices / Executive suites
- 7.1.3. Others (Hybrid, Virtual Office)
- 7.2. Market Analysis, Insights and Forecast - by End Use
- 7.2.1. Information Technology (IT and ITES)
- 7.2.2. BFSI (Banking, Financial Services, and Insurance)
- 7.2.3. Business Consulting & Professional Services
- 7.2.4. Others
- 7.3. Market Analysis, Insights and Forecast - by User
- 7.3.1. Freelancers
- 7.3.2. Enterprises
- 7.3.3. Start-Ups
- 7.3.4. Others
- 7.1. Market Analysis, Insights and Forecast - by Type
- 8. South America UAE Flexible Office Industry Analysis, Insights and Forecast, 2020-2032
- 8.1. Market Analysis, Insights and Forecast - by Type
- 8.1.1. Co-working Space
- 8.1.2. Serviced offices / Executive suites
- 8.1.3. Others (Hybrid, Virtual Office)
- 8.2. Market Analysis, Insights and Forecast - by End Use
- 8.2.1. Information Technology (IT and ITES)
- 8.2.2. BFSI (Banking, Financial Services, and Insurance)
- 8.2.3. Business Consulting & Professional Services
- 8.2.4. Others
- 8.3. Market Analysis, Insights and Forecast - by User
- 8.3.1. Freelancers
- 8.3.2. Enterprises
- 8.3.3. Start-Ups
- 8.3.4. Others
- 8.1. Market Analysis, Insights and Forecast - by Type
- 9. Europe UAE Flexible Office Industry Analysis, Insights and Forecast, 2020-2032
- 9.1. Market Analysis, Insights and Forecast - by Type
- 9.1.1. Co-working Space
- 9.1.2. Serviced offices / Executive suites
- 9.1.3. Others (Hybrid, Virtual Office)
- 9.2. Market Analysis, Insights and Forecast - by End Use
- 9.2.1. Information Technology (IT and ITES)
- 9.2.2. BFSI (Banking, Financial Services, and Insurance)
- 9.2.3. Business Consulting & Professional Services
- 9.2.4. Others
- 9.3. Market Analysis, Insights and Forecast - by User
- 9.3.1. Freelancers
- 9.3.2. Enterprises
- 9.3.3. Start-Ups
- 9.3.4. Others
- 9.1. Market Analysis, Insights and Forecast - by Type
- 10. Middle East & Africa UAE Flexible Office Industry Analysis, Insights and Forecast, 2020-2032
- 10.1. Market Analysis, Insights and Forecast - by Type
- 10.1.1. Co-working Space
- 10.1.2. Serviced offices / Executive suites
- 10.1.3. Others (Hybrid, Virtual Office)
- 10.2. Market Analysis, Insights and Forecast - by End Use
- 10.2.1. Information Technology (IT and ITES)
- 10.2.2. BFSI (Banking, Financial Services, and Insurance)
- 10.2.3. Business Consulting & Professional Services
- 10.2.4. Others
- 10.3. Market Analysis, Insights and Forecast - by User
- 10.3.1. Freelancers
- 10.3.2. Enterprises
- 10.3.3. Start-Ups
- 10.3.4. Others
- 10.1. Market Analysis, Insights and Forecast - by Type
- 11. Asia Pacific UAE Flexible Office Industry Analysis, Insights and Forecast, 2020-2032
- 11.1. Market Analysis, Insights and Forecast - by Type
- 11.1.1. Co-working Space
- 11.1.2. Serviced offices / Executive suites
- 11.1.3. Others (Hybrid, Virtual Office)
- 11.2. Market Analysis, Insights and Forecast - by End Use
- 11.2.1. Information Technology (IT and ITES)
- 11.2.2. BFSI (Banking, Financial Services, and Insurance)
- 11.2.3. Business Consulting & Professional Services
- 11.2.4. Others
- 11.3. Market Analysis, Insights and Forecast - by User
- 11.3.1. Freelancers
- 11.3.2. Enterprises
- 11.3.3. Start-Ups
- 11.3.4. Others
- 11.1. Market Analysis, Insights and Forecast - by Type
- 12. Competitive Analysis
- 12.1. Company Profiles
- 12.1.1 ServCorp
- 12.1.1.1. Company Overview
- 12.1.1.2. Products
- 12.1.1.3. Company Financials
- 12.1.1.4. SWOT Analysis
- 12.1.2 Letswork Inc
- 12.1.2.1. Company Overview
- 12.1.2.2. Products
- 12.1.2.3. Company Financials
- 12.1.2.4. SWOT Analysis
- 12.1.3 DTEC**List Not Exhaustive
- 12.1.3.1. Company Overview
- 12.1.3.2. Products
- 12.1.3.3. Company Financials
- 12.1.3.4. SWOT Analysis
- 12.1.4 Nasab
- 12.1.4.1. Company Overview
- 12.1.4.2. Products
- 12.1.4.3. Company Financials
- 12.1.4.4. SWOT Analysis
- 12.1.5 Nook
- 12.1.5.1. Company Overview
- 12.1.5.2. Products
- 12.1.5.3. Company Financials
- 12.1.5.4. SWOT Analysis
- 12.1.6 Astrolabs
- 12.1.6.1. Company Overview
- 12.1.6.2. Products
- 12.1.6.3. Company Financials
- 12.1.6.4. SWOT Analysis
- 12.1.7 Instant Group
- 12.1.7.1. Company Overview
- 12.1.7.2. Products
- 12.1.7.3. Company Financials
- 12.1.7.4. SWOT Analysis
- 12.1.8 WeWork Management LLC
- 12.1.8.1. Company Overview
- 12.1.8.2. Products
- 12.1.8.3. Company Financials
- 12.1.8.4. SWOT Analysis
- 12.1.9 WitWork
- 12.1.9.1. Company Overview
- 12.1.9.2. Products
- 12.1.9.3. Company Financials
- 12.1.9.4. SWOT Analysis
- 12.1.10 Regus Group
- 12.1.10.1. Company Overview
- 12.1.10.2. Products
- 12.1.10.3. Company Financials
- 12.1.10.4. SWOT Analysis
- 12.1.1 ServCorp
- 12.2. Market Entropy
- 12.2.1 Company's Key Areas Served
- 12.2.2 Recent Developments
- 12.3. Company Market Share Analysis 2025
- 12.3.1 Top 5 Companies Market Share Analysis
- 12.3.2 Top 3 Companies Market Share Analysis
- 12.4. List of Potential Customers
- 13. Research Methodology
List of Figures
- Figure 1: Global UAE Flexible Office Industry Revenue Breakdown (billion, %) by Region 2025 & 2033
- Figure 2: North America UAE Flexible Office Industry Revenue (billion), by Type 2025 & 2033
- Figure 3: North America UAE Flexible Office Industry Revenue Share (%), by Type 2025 & 2033
- Figure 4: North America UAE Flexible Office Industry Revenue (billion), by End Use 2025 & 2033
- Figure 5: North America UAE Flexible Office Industry Revenue Share (%), by End Use 2025 & 2033
- Figure 6: North America UAE Flexible Office Industry Revenue (billion), by User 2025 & 2033
- Figure 7: North America UAE Flexible Office Industry Revenue Share (%), by User 2025 & 2033
- Figure 8: North America UAE Flexible Office Industry Revenue (billion), by Country 2025 & 2033
- Figure 9: North America UAE Flexible Office Industry Revenue Share (%), by Country 2025 & 2033
- Figure 10: South America UAE Flexible Office Industry Revenue (billion), by Type 2025 & 2033
- Figure 11: South America UAE Flexible Office Industry Revenue Share (%), by Type 2025 & 2033
- Figure 12: South America UAE Flexible Office Industry Revenue (billion), by End Use 2025 & 2033
- Figure 13: South America UAE Flexible Office Industry Revenue Share (%), by End Use 2025 & 2033
- Figure 14: South America UAE Flexible Office Industry Revenue (billion), by User 2025 & 2033
- Figure 15: South America UAE Flexible Office Industry Revenue Share (%), by User 2025 & 2033
- Figure 16: South America UAE Flexible Office Industry Revenue (billion), by Country 2025 & 2033
- Figure 17: South America UAE Flexible Office Industry Revenue Share (%), by Country 2025 & 2033
- Figure 18: Europe UAE Flexible Office Industry Revenue (billion), by Type 2025 & 2033
- Figure 19: Europe UAE Flexible Office Industry Revenue Share (%), by Type 2025 & 2033
- Figure 20: Europe UAE Flexible Office Industry Revenue (billion), by End Use 2025 & 2033
- Figure 21: Europe UAE Flexible Office Industry Revenue Share (%), by End Use 2025 & 2033
- Figure 22: Europe UAE Flexible Office Industry Revenue (billion), by User 2025 & 2033
- Figure 23: Europe UAE Flexible Office Industry Revenue Share (%), by User 2025 & 2033
- Figure 24: Europe UAE Flexible Office Industry Revenue (billion), by Country 2025 & 2033
- Figure 25: Europe UAE Flexible Office Industry Revenue Share (%), by Country 2025 & 2033
- Figure 26: Middle East & Africa UAE Flexible Office Industry Revenue (billion), by Type 2025 & 2033
- Figure 27: Middle East & Africa UAE Flexible Office Industry Revenue Share (%), by Type 2025 & 2033
- Figure 28: Middle East & Africa UAE Flexible Office Industry Revenue (billion), by End Use 2025 & 2033
- Figure 29: Middle East & Africa UAE Flexible Office Industry Revenue Share (%), by End Use 2025 & 2033
- Figure 30: Middle East & Africa UAE Flexible Office Industry Revenue (billion), by User 2025 & 2033
- Figure 31: Middle East & Africa UAE Flexible Office Industry Revenue Share (%), by User 2025 & 2033
- Figure 32: Middle East & Africa UAE Flexible Office Industry Revenue (billion), by Country 2025 & 2033
- Figure 33: Middle East & Africa UAE Flexible Office Industry Revenue Share (%), by Country 2025 & 2033
- Figure 34: Asia Pacific UAE Flexible Office Industry Revenue (billion), by Type 2025 & 2033
- Figure 35: Asia Pacific UAE Flexible Office Industry Revenue Share (%), by Type 2025 & 2033
- Figure 36: Asia Pacific UAE Flexible Office Industry Revenue (billion), by End Use 2025 & 2033
- Figure 37: Asia Pacific UAE Flexible Office Industry Revenue Share (%), by End Use 2025 & 2033
- Figure 38: Asia Pacific UAE Flexible Office Industry Revenue (billion), by User 2025 & 2033
- Figure 39: Asia Pacific UAE Flexible Office Industry Revenue Share (%), by User 2025 & 2033
- Figure 40: Asia Pacific UAE Flexible Office Industry Revenue (billion), by Country 2025 & 2033
- Figure 41: Asia Pacific UAE Flexible Office Industry Revenue Share (%), by Country 2025 & 2033
List of Tables
- Table 1: Global UAE Flexible Office Industry Revenue billion Forecast, by Type 2020 & 2033
- Table 2: Global UAE Flexible Office Industry Revenue billion Forecast, by End Use 2020 & 2033
- Table 3: Global UAE Flexible Office Industry Revenue billion Forecast, by User 2020 & 2033
- Table 4: Global UAE Flexible Office Industry Revenue billion Forecast, by Region 2020 & 2033
- Table 5: Global UAE Flexible Office Industry Revenue billion Forecast, by Type 2020 & 2033
- Table 6: Global UAE Flexible Office Industry Revenue billion Forecast, by End Use 2020 & 2033
- Table 7: Global UAE Flexible Office Industry Revenue billion Forecast, by User 2020 & 2033
- Table 8: Global UAE Flexible Office Industry Revenue billion Forecast, by Country 2020 & 2033
- Table 9: United States UAE Flexible Office Industry Revenue (billion) Forecast, by Application 2020 & 2033
- Table 10: Canada UAE Flexible Office Industry Revenue (billion) Forecast, by Application 2020 & 2033
- Table 11: Mexico UAE Flexible Office Industry Revenue (billion) Forecast, by Application 2020 & 2033
- Table 12: Global UAE Flexible Office Industry Revenue billion Forecast, by Type 2020 & 2033
- Table 13: Global UAE Flexible Office Industry Revenue billion Forecast, by End Use 2020 & 2033
- Table 14: Global UAE Flexible Office Industry Revenue billion Forecast, by User 2020 & 2033
- Table 15: Global UAE Flexible Office Industry Revenue billion Forecast, by Country 2020 & 2033
- Table 16: Brazil UAE Flexible Office Industry Revenue (billion) Forecast, by Application 2020 & 2033
- Table 17: Argentina UAE Flexible Office Industry Revenue (billion) Forecast, by Application 2020 & 2033
- Table 18: Rest of South America UAE Flexible Office Industry Revenue (billion) Forecast, by Application 2020 & 2033
- Table 19: Global UAE Flexible Office Industry Revenue billion Forecast, by Type 2020 & 2033
- Table 20: Global UAE Flexible Office Industry Revenue billion Forecast, by End Use 2020 & 2033
- Table 21: Global UAE Flexible Office Industry Revenue billion Forecast, by User 2020 & 2033
- Table 22: Global UAE Flexible Office Industry Revenue billion Forecast, by Country 2020 & 2033
- Table 23: United Kingdom UAE Flexible Office Industry Revenue (billion) Forecast, by Application 2020 & 2033
- Table 24: Germany UAE Flexible Office Industry Revenue (billion) Forecast, by Application 2020 & 2033
- Table 25: France UAE Flexible Office Industry Revenue (billion) Forecast, by Application 2020 & 2033
- Table 26: Italy UAE Flexible Office Industry Revenue (billion) Forecast, by Application 2020 & 2033
- Table 27: Spain UAE Flexible Office Industry Revenue (billion) Forecast, by Application 2020 & 2033
- Table 28: Russia UAE Flexible Office Industry Revenue (billion) Forecast, by Application 2020 & 2033
- Table 29: Benelux UAE Flexible Office Industry Revenue (billion) Forecast, by Application 2020 & 2033
- Table 30: Nordics UAE Flexible Office Industry Revenue (billion) Forecast, by Application 2020 & 2033
- Table 31: Rest of Europe UAE Flexible Office Industry Revenue (billion) Forecast, by Application 2020 & 2033
- Table 32: Global UAE Flexible Office Industry Revenue billion Forecast, by Type 2020 & 2033
- Table 33: Global UAE Flexible Office Industry Revenue billion Forecast, by End Use 2020 & 2033
- Table 34: Global UAE Flexible Office Industry Revenue billion Forecast, by User 2020 & 2033
- Table 35: Global UAE Flexible Office Industry Revenue billion Forecast, by Country 2020 & 2033
- Table 36: Turkey UAE Flexible Office Industry Revenue (billion) Forecast, by Application 2020 & 2033
- Table 37: Israel UAE Flexible Office Industry Revenue (billion) Forecast, by Application 2020 & 2033
- Table 38: GCC UAE Flexible Office Industry Revenue (billion) Forecast, by Application 2020 & 2033
- Table 39: North Africa UAE Flexible Office Industry Revenue (billion) Forecast, by Application 2020 & 2033
- Table 40: South Africa UAE Flexible Office Industry Revenue (billion) Forecast, by Application 2020 & 2033
- Table 41: Rest of Middle East & Africa UAE Flexible Office Industry Revenue (billion) Forecast, by Application 2020 & 2033
- Table 42: Global UAE Flexible Office Industry Revenue billion Forecast, by Type 2020 & 2033
- Table 43: Global UAE Flexible Office Industry Revenue billion Forecast, by End Use 2020 & 2033
- Table 44: Global UAE Flexible Office Industry Revenue billion Forecast, by User 2020 & 2033
- Table 45: Global UAE Flexible Office Industry Revenue billion Forecast, by Country 2020 & 2033
- Table 46: China UAE Flexible Office Industry Revenue (billion) Forecast, by Application 2020 & 2033
- Table 47: India UAE Flexible Office Industry Revenue (billion) Forecast, by Application 2020 & 2033
- Table 48: Japan UAE Flexible Office Industry Revenue (billion) Forecast, by Application 2020 & 2033
- Table 49: South Korea UAE Flexible Office Industry Revenue (billion) Forecast, by Application 2020 & 2033
- Table 50: ASEAN UAE Flexible Office Industry Revenue (billion) Forecast, by Application 2020 & 2033
- Table 51: Oceania UAE Flexible Office Industry Revenue (billion) Forecast, by Application 2020 & 2033
- Table 52: Rest of Asia Pacific UAE Flexible Office Industry Revenue (billion) Forecast, by Application 2020 & 2033
Frequently Asked Questions
1. What is the projected Compound Annual Growth Rate (CAGR) of the UAE Flexible Office Industry?
The projected CAGR is approximately 9.16%.
2. Which companies are prominent players in the UAE Flexible Office Industry?
Key companies in the market include ServCorp, Letswork Inc, DTEC**List Not Exhaustive, Nasab, Nook, Astrolabs, Instant Group, WeWork Management LLC, WitWork, Regus Group.
3. What are the main segments of the UAE Flexible Office Industry?
The market segments include Type, End Use, User.
4. Can you provide details about the market size?
The market size is estimated to be USD 1.23 billion as of 2022.
5. What are some drivers contributing to market growth?
Increase in Oil and Gas Sector.
6. What are the notable trends driving market growth?
Increasing Demand for Commercial Working Space.
7. Are there any restraints impacting market growth?
Skills shortages..
8. Can you provide examples of recent developments in the market?
February 2022: Asset management firm Merex Investment has signed a commercial office lease agreement with Talabat, MENA's leading tech company, to set up its regional and UAE headquarters at City Walk, Dubai's centrally located design-inspired, mixed-use destination. Talabat's regional HQ will span almost 150,000 sq ft of premises, featuring a custom-built office environment that can cater to over 2,000 employees.
9. What pricing options are available for accessing the report?
Pricing options include single-user, multi-user, and enterprise licenses priced at USD 3800, USD 4500, and USD 5800 respectively.
10. Is the market size provided in terms of value or volume?
The market size is provided in terms of value, measured in billion.
11. Are there any specific market keywords associated with the report?
Yes, the market keyword associated with the report is "UAE Flexible Office Industry," which aids in identifying and referencing the specific market segment covered.
12. How do I determine which pricing option suits my needs best?
The pricing options vary based on user requirements and access needs. Individual users may opt for single-user licenses, while businesses requiring broader access may choose multi-user or enterprise licenses for cost-effective access to the report.
13. Are there any additional resources or data provided in the UAE Flexible Office Industry report?
While the report offers comprehensive insights, it's advisable to review the specific contents or supplementary materials provided to ascertain if additional resources or data are available.
14. How can I stay updated on further developments or reports in the UAE Flexible Office Industry?
To stay informed about further developments, trends, and reports in the UAE Flexible Office Industry, consider subscribing to industry newsletters, following relevant companies and organizations, or regularly checking reputable industry news sources and publications.
Methodology
Step 1 - Identification of Relevant Samples Size from Population Database


Step 2 - Approaches for Defining Global Market Size (Value, Volume* & Price*)

Note*: In applicable scenarios
Step 3 - Data Sources
Primary Research
- Web Analytics
- Survey Reports
- Research Institute
- Latest Research Reports
- Opinion Leaders
Secondary Research
- Annual Reports
- White Paper
- Latest Press Release
- Industry Association
- Paid Database
- Investor Presentations

Step 4 - Data Triangulation
Involves using different sources of information in order to increase the validity of a study
These sources are likely to be stakeholders in a program - participants, other researchers, program staff, other community members, and so on.
Then we put all data in single framework & apply various statistical tools to find out the dynamic on the market.
During the analysis stage, feedback from the stakeholder groups would be compared to determine areas of agreement as well as areas of divergence