

Key Insights
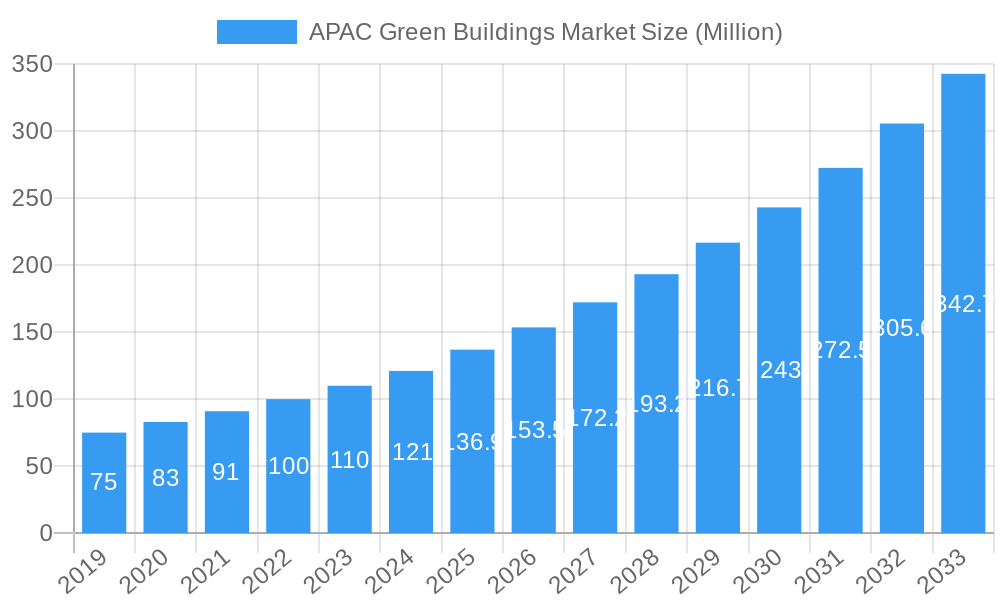
The APAC Green Buildings Market is poised for substantial expansion, projected to reach an estimated market size of $136.90 million by 2025, demonstrating a robust Compound Annual Growth Rate (CAGR) of 12.23% throughout the forecast period of 2025-2033. This significant growth is underpinned by an increasing global and regional emphasis on sustainability, driven by growing environmental awareness, stringent government regulations favoring eco-friendly construction, and a heightened demand for energy-efficient and healthy living and working spaces. The market's expansion is further fueled by technological advancements in building materials, smart building technologies, and renewable energy integration, all contributing to reduced operational costs and enhanced environmental performance. Key drivers include evolving consumer preferences for sustainable living, corporate social responsibility initiatives, and the economic benefits associated with green building certifications. The "Other Products" segment, encompassing innovative materials and technologies, is expected to witness particularly dynamic growth, alongside the core "Interior Products" and "Exterior Products" categories as demand for retrofitting and new sustainable constructions accelerates.
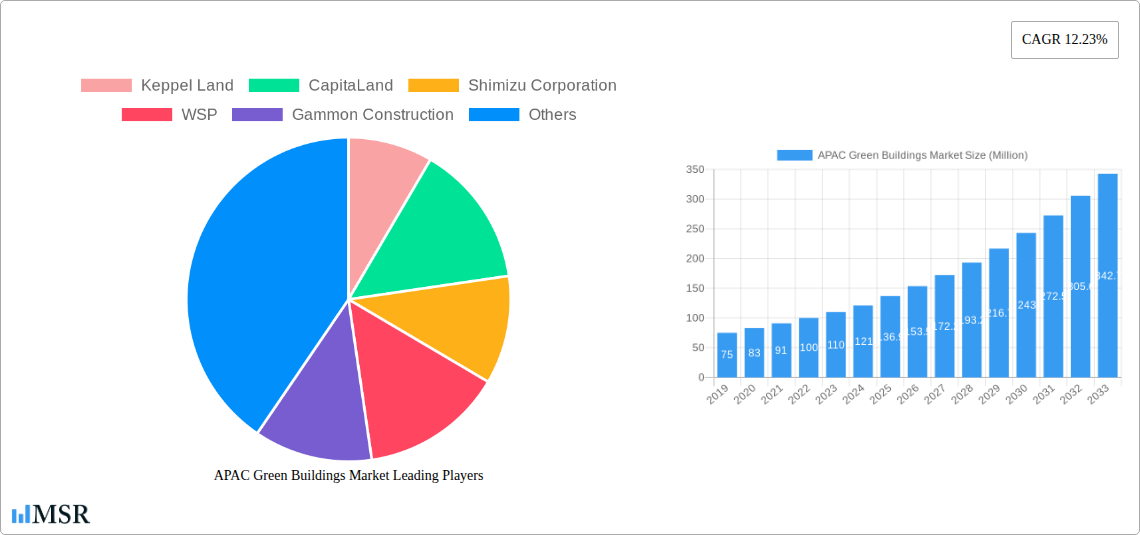
APAC Green Buildings Market Market Size (In Million)
The burgeoning demand for green building solutions is prominently observed across diverse end-user segments, with "Residential" and "Office" sectors leading the charge. The "Retail" and "Institutional" segments are also actively embracing sustainable practices to align with corporate goals and regulatory mandates. Geographically, China is expected to dominate the APAC Green Buildings Market, owing to its ambitious environmental targets and large-scale infrastructure development. India and South Korea are also anticipated to be significant growth contributors, driven by rapid urbanization and increasing adoption of green building standards. While the market benefits from strong growth drivers, potential restraints could include the initial higher upfront costs associated with some green building technologies and materials, as well as a need for greater skilled labor and awareness among construction professionals. However, the long-term operational cost savings, enhanced occupant well-being, and positive environmental impact are increasingly outweighing these initial considerations, positioning the APAC Green Buildings Market for sustained and significant growth.
APAC Green Buildings Market Company Market Share
APAC Green Buildings Market: Comprehensive Insights and Growth Forecast (2019-2033)
This in-depth report provides an exhaustive analysis of the APAC Green Buildings Market, offering critical insights into market dynamics, key trends, segment dominance, and future growth trajectories. Covering the study period from 2019 to 2033, with a base year of 2025, this report equips industry stakeholders with actionable intelligence for strategic decision-making. We delve into market concentration, innovation, regulatory frameworks, and end-user preferences across pivotal geographies including China, Japan, India, Australia, and South Korea, alongside the Rest of APAC. This report is your definitive guide to navigating the burgeoning sustainable construction landscape in Asia-Pacific, focusing on sustainable architecture, green construction, eco-friendly building materials, and energy-efficient buildings.
APAC Green Buildings Market Market Concentration & Dynamics
The APAC Green Buildings Market exhibits a moderate to high concentration, driven by the presence of established global players and ambitious regional developers. Innovation ecosystems are rapidly evolving, fueled by government incentives for net-zero buildings and a growing demand for LEED-certified and green building certifications. Regulatory frameworks are becoming increasingly stringent, pushing for higher energy efficiency standards and the adoption of sustainable construction practices. The threat of substitute products is relatively low as the inherent benefits of green building—cost savings, improved occupant health, and reduced environmental impact—outweigh traditional construction methods. End-user trends are witnessing a significant shift towards sustainability, with increasing demand from both corporate and residential sectors for healthy buildings and smart buildings. Merger and acquisition (M&A) activities are present, though more focused on strategic partnerships and technology acquisition rather than outright consolidation, reflecting a maturing market. Key players are actively investing in R&D to develop innovative green building solutions and expand their market share. The market share distribution is dynamic, with leaders continuously adapting to new technological advancements and policy changes.
APAC Green Buildings Market Industry Insights & Trends
The APAC Green Buildings Market is poised for significant expansion, projected to reach xx Million by 2033, exhibiting a robust Compound Annual Growth Rate (CAGR) of xx% during the forecast period. This growth is primarily propelled by escalating environmental consciousness, stringent government regulations mandating sustainable construction, and a growing awareness of the long-term economic benefits associated with energy-efficient buildings and sustainable infrastructure. Technological disruptions are playing a pivotal role, with advancements in building-integrated photovoltaics (BIPV), smart building management systems (BMS), and the increasing adoption of prefabricated construction and modular building techniques contributing to faster and more cost-effective sustainable development. Evolving consumer behaviors are a major catalyst; individuals and businesses alike are prioritizing healthy living spaces and environmentally responsible choices, driving demand for green residential buildings, eco-friendly office spaces, and sustainable retail environments. The rising demand for resource efficiency, including water conservation and waste reduction in construction, is further shaping market trends. The market is also witnessing a surge in demand for low-carbon building materials and recycled construction materials. The increasing adoption of circular economy principles in construction is a significant trend, minimizing waste and maximizing resource utilization.
Key Markets & Segments Leading APAC Green Buildings Market
The APAC Green Buildings Market is significantly influenced by regional economic growth, urbanization, and government initiatives promoting sustainable development.
Dominant Geography:
- China stands as a dominant force in the APAC green buildings market, driven by its ambitious national sustainability targets, massive infrastructure development, and supportive government policies aimed at reducing carbon emissions. The sheer scale of construction projects, coupled with a rapidly growing middle class demanding healthier living environments, positions China at the forefront.
- India is emerging as a key growth engine, fueled by rapid urbanization, a burgeoning economy, and increasing awareness of environmental issues. Government initiatives like the National Smart Cities Mission and a growing emphasis on energy efficiency in building codes are driving adoption.
- Japan continues to be a leader in sustainable innovation, with a mature market focused on energy conservation, disaster-resilient green buildings, and advanced green building technologies.
Dominant Segments:
- Product: Exterior Products
- Drivers: Increasing demand for high-performance insulation, energy-efficient windows and doors, and sustainable roofing materials to reduce operational energy consumption. The integration of solar panels and green facades for enhanced energy generation and aesthetic appeal.
- Dominance Analysis: Exterior products are critical for the initial performance and long-term energy efficiency of any green building. Innovations in materials that offer thermal resistance, durability, and aesthetic appeal are driving their dominance. The growing focus on building envelopes that minimize heat gain and loss directly translates to increased demand for these products.
- End User: Office
- Drivers: Corporate social responsibility (CSR) initiatives, desire for reduced operating costs through energy savings, and the need to attract and retain talent by providing healthy and productive work environments. Green office buildings are increasingly becoming a benchmark for corporate sustainability.
- Dominance Analysis: The commercial real estate sector, particularly office buildings, has been an early adopter of green building practices due to the significant return on investment through lower utility bills and enhanced employee well-being. The demand for modern, sustainable workspaces is a primary driver of growth in this segment.
- End User: Residential
- Drivers: Growing consumer awareness of health benefits, rising energy costs, and government incentives for sustainable housing. The increasing prevalence of net-zero homes and energy-efficient apartments catering to a conscious consumer base.
- Dominance Analysis: While the office segment may currently lead in terms of the total built area, the residential segment is experiencing rapid growth. The increasing adoption of green building standards for individual homes and apartment complexes, driven by both consumer demand and regulatory push, is a significant trend.
APAC Green Buildings Market Product Developments
Product innovation in the APAC Green Buildings Market is centered on enhancing energy efficiency, promoting occupant health, and reducing environmental impact. Advancements in low-embodied carbon materials, such as sustainable timber and advanced concrete formulations, are gaining traction. The integration of smart technologies for building management systems (BMS), including AI-powered energy optimization and predictive maintenance, is transforming how buildings operate. Furthermore, the development of high-performance insulation, advanced glazing solutions, and water-saving fixtures are key areas of innovation. The market is also witnessing a rise in the adoption of prefabricated and modular green building components to improve construction speed and reduce waste, offering a competitive edge in project delivery.
Challenges in the APAC Green Buildings Market Market
Despite the robust growth, the APAC Green Buildings Market faces several challenges. High upfront costs associated with green building materials and technologies can be a deterrent for some developers. A lack of widespread awareness and skilled labor for installing and maintaining sustainable systems also poses a significant barrier. Regulatory inconsistencies across different regions within APAC can create complexities for companies operating on a pan-Asian scale. Furthermore, the supply chain for specialized eco-friendly building products can be less developed in certain areas, leading to potential delays and increased costs. Competitive pressures from traditional construction methods, while diminishing, still exist, particularly in price-sensitive markets.
Forces Driving APAC Green Buildings Market Growth
Several key forces are propelling the APAC Green Buildings Market forward. Stringent government regulations and policies mandating higher energy efficiency standards and promoting sustainable construction practices are primary drivers. Growing environmental awareness among consumers and corporations, coupled with a rising demand for healthy buildings and eco-friendly living spaces, significantly influences purchasing decisions. Technological advancements in green building materials, energy-efficient systems, and smart building technologies are making sustainable construction more accessible and cost-effective. Economic benefits, such as reduced operational costs through energy and water savings, are also a strong incentive for developers and building owners to invest in green building solutions.
Challenges in the APAC Green Buildings Market Market
Long-term growth catalysts for the APAC Green Buildings Market lie in continuous innovation and market expansion. The development and widespread adoption of novel low-carbon building materials and circular economy principles in construction will be crucial for reducing the industry's environmental footprint. Strategic partnerships between technology providers, developers, and government bodies can accelerate the integration of advanced green building technologies. Furthermore, the expansion of green building initiatives into emerging economies within APAC, coupled with increased focus on retrofitting existing buildings to improve their sustainability credentials, presents significant long-term growth opportunities. Market education and capacity building for the workforce will also be vital for sustained growth.
Emerging Opportunities in APAC Green Buildings Market
Emerging opportunities in the APAC Green Buildings Market are diverse and promising. The increasing focus on resilient and climate-adaptive buildings in response to extreme weather events presents a significant avenue for growth. The demand for healthy indoor environments is also expanding, leading to opportunities in advanced air purification systems and bio-based materials. The growing popularity of urban farming and vertical gardens integrated into buildings offers new possibilities for sustainable design. Furthermore, the development of smart and connected green buildings that leverage IoT and AI for optimized performance and occupant experience is a key emerging trend. The retrofitting of existing building stock to meet higher sustainability standards also represents a substantial, largely untapped market.
Leading Players in the APAC Green Buildings Market Sector
- Keppel Land
- CapitaLand
- Shimizu Corporation
- WSP
- Gammon Construction
- Obayashi Corporation
- Sun Hung Kai Properties
- Lendlease
- Swire Properties
- Sino Group
- 7 3 Other Companie
Key Milestones in APAC Green Buildings Market Industry
- April 2023: Starbucks unveiled its first greener stores in Asia-Pacific, part of a global rollout aimed at achieving 10,000 greener stores worldwide by 2025. This initiative highlights the growing adoption of sustainability in commercial retail spaces and influences consumer perceptions.
- February 2023: GHD partnered with the GBCA as a Circular Economy and Green Building Day supporting partner for 2023, underscoring the increasing importance of circular economy principles in sustainable construction and the collaborative efforts to address environmental challenges.
Strategic Outlook for APAC Green Buildings Market Market
The strategic outlook for the APAC Green Buildings Market is exceptionally positive, driven by a confluence of regulatory support, technological innovation, and escalating demand for sustainable development. Future growth will be accelerated by the increasing integration of digital technologies, such as AI and IoT, for optimizing building performance and enhancing occupant experience. The continued focus on circular economy principles and the development of low-embodied carbon materials will be crucial for achieving true sustainability. Strategic investments in research and development for innovative green building solutions and the expansion into underserved markets within APAC will further solidify market leadership. The emphasis on retrofitting existing buildings to improve their energy efficiency and environmental performance presents a substantial long-term growth opportunity.
APAC Green Buildings Market Segmentation
-
1. Product
- 1.1. Exterior Products
- 1.2. Interior products
- 1.3. Other Pr
-
2. End User
- 2.1. Residential
- 2.2. Office
- 2.3. Retail
- 2.4. Institutional
- 2.5. Other End Users
-
3. Geography
- 3.1. China
- 3.2. Japan
- 3.3. India
- 3.4. Australia
- 3.5. South Korea
- 3.6. Rest of APAC
APAC Green Buildings Market Segmentation By Geography
- 1. China
- 2. Japan
- 3. India
- 4. Australia
- 5. South Korea
- 6. Rest of APAC
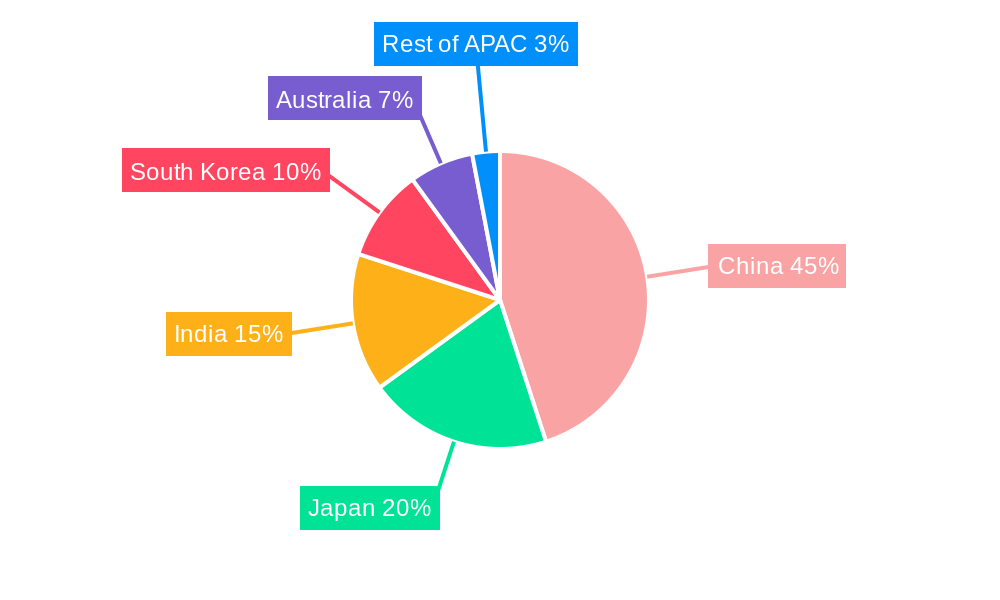
APAC Green Buildings Market Regional Market Share
Geographic Coverage of APAC Green Buildings Market
APAC Green Buildings Market REPORT HIGHLIGHTS
| Aspects | Details |
|---|---|
| Study Period | 2020-2034 |
| Base Year | 2025 |
| Estimated Year | 2026 |
| Forecast Period | 2026-2034 |
| Historical Period | 2020-2025 |
| Growth Rate | CAGR of 12.23% from 2020-2034 |
| Segmentation |
|
Table of Contents
- 1. Introduction
- 1.1. Research Scope
- 1.2. Market Segmentation
- 1.3. Research Objective
- 1.4. Definitions and Assumptions
- 2. Executive Summary
- 2.1. Market Snapshot
- 3. Market Dynamics
- 3.1. Market Drivers
- 3.2. Market Restrains
- 3.3. Market Trends
- 3.4. Market Opportunities
- 4. Market Factor Analysis
- 4.1. Porters Five Forces
- 4.1.1. Bargaining Power of Suppliers
- 4.1.2. Bargaining Power of Buyers
- 4.1.3. Threat of New Entrants
- 4.1.4. Threat of Substitutes
- 4.1.5. Competitive Rivalry
- 4.2. PESTEL analysis
- 4.3. BCG Analysis
- 4.3.1. Stars (High Growth, High Market Share)
- 4.3.2. Cash Cows (Low Growth, High Market Share)
- 4.3.3. Question Mark (High Growth, Low Market Share)
- 4.3.4. Dogs (Low Growth, Low Market Share)
- 4.4. Ansoff Matrix Analysis
- 4.5. Supply Chain Analysis
- 4.6. Regulatory Landscape
- 4.7. Current Market Potential and Opportunity Assessment (TAM–SAM–SOM Framework)
- 4.8. MSR Analyst Note
- 4.1. Porters Five Forces
- 5. Market Analysis, Insights and Forecast 2021-2033
- 5.1. Market Analysis, Insights and Forecast - by Product
- 5.1.1. Exterior Products
- 5.1.2. Interior products
- 5.1.3. Other Pr
- 5.2. Market Analysis, Insights and Forecast - by End User
- 5.2.1. Residential
- 5.2.2. Office
- 5.2.3. Retail
- 5.2.4. Institutional
- 5.2.5. Other End Users
- 5.3. Market Analysis, Insights and Forecast - by Geography
- 5.3.1. China
- 5.3.2. Japan
- 5.3.3. India
- 5.3.4. Australia
- 5.3.5. South Korea
- 5.3.6. Rest of APAC
- 5.4. Market Analysis, Insights and Forecast - by Region
- 5.4.1. China
- 5.4.2. Japan
- 5.4.3. India
- 5.4.4. Australia
- 5.4.5. South Korea
- 5.4.6. Rest of APAC
- 5.1. Market Analysis, Insights and Forecast - by Product
- 6. Global APAC Green Buildings Market Analysis, Insights and Forecast, 2021-2033
- 6.1. Market Analysis, Insights and Forecast - by Product
- 6.1.1. Exterior Products
- 6.1.2. Interior products
- 6.1.3. Other Pr
- 6.2. Market Analysis, Insights and Forecast - by End User
- 6.2.1. Residential
- 6.2.2. Office
- 6.2.3. Retail
- 6.2.4. Institutional
- 6.2.5. Other End Users
- 6.3. Market Analysis, Insights and Forecast - by Geography
- 6.3.1. China
- 6.3.2. Japan
- 6.3.3. India
- 6.3.4. Australia
- 6.3.5. South Korea
- 6.3.6. Rest of APAC
- 6.1. Market Analysis, Insights and Forecast - by Product
- 7. China APAC Green Buildings Market Analysis, Insights and Forecast, 2020-2032
- 7.1. Market Analysis, Insights and Forecast - by Product
- 7.1.1. Exterior Products
- 7.1.2. Interior products
- 7.1.3. Other Pr
- 7.2. Market Analysis, Insights and Forecast - by End User
- 7.2.1. Residential
- 7.2.2. Office
- 7.2.3. Retail
- 7.2.4. Institutional
- 7.2.5. Other End Users
- 7.3. Market Analysis, Insights and Forecast - by Geography
- 7.3.1. China
- 7.3.2. Japan
- 7.3.3. India
- 7.3.4. Australia
- 7.3.5. South Korea
- 7.3.6. Rest of APAC
- 7.1. Market Analysis, Insights and Forecast - by Product
- 8. Japan APAC Green Buildings Market Analysis, Insights and Forecast, 2020-2032
- 8.1. Market Analysis, Insights and Forecast - by Product
- 8.1.1. Exterior Products
- 8.1.2. Interior products
- 8.1.3. Other Pr
- 8.2. Market Analysis, Insights and Forecast - by End User
- 8.2.1. Residential
- 8.2.2. Office
- 8.2.3. Retail
- 8.2.4. Institutional
- 8.2.5. Other End Users
- 8.3. Market Analysis, Insights and Forecast - by Geography
- 8.3.1. China
- 8.3.2. Japan
- 8.3.3. India
- 8.3.4. Australia
- 8.3.5. South Korea
- 8.3.6. Rest of APAC
- 8.1. Market Analysis, Insights and Forecast - by Product
- 9. India APAC Green Buildings Market Analysis, Insights and Forecast, 2020-2032
- 9.1. Market Analysis, Insights and Forecast - by Product
- 9.1.1. Exterior Products
- 9.1.2. Interior products
- 9.1.3. Other Pr
- 9.2. Market Analysis, Insights and Forecast - by End User
- 9.2.1. Residential
- 9.2.2. Office
- 9.2.3. Retail
- 9.2.4. Institutional
- 9.2.5. Other End Users
- 9.3. Market Analysis, Insights and Forecast - by Geography
- 9.3.1. China
- 9.3.2. Japan
- 9.3.3. India
- 9.3.4. Australia
- 9.3.5. South Korea
- 9.3.6. Rest of APAC
- 9.1. Market Analysis, Insights and Forecast - by Product
- 10. Australia APAC Green Buildings Market Analysis, Insights and Forecast, 2020-2032
- 10.1. Market Analysis, Insights and Forecast - by Product
- 10.1.1. Exterior Products
- 10.1.2. Interior products
- 10.1.3. Other Pr
- 10.2. Market Analysis, Insights and Forecast - by End User
- 10.2.1. Residential
- 10.2.2. Office
- 10.2.3. Retail
- 10.2.4. Institutional
- 10.2.5. Other End Users
- 10.3. Market Analysis, Insights and Forecast - by Geography
- 10.3.1. China
- 10.3.2. Japan
- 10.3.3. India
- 10.3.4. Australia
- 10.3.5. South Korea
- 10.3.6. Rest of APAC
- 10.1. Market Analysis, Insights and Forecast - by Product
- 11. South Korea APAC Green Buildings Market Analysis, Insights and Forecast, 2020-2032
- 11.1. Market Analysis, Insights and Forecast - by Product
- 11.1.1. Exterior Products
- 11.1.2. Interior products
- 11.1.3. Other Pr
- 11.2. Market Analysis, Insights and Forecast - by End User
- 11.2.1. Residential
- 11.2.2. Office
- 11.2.3. Retail
- 11.2.4. Institutional
- 11.2.5. Other End Users
- 11.3. Market Analysis, Insights and Forecast - by Geography
- 11.3.1. China
- 11.3.2. Japan
- 11.3.3. India
- 11.3.4. Australia
- 11.3.5. South Korea
- 11.3.6. Rest of APAC
- 11.1. Market Analysis, Insights and Forecast - by Product
- 12. Rest of APAC APAC Green Buildings Market Analysis, Insights and Forecast, 2020-2032
- 12.1. Market Analysis, Insights and Forecast - by Product
- 12.1.1. Exterior Products
- 12.1.2. Interior products
- 12.1.3. Other Pr
- 12.2. Market Analysis, Insights and Forecast - by End User
- 12.2.1. Residential
- 12.2.2. Office
- 12.2.3. Retail
- 12.2.4. Institutional
- 12.2.5. Other End Users
- 12.3. Market Analysis, Insights and Forecast - by Geography
- 12.3.1. China
- 12.3.2. Japan
- 12.3.3. India
- 12.3.4. Australia
- 12.3.5. South Korea
- 12.3.6. Rest of APAC
- 12.1. Market Analysis, Insights and Forecast - by Product
- 13. Competitive Analysis
- 13.1. Company Profiles
- 13.1.1 Keppel Land
- 13.1.1.1. Company Overview
- 13.1.1.2. Products
- 13.1.1.3. Company Financials
- 13.1.1.4. SWOT Analysis
- 13.1.2 CapitaLand
- 13.1.2.1. Company Overview
- 13.1.2.2. Products
- 13.1.2.3. Company Financials
- 13.1.2.4. SWOT Analysis
- 13.1.3 Shimizu Corporation
- 13.1.3.1. Company Overview
- 13.1.3.2. Products
- 13.1.3.3. Company Financials
- 13.1.3.4. SWOT Analysis
- 13.1.4 WSP
- 13.1.4.1. Company Overview
- 13.1.4.2. Products
- 13.1.4.3. Company Financials
- 13.1.4.4. SWOT Analysis
- 13.1.5 Gammon Construction
- 13.1.5.1. Company Overview
- 13.1.5.2. Products
- 13.1.5.3. Company Financials
- 13.1.5.4. SWOT Analysis
- 13.1.6 Obayashi Corporation
- 13.1.6.1. Company Overview
- 13.1.6.2. Products
- 13.1.6.3. Company Financials
- 13.1.6.4. SWOT Analysis
- 13.1.7 Sun Hung Kai Properties**List Not Exhaustive 7 3 Other Companie
- 13.1.7.1. Company Overview
- 13.1.7.2. Products
- 13.1.7.3. Company Financials
- 13.1.7.4. SWOT Analysis
- 13.1.8 Lendlease
- 13.1.8.1. Company Overview
- 13.1.8.2. Products
- 13.1.8.3. Company Financials
- 13.1.8.4. SWOT Analysis
- 13.1.9 Swire Properties
- 13.1.9.1. Company Overview
- 13.1.9.2. Products
- 13.1.9.3. Company Financials
- 13.1.9.4. SWOT Analysis
- 13.1.10 Sino Group
- 13.1.10.1. Company Overview
- 13.1.10.2. Products
- 13.1.10.3. Company Financials
- 13.1.10.4. SWOT Analysis
- 13.1.1 Keppel Land
- 13.2. Market Entropy
- 13.2.1 Company's Key Areas Served
- 13.2.2 Recent Developments
- 13.3. Company Market Share Analysis 2025
- 13.3.1 Top 5 Companies Market Share Analysis
- 13.3.2 Top 3 Companies Market Share Analysis
- 13.4. List of Potential Customers
- 14. Research Methodology
List of Figures
- Figure 1: Global APAC Green Buildings Market Revenue Breakdown (Million, %) by Region 2025 & 2033
- Figure 2: China APAC Green Buildings Market Revenue (Million), by Product 2025 & 2033
- Figure 3: China APAC Green Buildings Market Revenue Share (%), by Product 2025 & 2033
- Figure 4: China APAC Green Buildings Market Revenue (Million), by End User 2025 & 2033
- Figure 5: China APAC Green Buildings Market Revenue Share (%), by End User 2025 & 2033
- Figure 6: China APAC Green Buildings Market Revenue (Million), by Geography 2025 & 2033
- Figure 7: China APAC Green Buildings Market Revenue Share (%), by Geography 2025 & 2033
- Figure 8: China APAC Green Buildings Market Revenue (Million), by Country 2025 & 2033
- Figure 9: China APAC Green Buildings Market Revenue Share (%), by Country 2025 & 2033
- Figure 10: Japan APAC Green Buildings Market Revenue (Million), by Product 2025 & 2033
- Figure 11: Japan APAC Green Buildings Market Revenue Share (%), by Product 2025 & 2033
- Figure 12: Japan APAC Green Buildings Market Revenue (Million), by End User 2025 & 2033
- Figure 13: Japan APAC Green Buildings Market Revenue Share (%), by End User 2025 & 2033
- Figure 14: Japan APAC Green Buildings Market Revenue (Million), by Geography 2025 & 2033
- Figure 15: Japan APAC Green Buildings Market Revenue Share (%), by Geography 2025 & 2033
- Figure 16: Japan APAC Green Buildings Market Revenue (Million), by Country 2025 & 2033
- Figure 17: Japan APAC Green Buildings Market Revenue Share (%), by Country 2025 & 2033
- Figure 18: India APAC Green Buildings Market Revenue (Million), by Product 2025 & 2033
- Figure 19: India APAC Green Buildings Market Revenue Share (%), by Product 2025 & 2033
- Figure 20: India APAC Green Buildings Market Revenue (Million), by End User 2025 & 2033
- Figure 21: India APAC Green Buildings Market Revenue Share (%), by End User 2025 & 2033
- Figure 22: India APAC Green Buildings Market Revenue (Million), by Geography 2025 & 2033
- Figure 23: India APAC Green Buildings Market Revenue Share (%), by Geography 2025 & 2033
- Figure 24: India APAC Green Buildings Market Revenue (Million), by Country 2025 & 2033
- Figure 25: India APAC Green Buildings Market Revenue Share (%), by Country 2025 & 2033
- Figure 26: Australia APAC Green Buildings Market Revenue (Million), by Product 2025 & 2033
- Figure 27: Australia APAC Green Buildings Market Revenue Share (%), by Product 2025 & 2033
- Figure 28: Australia APAC Green Buildings Market Revenue (Million), by End User 2025 & 2033
- Figure 29: Australia APAC Green Buildings Market Revenue Share (%), by End User 2025 & 2033
- Figure 30: Australia APAC Green Buildings Market Revenue (Million), by Geography 2025 & 2033
- Figure 31: Australia APAC Green Buildings Market Revenue Share (%), by Geography 2025 & 2033
- Figure 32: Australia APAC Green Buildings Market Revenue (Million), by Country 2025 & 2033
- Figure 33: Australia APAC Green Buildings Market Revenue Share (%), by Country 2025 & 2033
- Figure 34: South Korea APAC Green Buildings Market Revenue (Million), by Product 2025 & 2033
- Figure 35: South Korea APAC Green Buildings Market Revenue Share (%), by Product 2025 & 2033
- Figure 36: South Korea APAC Green Buildings Market Revenue (Million), by End User 2025 & 2033
- Figure 37: South Korea APAC Green Buildings Market Revenue Share (%), by End User 2025 & 2033
- Figure 38: South Korea APAC Green Buildings Market Revenue (Million), by Geography 2025 & 2033
- Figure 39: South Korea APAC Green Buildings Market Revenue Share (%), by Geography 2025 & 2033
- Figure 40: South Korea APAC Green Buildings Market Revenue (Million), by Country 2025 & 2033
- Figure 41: South Korea APAC Green Buildings Market Revenue Share (%), by Country 2025 & 2033
- Figure 42: Rest of APAC APAC Green Buildings Market Revenue (Million), by Product 2025 & 2033
- Figure 43: Rest of APAC APAC Green Buildings Market Revenue Share (%), by Product 2025 & 2033
- Figure 44: Rest of APAC APAC Green Buildings Market Revenue (Million), by End User 2025 & 2033
- Figure 45: Rest of APAC APAC Green Buildings Market Revenue Share (%), by End User 2025 & 2033
- Figure 46: Rest of APAC APAC Green Buildings Market Revenue (Million), by Geography 2025 & 2033
- Figure 47: Rest of APAC APAC Green Buildings Market Revenue Share (%), by Geography 2025 & 2033
- Figure 48: Rest of APAC APAC Green Buildings Market Revenue (Million), by Country 2025 & 2033
- Figure 49: Rest of APAC APAC Green Buildings Market Revenue Share (%), by Country 2025 & 2033
List of Tables
- Table 1: Global APAC Green Buildings Market Revenue Million Forecast, by Product 2020 & 2033
- Table 2: Global APAC Green Buildings Market Revenue Million Forecast, by End User 2020 & 2033
- Table 3: Global APAC Green Buildings Market Revenue Million Forecast, by Geography 2020 & 2033
- Table 4: Global APAC Green Buildings Market Revenue Million Forecast, by Region 2020 & 2033
- Table 5: Global APAC Green Buildings Market Revenue Million Forecast, by Product 2020 & 2033
- Table 6: Global APAC Green Buildings Market Revenue Million Forecast, by End User 2020 & 2033
- Table 7: Global APAC Green Buildings Market Revenue Million Forecast, by Geography 2020 & 2033
- Table 8: Global APAC Green Buildings Market Revenue Million Forecast, by Country 2020 & 2033
- Table 9: Global APAC Green Buildings Market Revenue Million Forecast, by Product 2020 & 2033
- Table 10: Global APAC Green Buildings Market Revenue Million Forecast, by End User 2020 & 2033
- Table 11: Global APAC Green Buildings Market Revenue Million Forecast, by Geography 2020 & 2033
- Table 12: Global APAC Green Buildings Market Revenue Million Forecast, by Country 2020 & 2033
- Table 13: Global APAC Green Buildings Market Revenue Million Forecast, by Product 2020 & 2033
- Table 14: Global APAC Green Buildings Market Revenue Million Forecast, by End User 2020 & 2033
- Table 15: Global APAC Green Buildings Market Revenue Million Forecast, by Geography 2020 & 2033
- Table 16: Global APAC Green Buildings Market Revenue Million Forecast, by Country 2020 & 2033
- Table 17: Global APAC Green Buildings Market Revenue Million Forecast, by Product 2020 & 2033
- Table 18: Global APAC Green Buildings Market Revenue Million Forecast, by End User 2020 & 2033
- Table 19: Global APAC Green Buildings Market Revenue Million Forecast, by Geography 2020 & 2033
- Table 20: Global APAC Green Buildings Market Revenue Million Forecast, by Country 2020 & 2033
- Table 21: Global APAC Green Buildings Market Revenue Million Forecast, by Product 2020 & 2033
- Table 22: Global APAC Green Buildings Market Revenue Million Forecast, by End User 2020 & 2033
- Table 23: Global APAC Green Buildings Market Revenue Million Forecast, by Geography 2020 & 2033
- Table 24: Global APAC Green Buildings Market Revenue Million Forecast, by Country 2020 & 2033
- Table 25: Global APAC Green Buildings Market Revenue Million Forecast, by Product 2020 & 2033
- Table 26: Global APAC Green Buildings Market Revenue Million Forecast, by End User 2020 & 2033
- Table 27: Global APAC Green Buildings Market Revenue Million Forecast, by Geography 2020 & 2033
- Table 28: Global APAC Green Buildings Market Revenue Million Forecast, by Country 2020 & 2033
Frequently Asked Questions
1. What is the projected Compound Annual Growth Rate (CAGR) of the APAC Green Buildings Market?
The projected CAGR is approximately 12.23%.
2. Which companies are prominent players in the APAC Green Buildings Market?
Key companies in the market include Keppel Land, CapitaLand, Shimizu Corporation, WSP, Gammon Construction, Obayashi Corporation, Sun Hung Kai Properties**List Not Exhaustive 7 3 Other Companie, Lendlease, Swire Properties, Sino Group.
3. What are the main segments of the APAC Green Buildings Market?
The market segments include Product, End User, Geography.
4. Can you provide details about the market size?
The market size is estimated to be USD 136.90 Million as of 2022.
5. What are some drivers contributing to market growth?
Energy Efficiency in Construction Driving the Market; Flexibility and Customization Options Driving the Market.
6. What are the notable trends driving market growth?
The Commercial Segment’s Increasing Demand for Green Buildings.
7. Are there any restraints impacting market growth?
Limited Availability of Suitable Land for Construction Hindering the Market; Lower Quality Compared to Traditional Construction.
8. Can you provide examples of recent developments in the market?
April 2023: The world’s largest coffee company, Starbucks, has unveiled its first greener stores in Asia-Pacific as a part of a global rollout of its greener store framework that has grown to more than 3,500 locations across 20 markets. The five new greener stores, located in Singapore (Singapore), Thailand (Thailand), and Vietnam (Vietnam), are among the first in Starbucks Asia-Pacific region. More than 20 other Starbucks stores are expected to receive greener store certifications later this year. With this latest round of certifications, Starbucks is well on track to reaching its goal of having 10,000 greener stores worldwide by 2025.
9. What pricing options are available for accessing the report?
Pricing options include single-user, multi-user, and enterprise licenses priced at USD 4750, USD 5250, and USD 8750 respectively.
10. Is the market size provided in terms of value or volume?
The market size is provided in terms of value, measured in Million.
11. Are there any specific market keywords associated with the report?
Yes, the market keyword associated with the report is "APAC Green Buildings Market," which aids in identifying and referencing the specific market segment covered.
12. How do I determine which pricing option suits my needs best?
The pricing options vary based on user requirements and access needs. Individual users may opt for single-user licenses, while businesses requiring broader access may choose multi-user or enterprise licenses for cost-effective access to the report.
13. Are there any additional resources or data provided in the APAC Green Buildings Market report?
While the report offers comprehensive insights, it's advisable to review the specific contents or supplementary materials provided to ascertain if additional resources or data are available.
14. How can I stay updated on further developments or reports in the APAC Green Buildings Market?
To stay informed about further developments, trends, and reports in the APAC Green Buildings Market, consider subscribing to industry newsletters, following relevant companies and organizations, or regularly checking reputable industry news sources and publications.
Methodology
Step 1 - Identification of Relevant Samples Size from Population Database


Step 2 - Approaches for Defining Global Market Size (Value, Volume* & Price*)

Note*: In applicable scenarios
Step 3 - Data Sources
Primary Research
- Web Analytics
- Survey Reports
- Research Institute
- Latest Research Reports
- Opinion Leaders
Secondary Research
- Annual Reports
- White Paper
- Latest Press Release
- Industry Association
- Paid Database
- Investor Presentations

Step 4 - Data Triangulation
Involves using different sources of information in order to increase the validity of a study
These sources are likely to be stakeholders in a program - participants, other researchers, program staff, other community members, and so on.
Then we put all data in single framework & apply various statistical tools to find out the dynamic on the market.
During the analysis stage, feedback from the stakeholder groups would be compared to determine areas of agreement as well as areas of divergence