

Key Insights
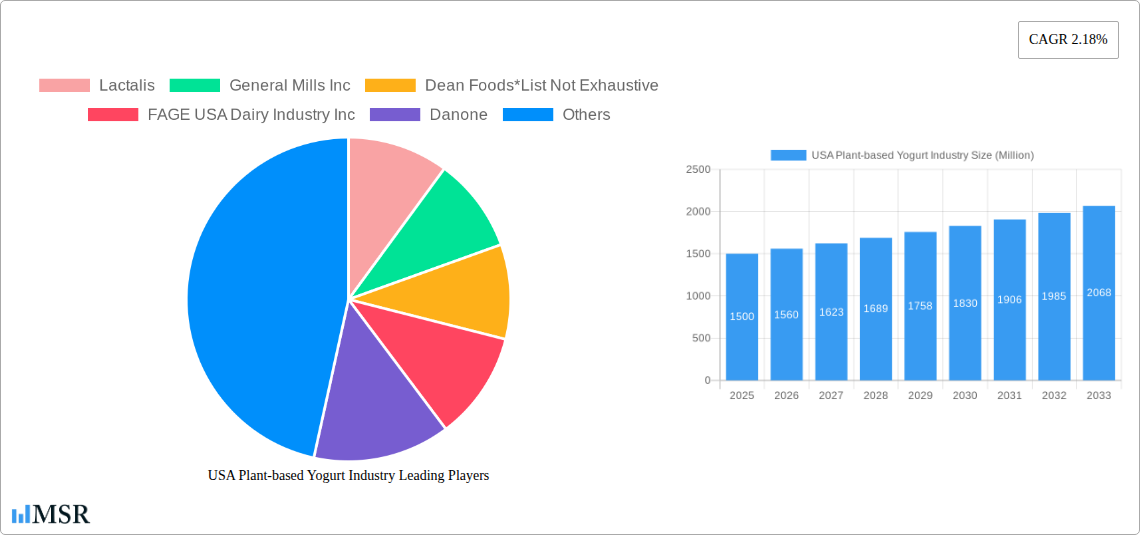
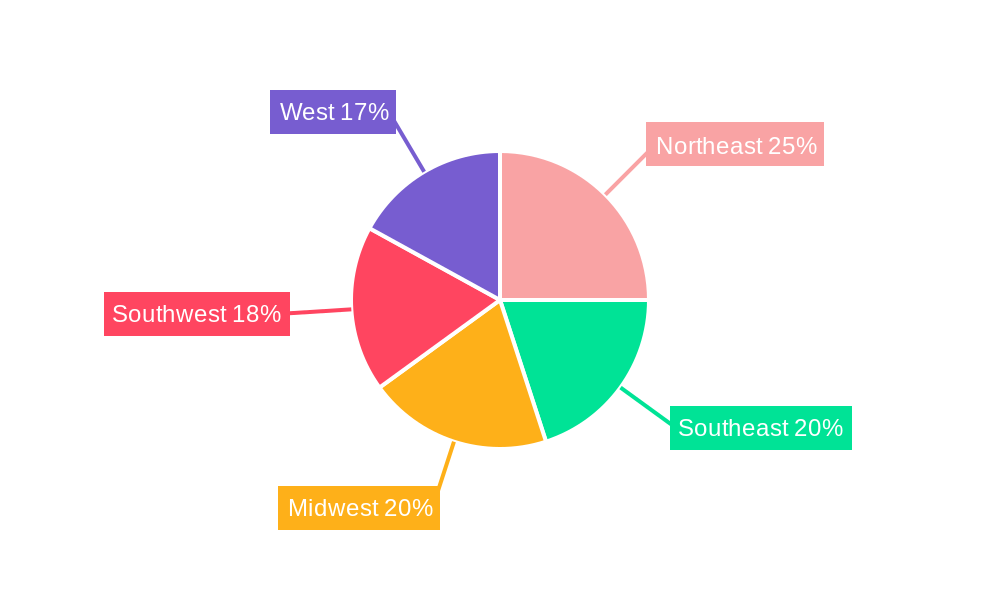
The US plant-based yogurt market, a segment within the broader yogurt industry, exhibits robust growth potential. While the overall yogurt market shows a CAGR of 2.18%, the plant-based segment is expected to significantly outperform this figure, driven by increasing consumer demand for healthier, ethical, and environmentally sustainable food options. The rising awareness of the health benefits associated with plant-based diets, including reduced cholesterol and improved gut health, is a key driver. Furthermore, the growing prevalence of lactose intolerance and allergies fuels the shift towards dairy-free alternatives. Trends such as the incorporation of functional ingredients (probiotics, superfoods) and innovative flavor profiles cater to evolving consumer preferences, enhancing market appeal. While competition from established dairy yogurt brands remains a challenge, the plant-based segment benefits from strong consumer interest in novelty and unique product offerings. Distribution channels are expanding beyond traditional supermarkets and hypermarkets, with convenience stores and online retail playing an increasingly important role in reaching a wider consumer base. The market segmentation (by category, product type, and distribution channel) indicates opportunities for targeted marketing and product development strategies. The geographical distribution across the US (Northeast, Southeast, Midwest, Southwest, West) presents regional variations in consumer preferences and market penetration rates. However, national marketing campaigns coupled with regional product adaptations can effectively capture market share.
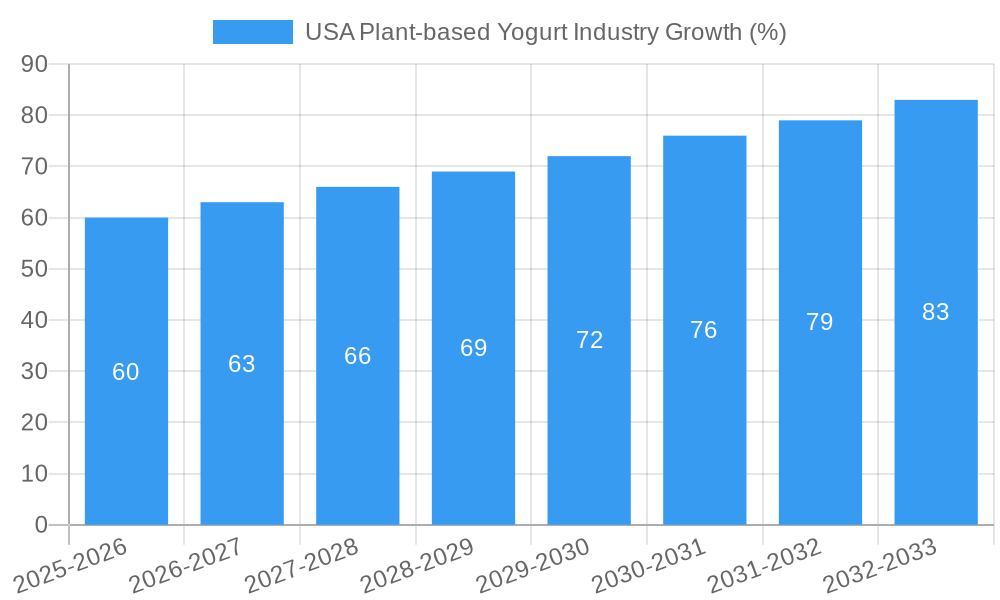
The forecast period of 2025-2033 suggests a period of sustained growth, with projections indicating a higher CAGR for the plant-based segment compared to the overall yogurt market. This growth will be influenced by factors including successful product innovation, effective marketing strategies, and continued consumer adoption of plant-based lifestyles. Companies such as Chobani and others are already significant players, demonstrating the industry’s attractiveness and competitive landscape. Analyzing regional data allows for the development of tailored strategies that optimize product offerings and marketing efforts to reach specific consumer segments across various US regions. The key to success lies in understanding consumer needs and preferences within this dynamic market segment.
USA Plant-Based Yogurt Industry: A Comprehensive Market Report (2019-2033)
This comprehensive report provides an in-depth analysis of the USA plant-based yogurt industry, offering valuable insights for industry stakeholders, investors, and businesses seeking to navigate this dynamic market. With a study period spanning 2019-2033, a base year of 2025, and a forecast period of 2025-2033, this report delivers a holistic view of past performance, current trends, and future projections. The report covers market size (in Millions), segmentation, key players, competitive landscape, and emerging opportunities, providing actionable intelligence to inform strategic decision-making.
USA Plant-based Yogurt Industry Market Concentration & Dynamics
The USA plant-based yogurt market exhibits a moderately concentrated landscape, with key players like Lactalis, General Mills Inc, Danone, Chobani LLC, and others holding significant market share. The market's dynamics are shaped by several factors:
- Market Concentration: The top 5 players account for approximately xx% of the market share in 2025, indicating a moderately concentrated market. However, the presence of numerous smaller players and emerging brands creates a competitive landscape.
- Innovation Ecosystems: Significant investments in research and development are driving innovation in areas like new flavors, functional ingredients (probiotics, prebiotics), and sustainable packaging.
- Regulatory Frameworks: FDA regulations regarding labeling, food safety, and health claims influence product development and marketing strategies.
- Substitute Products: Competition comes from other dairy and non-dairy alternatives, including almond milk, soy milk, and other plant-based yogurt alternatives.
- End-User Trends: Growing consumer demand for healthier, convenient, and ethically sourced products is driving market growth. The rise of veganism and flexitarianism is particularly impacting the demand for non-dairy yogurt.
- M&A Activities: The number of mergers and acquisitions in the plant-based yogurt sector has been xx in the period 2019-2024, indicating a trend of consolidation and expansion by major players.
USA Plant-based Yogurt Industry Industry Insights & Trends
The USA plant-based yogurt market is experiencing robust growth, driven by several factors. The market size reached approximately $xx Million in 2024 and is projected to reach $xx Million by 2033, exhibiting a CAGR of xx% during the forecast period (2025-2033). This growth is fueled by:
- Health and Wellness: Increasing consumer awareness of the health benefits of yogurt, including probiotics and gut health, fuels demand.
- Veganism and Vegetarianism: The rising adoption of plant-based diets significantly contributes to the growth of non-dairy yogurt.
- Convenience and On-the-Go Consumption: The availability of single-serve cups and convenient packaging enhances consumption patterns.
- Product Innovation: Continuous innovation in flavors, textures, and functional ingredients keeps the market dynamic and appealing.
- Technological Advancements: Advancements in fermentation technology improve the quality and taste of plant-based yogurts.
- Changing Consumer Preferences: Consumers are increasingly seeking healthier and more sustainable food options, boosting the plant-based yogurt market.
Key Markets & Segments Leading USA Plant-based Yogurt Industry
The key segments driving growth within the USA plant-based yogurt industry are:
- By Category: Non-dairy yogurt is experiencing faster growth compared to dairy-based yogurt, reflecting the growing popularity of plant-based alternatives.
- By Product Type: Flavored yogurt commands a larger market share than plain yogurt due to its appeal to a broader range of consumers.
- By Distribution Channel: Supermarkets/hypermarkets remain the dominant distribution channel, followed by convenience stores and online retail, which is witnessing significant growth.
Drivers:
- Economic Growth: Rising disposable incomes support higher spending on premium and convenient food products.
- Infrastructure Development: Improved cold chain logistics supports the wider distribution of perishable products like yogurt.
USA Plant-based Yogurt Industry Product Developments
Recent product developments focus on enhancing flavor profiles, incorporating functional ingredients like probiotics and prebiotics, and utilizing sustainable packaging materials. These advancements aim to cater to evolving consumer preferences for healthier, more convenient, and environmentally friendly options, boosting the competitive edge of various brands. Technological advancements in fermentation processes continue to improve the texture, taste, and nutritional content of plant-based yogurt.
Challenges in the USA Plant-based Yogurt Industry Market
The USA plant-based yogurt industry faces several challenges:
- High Raw Material Costs: Fluctuations in the prices of plant-based ingredients impact profitability.
- Intense Competition: The presence of numerous established and emerging brands creates fierce competition.
- Shelf-Life Limitations: Maintaining the quality and freshness of yogurt, particularly non-dairy options, presents logistical challenges.
Forces Driving USA Plant-based Yogurt Industry Growth
Key drivers of market growth include:
- Technological advancements in plant-based protein extraction and fermentation improve product quality and reduce costs.
- Growing consumer awareness of the health benefits of probiotics and gut health boosts demand.
- Favorable regulatory environment in many countries supports the growth of the plant-based food industry.
Long-Term Growth Catalysts in the USA Plant-based Yogurt Industry
Long-term growth will be driven by continued innovation in product development, strategic partnerships to expand distribution, and expansion into new markets both domestically and internationally. The focus on sustainable practices and addressing environmental concerns will also play a crucial role.
Emerging Opportunities in USA Plant-based Yogurt Industry
Emerging opportunities lie in:
- Development of novel flavors and textures.
- Incorporating functional ingredients like adaptogens and superfoods to meet evolving consumer preferences.
- Expanding into new distribution channels like online retailers and meal kit services.
Leading Players in the USA Plant-based Yogurt Industry Sector
- Lactalis
- General Mills Inc
- Dean Foods
- FAGE USA Dairy Industry Inc
- Danone
- Anderson Erickson Dairy
- Dairy Farmers of America Inc
- Chobani LLC
- Tillamook County Creamery Association
- Hain Celestial Group
Key Milestones in USA Plant-based Yogurt Industry Industry
- June 2022: HI-CHEW partners with Menchie's for a limited-edition flavor, expanding product offerings and driving consumer interest.
- June 2022: Yogurtland introduces new summer flavors and an online-exclusive cup, demonstrating innovative distribution strategies.
- June 2022: Danone launches Activia+ Multi-Benefit Probiotic Yogurt Drinks, highlighting the trend toward functional foods.
Strategic Outlook for USA Plant-based Yogurt Industry Market
The USA plant-based yogurt market presents significant growth potential driven by increasing consumer demand for healthy and convenient alternatives. Strategic opportunities include focusing on product innovation, expanding distribution channels, and building strong brands that resonate with health-conscious consumers. Companies that effectively leverage these opportunities will be best positioned to capitalize on the market's long-term growth.
USA Plant-based Yogurt Industry Segmentation
-
1. Category
- 1.1. Dairy-Based Yogurt
- 1.2. Non-dairy Yogurt
-
2. Product Type
- 2.1. Plain Yogurt
- 2.2. Flavored Yogurt
-
3. Distribution Channel
- 3.1. Supermarkets/Hypermarkets
- 3.2. Convenience Stores
- 3.3. Specialty Stores
- 3.4. Online Retail
- 3.5. Other Channels
USA Plant-based Yogurt Industry Segmentation By Geography
-
1. North America
- 1.1. United States
- 1.2. Canada
- 1.3. Mexico
-
2. South America
- 2.1. Brazil
- 2.2. Argentina
- 2.3. Rest of South America
-
3. Europe
- 3.1. United Kingdom
- 3.2. Germany
- 3.3. France
- 3.4. Italy
- 3.5. Spain
- 3.6. Russia
- 3.7. Benelux
- 3.8. Nordics
- 3.9. Rest of Europe
-
4. Middle East & Africa
- 4.1. Turkey
- 4.2. Israel
- 4.3. GCC
- 4.4. North Africa
- 4.5. South Africa
- 4.6. Rest of Middle East & Africa
-
5. Asia Pacific
- 5.1. China
- 5.2. India
- 5.3. Japan
- 5.4. South Korea
- 5.5. ASEAN
- 5.6. Oceania
- 5.7. Rest of Asia Pacific
USA Plant-based Yogurt Industry REPORT HIGHLIGHTS
| Aspects | Details |
|---|---|
| Study Period | 2019-2033 |
| Base Year | 2024 |
| Estimated Year | 2025 |
| Forecast Period | 2025-2033 |
| Historical Period | 2019-2024 |
| Growth Rate | CAGR of 2.18% from 2019-2033 |
| Segmentation |
|
Table of Contents
- 1. Introduction
- 1.1. Research Scope
- 1.2. Market Segmentation
- 1.3. Research Methodology
- 1.4. Definitions and Assumptions
- 2. Executive Summary
- 2.1. Introduction
- 3. Market Dynamics
- 3.1. Introduction
- 3.2. Market Drivers
- 3.2.1. Increasing Health Concerns are Supporting the Market's Growth; Growing Consumer Preference for Convenience Seafood
- 3.3. Market Restrains
- 3.3.1. Rising Concern About Quality and Safety Standards of Canned Tuna
- 3.4. Market Trends
- 3.4.1. Growing Digestive Heath Concerns Heating up Demand for Probiotic Products
- 4. Market Factor Analysis
- 4.1. Porters Five Forces
- 4.2. Supply/Value Chain
- 4.3. PESTEL analysis
- 4.4. Market Entropy
- 4.5. Patent/Trademark Analysis
- 5. Global USA Plant-based Yogurt Industry Analysis, Insights and Forecast, 2019-2031
- 5.1. Market Analysis, Insights and Forecast - by Category
- 5.1.1. Dairy-Based Yogurt
- 5.1.2. Non-dairy Yogurt
- 5.2. Market Analysis, Insights and Forecast - by Product Type
- 5.2.1. Plain Yogurt
- 5.2.2. Flavored Yogurt
- 5.3. Market Analysis, Insights and Forecast - by Distribution Channel
- 5.3.1. Supermarkets/Hypermarkets
- 5.3.2. Convenience Stores
- 5.3.3. Specialty Stores
- 5.3.4. Online Retail
- 5.3.5. Other Channels
- 5.4. Market Analysis, Insights and Forecast - by Region
- 5.4.1. North America
- 5.4.2. South America
- 5.4.3. Europe
- 5.4.4. Middle East & Africa
- 5.4.5. Asia Pacific
- 5.1. Market Analysis, Insights and Forecast - by Category
- 6. North America USA Plant-based Yogurt Industry Analysis, Insights and Forecast, 2019-2031
- 6.1. Market Analysis, Insights and Forecast - by Category
- 6.1.1. Dairy-Based Yogurt
- 6.1.2. Non-dairy Yogurt
- 6.2. Market Analysis, Insights and Forecast - by Product Type
- 6.2.1. Plain Yogurt
- 6.2.2. Flavored Yogurt
- 6.3. Market Analysis, Insights and Forecast - by Distribution Channel
- 6.3.1. Supermarkets/Hypermarkets
- 6.3.2. Convenience Stores
- 6.3.3. Specialty Stores
- 6.3.4. Online Retail
- 6.3.5. Other Channels
- 6.1. Market Analysis, Insights and Forecast - by Category
- 7. South America USA Plant-based Yogurt Industry Analysis, Insights and Forecast, 2019-2031
- 7.1. Market Analysis, Insights and Forecast - by Category
- 7.1.1. Dairy-Based Yogurt
- 7.1.2. Non-dairy Yogurt
- 7.2. Market Analysis, Insights and Forecast - by Product Type
- 7.2.1. Plain Yogurt
- 7.2.2. Flavored Yogurt
- 7.3. Market Analysis, Insights and Forecast - by Distribution Channel
- 7.3.1. Supermarkets/Hypermarkets
- 7.3.2. Convenience Stores
- 7.3.3. Specialty Stores
- 7.3.4. Online Retail
- 7.3.5. Other Channels
- 7.1. Market Analysis, Insights and Forecast - by Category
- 8. Europe USA Plant-based Yogurt Industry Analysis, Insights and Forecast, 2019-2031
- 8.1. Market Analysis, Insights and Forecast - by Category
- 8.1.1. Dairy-Based Yogurt
- 8.1.2. Non-dairy Yogurt
- 8.2. Market Analysis, Insights and Forecast - by Product Type
- 8.2.1. Plain Yogurt
- 8.2.2. Flavored Yogurt
- 8.3. Market Analysis, Insights and Forecast - by Distribution Channel
- 8.3.1. Supermarkets/Hypermarkets
- 8.3.2. Convenience Stores
- 8.3.3. Specialty Stores
- 8.3.4. Online Retail
- 8.3.5. Other Channels
- 8.1. Market Analysis, Insights and Forecast - by Category
- 9. Middle East & Africa USA Plant-based Yogurt Industry Analysis, Insights and Forecast, 2019-2031
- 9.1. Market Analysis, Insights and Forecast - by Category
- 9.1.1. Dairy-Based Yogurt
- 9.1.2. Non-dairy Yogurt
- 9.2. Market Analysis, Insights and Forecast - by Product Type
- 9.2.1. Plain Yogurt
- 9.2.2. Flavored Yogurt
- 9.3. Market Analysis, Insights and Forecast - by Distribution Channel
- 9.3.1. Supermarkets/Hypermarkets
- 9.3.2. Convenience Stores
- 9.3.3. Specialty Stores
- 9.3.4. Online Retail
- 9.3.5. Other Channels
- 9.1. Market Analysis, Insights and Forecast - by Category
- 10. Asia Pacific USA Plant-based Yogurt Industry Analysis, Insights and Forecast, 2019-2031
- 10.1. Market Analysis, Insights and Forecast - by Category
- 10.1.1. Dairy-Based Yogurt
- 10.1.2. Non-dairy Yogurt
- 10.2. Market Analysis, Insights and Forecast - by Product Type
- 10.2.1. Plain Yogurt
- 10.2.2. Flavored Yogurt
- 10.3. Market Analysis, Insights and Forecast - by Distribution Channel
- 10.3.1. Supermarkets/Hypermarkets
- 10.3.2. Convenience Stores
- 10.3.3. Specialty Stores
- 10.3.4. Online Retail
- 10.3.5. Other Channels
- 10.1. Market Analysis, Insights and Forecast - by Category
- 11. Northeast USA Plant-based Yogurt Industry Analysis, Insights and Forecast, 2019-2031
- 12. Southeast USA Plant-based Yogurt Industry Analysis, Insights and Forecast, 2019-2031
- 13. Midwest USA Plant-based Yogurt Industry Analysis, Insights and Forecast, 2019-2031
- 14. Southwest USA Plant-based Yogurt Industry Analysis, Insights and Forecast, 2019-2031
- 15. West USA Plant-based Yogurt Industry Analysis, Insights and Forecast, 2019-2031
- 16. Competitive Analysis
- 16.1. Global Market Share Analysis 2024
- 16.2. Company Profiles
- 16.2.1 Lactalis
- 16.2.1.1. Overview
- 16.2.1.2. Products
- 16.2.1.3. SWOT Analysis
- 16.2.1.4. Recent Developments
- 16.2.1.5. Financials (Based on Availability)
- 16.2.2 General Mills Inc
- 16.2.2.1. Overview
- 16.2.2.2. Products
- 16.2.2.3. SWOT Analysis
- 16.2.2.4. Recent Developments
- 16.2.2.5. Financials (Based on Availability)
- 16.2.3 Dean Foods*List Not Exhaustive
- 16.2.3.1. Overview
- 16.2.3.2. Products
- 16.2.3.3. SWOT Analysis
- 16.2.3.4. Recent Developments
- 16.2.3.5. Financials (Based on Availability)
- 16.2.4 FAGE USA Dairy Industry Inc
- 16.2.4.1. Overview
- 16.2.4.2. Products
- 16.2.4.3. SWOT Analysis
- 16.2.4.4. Recent Developments
- 16.2.4.5. Financials (Based on Availability)
- 16.2.5 Danone
- 16.2.5.1. Overview
- 16.2.5.2. Products
- 16.2.5.3. SWOT Analysis
- 16.2.5.4. Recent Developments
- 16.2.5.5. Financials (Based on Availability)
- 16.2.6 Anderson Erickson Dairy
- 16.2.6.1. Overview
- 16.2.6.2. Products
- 16.2.6.3. SWOT Analysis
- 16.2.6.4. Recent Developments
- 16.2.6.5. Financials (Based on Availability)
- 16.2.7 Dairy Farmers of America Inc
- 16.2.7.1. Overview
- 16.2.7.2. Products
- 16.2.7.3. SWOT Analysis
- 16.2.7.4. Recent Developments
- 16.2.7.5. Financials (Based on Availability)
- 16.2.8 Chobani LLC
- 16.2.8.1. Overview
- 16.2.8.2. Products
- 16.2.8.3. SWOT Analysis
- 16.2.8.4. Recent Developments
- 16.2.8.5. Financials (Based on Availability)
- 16.2.9 Tillamook County Creamery Association
- 16.2.9.1. Overview
- 16.2.9.2. Products
- 16.2.9.3. SWOT Analysis
- 16.2.9.4. Recent Developments
- 16.2.9.5. Financials (Based on Availability)
- 16.2.10 Hain Celestial Group
- 16.2.10.1. Overview
- 16.2.10.2. Products
- 16.2.10.3. SWOT Analysis
- 16.2.10.4. Recent Developments
- 16.2.10.5. Financials (Based on Availability)
- 16.2.1 Lactalis
List of Figures
- Figure 1: Global USA Plant-based Yogurt Industry Revenue Breakdown (Million, %) by Region 2024 & 2032
- Figure 2: United states USA Plant-based Yogurt Industry Revenue (Million), by Country 2024 & 2032
- Figure 3: United states USA Plant-based Yogurt Industry Revenue Share (%), by Country 2024 & 2032
- Figure 4: North America USA Plant-based Yogurt Industry Revenue (Million), by Category 2024 & 2032
- Figure 5: North America USA Plant-based Yogurt Industry Revenue Share (%), by Category 2024 & 2032
- Figure 6: North America USA Plant-based Yogurt Industry Revenue (Million), by Product Type 2024 & 2032
- Figure 7: North America USA Plant-based Yogurt Industry Revenue Share (%), by Product Type 2024 & 2032
- Figure 8: North America USA Plant-based Yogurt Industry Revenue (Million), by Distribution Channel 2024 & 2032
- Figure 9: North America USA Plant-based Yogurt Industry Revenue Share (%), by Distribution Channel 2024 & 2032
- Figure 10: North America USA Plant-based Yogurt Industry Revenue (Million), by Country 2024 & 2032
- Figure 11: North America USA Plant-based Yogurt Industry Revenue Share (%), by Country 2024 & 2032
- Figure 12: South America USA Plant-based Yogurt Industry Revenue (Million), by Category 2024 & 2032
- Figure 13: South America USA Plant-based Yogurt Industry Revenue Share (%), by Category 2024 & 2032
- Figure 14: South America USA Plant-based Yogurt Industry Revenue (Million), by Product Type 2024 & 2032
- Figure 15: South America USA Plant-based Yogurt Industry Revenue Share (%), by Product Type 2024 & 2032
- Figure 16: South America USA Plant-based Yogurt Industry Revenue (Million), by Distribution Channel 2024 & 2032
- Figure 17: South America USA Plant-based Yogurt Industry Revenue Share (%), by Distribution Channel 2024 & 2032
- Figure 18: South America USA Plant-based Yogurt Industry Revenue (Million), by Country 2024 & 2032
- Figure 19: South America USA Plant-based Yogurt Industry Revenue Share (%), by Country 2024 & 2032
- Figure 20: Europe USA Plant-based Yogurt Industry Revenue (Million), by Category 2024 & 2032
- Figure 21: Europe USA Plant-based Yogurt Industry Revenue Share (%), by Category 2024 & 2032
- Figure 22: Europe USA Plant-based Yogurt Industry Revenue (Million), by Product Type 2024 & 2032
- Figure 23: Europe USA Plant-based Yogurt Industry Revenue Share (%), by Product Type 2024 & 2032
- Figure 24: Europe USA Plant-based Yogurt Industry Revenue (Million), by Distribution Channel 2024 & 2032
- Figure 25: Europe USA Plant-based Yogurt Industry Revenue Share (%), by Distribution Channel 2024 & 2032
- Figure 26: Europe USA Plant-based Yogurt Industry Revenue (Million), by Country 2024 & 2032
- Figure 27: Europe USA Plant-based Yogurt Industry Revenue Share (%), by Country 2024 & 2032
- Figure 28: Middle East & Africa USA Plant-based Yogurt Industry Revenue (Million), by Category 2024 & 2032
- Figure 29: Middle East & Africa USA Plant-based Yogurt Industry Revenue Share (%), by Category 2024 & 2032
- Figure 30: Middle East & Africa USA Plant-based Yogurt Industry Revenue (Million), by Product Type 2024 & 2032
- Figure 31: Middle East & Africa USA Plant-based Yogurt Industry Revenue Share (%), by Product Type 2024 & 2032
- Figure 32: Middle East & Africa USA Plant-based Yogurt Industry Revenue (Million), by Distribution Channel 2024 & 2032
- Figure 33: Middle East & Africa USA Plant-based Yogurt Industry Revenue Share (%), by Distribution Channel 2024 & 2032
- Figure 34: Middle East & Africa USA Plant-based Yogurt Industry Revenue (Million), by Country 2024 & 2032
- Figure 35: Middle East & Africa USA Plant-based Yogurt Industry Revenue Share (%), by Country 2024 & 2032
- Figure 36: Asia Pacific USA Plant-based Yogurt Industry Revenue (Million), by Category 2024 & 2032
- Figure 37: Asia Pacific USA Plant-based Yogurt Industry Revenue Share (%), by Category 2024 & 2032
- Figure 38: Asia Pacific USA Plant-based Yogurt Industry Revenue (Million), by Product Type 2024 & 2032
- Figure 39: Asia Pacific USA Plant-based Yogurt Industry Revenue Share (%), by Product Type 2024 & 2032
- Figure 40: Asia Pacific USA Plant-based Yogurt Industry Revenue (Million), by Distribution Channel 2024 & 2032
- Figure 41: Asia Pacific USA Plant-based Yogurt Industry Revenue Share (%), by Distribution Channel 2024 & 2032
- Figure 42: Asia Pacific USA Plant-based Yogurt Industry Revenue (Million), by Country 2024 & 2032
- Figure 43: Asia Pacific USA Plant-based Yogurt Industry Revenue Share (%), by Country 2024 & 2032
List of Tables
- Table 1: Global USA Plant-based Yogurt Industry Revenue Million Forecast, by Region 2019 & 2032
- Table 2: Global USA Plant-based Yogurt Industry Revenue Million Forecast, by Category 2019 & 2032
- Table 3: Global USA Plant-based Yogurt Industry Revenue Million Forecast, by Product Type 2019 & 2032
- Table 4: Global USA Plant-based Yogurt Industry Revenue Million Forecast, by Distribution Channel 2019 & 2032
- Table 5: Global USA Plant-based Yogurt Industry Revenue Million Forecast, by Region 2019 & 2032
- Table 6: Global USA Plant-based Yogurt Industry Revenue Million Forecast, by Country 2019 & 2032
- Table 7: Northeast USA Plant-based Yogurt Industry Revenue (Million) Forecast, by Application 2019 & 2032
- Table 8: Southeast USA Plant-based Yogurt Industry Revenue (Million) Forecast, by Application 2019 & 2032
- Table 9: Midwest USA Plant-based Yogurt Industry Revenue (Million) Forecast, by Application 2019 & 2032
- Table 10: Southwest USA Plant-based Yogurt Industry Revenue (Million) Forecast, by Application 2019 & 2032
- Table 11: West USA Plant-based Yogurt Industry Revenue (Million) Forecast, by Application 2019 & 2032
- Table 12: Global USA Plant-based Yogurt Industry Revenue Million Forecast, by Category 2019 & 2032
- Table 13: Global USA Plant-based Yogurt Industry Revenue Million Forecast, by Product Type 2019 & 2032
- Table 14: Global USA Plant-based Yogurt Industry Revenue Million Forecast, by Distribution Channel 2019 & 2032
- Table 15: Global USA Plant-based Yogurt Industry Revenue Million Forecast, by Country 2019 & 2032
- Table 16: United States USA Plant-based Yogurt Industry Revenue (Million) Forecast, by Application 2019 & 2032
- Table 17: Canada USA Plant-based Yogurt Industry Revenue (Million) Forecast, by Application 2019 & 2032
- Table 18: Mexico USA Plant-based Yogurt Industry Revenue (Million) Forecast, by Application 2019 & 2032
- Table 19: Global USA Plant-based Yogurt Industry Revenue Million Forecast, by Category 2019 & 2032
- Table 20: Global USA Plant-based Yogurt Industry Revenue Million Forecast, by Product Type 2019 & 2032
- Table 21: Global USA Plant-based Yogurt Industry Revenue Million Forecast, by Distribution Channel 2019 & 2032
- Table 22: Global USA Plant-based Yogurt Industry Revenue Million Forecast, by Country 2019 & 2032
- Table 23: Brazil USA Plant-based Yogurt Industry Revenue (Million) Forecast, by Application 2019 & 2032
- Table 24: Argentina USA Plant-based Yogurt Industry Revenue (Million) Forecast, by Application 2019 & 2032
- Table 25: Rest of South America USA Plant-based Yogurt Industry Revenue (Million) Forecast, by Application 2019 & 2032
- Table 26: Global USA Plant-based Yogurt Industry Revenue Million Forecast, by Category 2019 & 2032
- Table 27: Global USA Plant-based Yogurt Industry Revenue Million Forecast, by Product Type 2019 & 2032
- Table 28: Global USA Plant-based Yogurt Industry Revenue Million Forecast, by Distribution Channel 2019 & 2032
- Table 29: Global USA Plant-based Yogurt Industry Revenue Million Forecast, by Country 2019 & 2032
- Table 30: United Kingdom USA Plant-based Yogurt Industry Revenue (Million) Forecast, by Application 2019 & 2032
- Table 31: Germany USA Plant-based Yogurt Industry Revenue (Million) Forecast, by Application 2019 & 2032
- Table 32: France USA Plant-based Yogurt Industry Revenue (Million) Forecast, by Application 2019 & 2032
- Table 33: Italy USA Plant-based Yogurt Industry Revenue (Million) Forecast, by Application 2019 & 2032
- Table 34: Spain USA Plant-based Yogurt Industry Revenue (Million) Forecast, by Application 2019 & 2032
- Table 35: Russia USA Plant-based Yogurt Industry Revenue (Million) Forecast, by Application 2019 & 2032
- Table 36: Benelux USA Plant-based Yogurt Industry Revenue (Million) Forecast, by Application 2019 & 2032
- Table 37: Nordics USA Plant-based Yogurt Industry Revenue (Million) Forecast, by Application 2019 & 2032
- Table 38: Rest of Europe USA Plant-based Yogurt Industry Revenue (Million) Forecast, by Application 2019 & 2032
- Table 39: Global USA Plant-based Yogurt Industry Revenue Million Forecast, by Category 2019 & 2032
- Table 40: Global USA Plant-based Yogurt Industry Revenue Million Forecast, by Product Type 2019 & 2032
- Table 41: Global USA Plant-based Yogurt Industry Revenue Million Forecast, by Distribution Channel 2019 & 2032
- Table 42: Global USA Plant-based Yogurt Industry Revenue Million Forecast, by Country 2019 & 2032
- Table 43: Turkey USA Plant-based Yogurt Industry Revenue (Million) Forecast, by Application 2019 & 2032
- Table 44: Israel USA Plant-based Yogurt Industry Revenue (Million) Forecast, by Application 2019 & 2032
- Table 45: GCC USA Plant-based Yogurt Industry Revenue (Million) Forecast, by Application 2019 & 2032
- Table 46: North Africa USA Plant-based Yogurt Industry Revenue (Million) Forecast, by Application 2019 & 2032
- Table 47: South Africa USA Plant-based Yogurt Industry Revenue (Million) Forecast, by Application 2019 & 2032
- Table 48: Rest of Middle East & Africa USA Plant-based Yogurt Industry Revenue (Million) Forecast, by Application 2019 & 2032
- Table 49: Global USA Plant-based Yogurt Industry Revenue Million Forecast, by Category 2019 & 2032
- Table 50: Global USA Plant-based Yogurt Industry Revenue Million Forecast, by Product Type 2019 & 2032
- Table 51: Global USA Plant-based Yogurt Industry Revenue Million Forecast, by Distribution Channel 2019 & 2032
- Table 52: Global USA Plant-based Yogurt Industry Revenue Million Forecast, by Country 2019 & 2032
- Table 53: China USA Plant-based Yogurt Industry Revenue (Million) Forecast, by Application 2019 & 2032
- Table 54: India USA Plant-based Yogurt Industry Revenue (Million) Forecast, by Application 2019 & 2032
- Table 55: Japan USA Plant-based Yogurt Industry Revenue (Million) Forecast, by Application 2019 & 2032
- Table 56: South Korea USA Plant-based Yogurt Industry Revenue (Million) Forecast, by Application 2019 & 2032
- Table 57: ASEAN USA Plant-based Yogurt Industry Revenue (Million) Forecast, by Application 2019 & 2032
- Table 58: Oceania USA Plant-based Yogurt Industry Revenue (Million) Forecast, by Application 2019 & 2032
- Table 59: Rest of Asia Pacific USA Plant-based Yogurt Industry Revenue (Million) Forecast, by Application 2019 & 2032
Frequently Asked Questions
1. What is the projected Compound Annual Growth Rate (CAGR) of the USA Plant-based Yogurt Industry?
The projected CAGR is approximately 2.18%.
2. Which companies are prominent players in the USA Plant-based Yogurt Industry?
Key companies in the market include Lactalis, General Mills Inc, Dean Foods*List Not Exhaustive, FAGE USA Dairy Industry Inc, Danone, Anderson Erickson Dairy, Dairy Farmers of America Inc, Chobani LLC, Tillamook County Creamery Association, Hain Celestial Group.
3. What are the main segments of the USA Plant-based Yogurt Industry?
The market segments include Category, Product Type, Distribution Channel.
4. Can you provide details about the market size?
The market size is estimated to be USD XX Million as of 2022.
5. What are some drivers contributing to market growth?
Increasing Health Concerns are Supporting the Market's Growth; Growing Consumer Preference for Convenience Seafood.
6. What are the notable trends driving market growth?
Growing Digestive Heath Concerns Heating up Demand for Probiotic Products.
7. Are there any restraints impacting market growth?
Rising Concern About Quality and Safety Standards of Canned Tuna.
8. Can you provide examples of recent developments in the market?
In June 2022, The chewy candy company HI-CHEW partnered with Menchie's Frozen Yogurt in North America to launch a limited edition HI-CHEWTM Rainbow Sherbet Flavor frozen yogurt.
9. What pricing options are available for accessing the report?
Pricing options include single-user, multi-user, and enterprise licenses priced at USD 3800, USD 4500, and USD 5800 respectively.
10. Is the market size provided in terms of value or volume?
The market size is provided in terms of value, measured in Million.
11. Are there any specific market keywords associated with the report?
Yes, the market keyword associated with the report is "USA Plant-based Yogurt Industry," which aids in identifying and referencing the specific market segment covered.
12. How do I determine which pricing option suits my needs best?
The pricing options vary based on user requirements and access needs. Individual users may opt for single-user licenses, while businesses requiring broader access may choose multi-user or enterprise licenses for cost-effective access to the report.
13. Are there any additional resources or data provided in the USA Plant-based Yogurt Industry report?
While the report offers comprehensive insights, it's advisable to review the specific contents or supplementary materials provided to ascertain if additional resources or data are available.
14. How can I stay updated on further developments or reports in the USA Plant-based Yogurt Industry?
To stay informed about further developments, trends, and reports in the USA Plant-based Yogurt Industry, consider subscribing to industry newsletters, following relevant companies and organizations, or regularly checking reputable industry news sources and publications.
Methodology
Step 1 - Identification of Relevant Samples Size from Population Database


Step 2 - Approaches for Defining Global Market Size (Value, Volume* & Price*)

Note*: In applicable scenarios
Step 3 - Data Sources
Primary Research
- Web Analytics
- Survey Reports
- Research Institute
- Latest Research Reports
- Opinion Leaders
Secondary Research
- Annual Reports
- White Paper
- Latest Press Release
- Industry Association
- Paid Database
- Investor Presentations

Step 4 - Data Triangulation
Involves using different sources of information in order to increase the validity of a study
These sources are likely to be stakeholders in a program - participants, other researchers, program staff, other community members, and so on.
Then we put all data in single framework & apply various statistical tools to find out the dynamic on the market.
During the analysis stage, feedback from the stakeholder groups would be compared to determine areas of agreement as well as areas of divergence
