

Key Insights
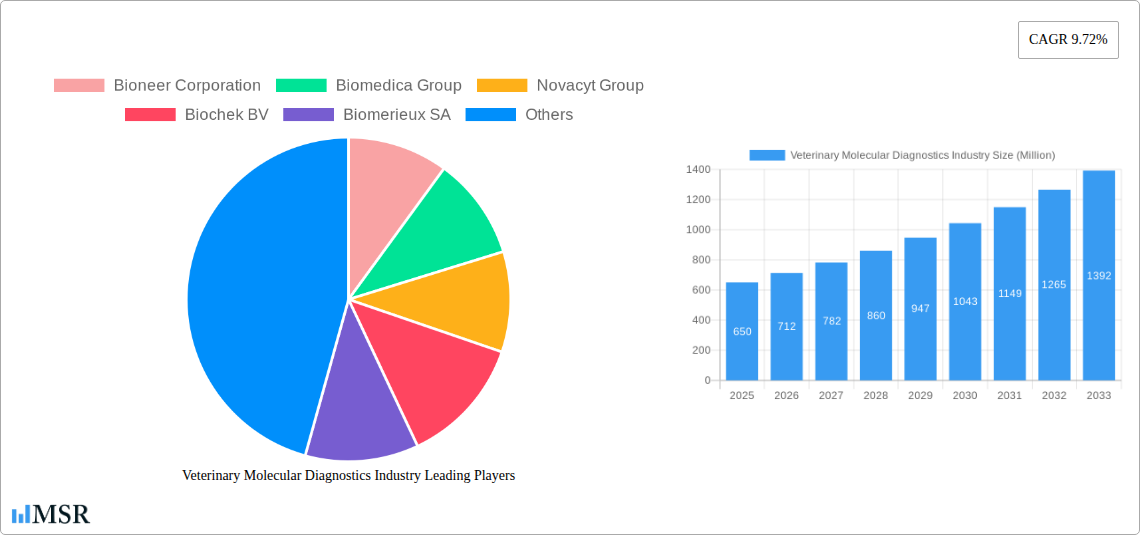
The veterinary molecular diagnostics market, valued at $0.65 billion in 2025, is projected to experience robust growth, driven by factors such as the increasing prevalence of infectious diseases in animals, rising pet ownership globally, and the growing demand for rapid and accurate diagnostic tools. Technological advancements in PCR, microarray, and DNA sequencing are further fueling market expansion. The market is segmented by product (instruments, kits & reagents, software & services), application (infectious diseases, genetics, other applications), and technology. Kits and reagents currently dominate the product segment due to their widespread use in various diagnostic procedures. Infectious diseases, particularly those with zoonotic potential (transmissible to humans), represent a significant application area, driving demand for sensitive and specific diagnostic tests. North America and Europe currently hold the largest market shares, attributed to advanced healthcare infrastructure and high veterinary spending. However, the Asia-Pacific region is expected to exhibit substantial growth, fueled by rising pet ownership and increasing veterinary awareness. The market's growth is, however, subject to restraints such as high costs associated with advanced technologies and the need for skilled professionals to operate sophisticated equipment.
The forecast period (2025-2033) anticipates a consistent CAGR of 9.72%, indicating a substantial market expansion. This growth trajectory will likely be influenced by continuous technological innovation leading to more accessible and affordable diagnostic solutions. Furthermore, increasing government initiatives promoting animal health and disease surveillance are expected to contribute to market growth. Competition among key players such as Bioneer Corporation, Biomerieux SA, and QIAGEN N V is driving innovation and market penetration. Companies are focusing on developing comprehensive diagnostic solutions integrating various technologies and catering to the evolving needs of veterinary professionals. This includes expansion into new geographical regions and strategic partnerships to enhance market reach and product offerings.
Veterinary Molecular Diagnostics Market Report: 2019-2033
This comprehensive report provides a detailed analysis of the Veterinary Molecular Diagnostics industry, offering invaluable insights for stakeholders, investors, and industry professionals. With a study period spanning 2019-2033, a base year of 2025, and a forecast period of 2025-2033, this report leverages extensive data analysis and expert insights to provide a clear picture of the current market landscape and future growth trajectory. The global market size is estimated at xx Million in 2025 and is projected to reach xx Million by 2033, exhibiting a CAGR of xx%.
Veterinary Molecular Diagnostics Industry Market Concentration & Dynamics
The veterinary molecular diagnostics market exhibits a moderately concentrated structure, with key players like IDEXX Laboratories Inc., Thermo Fisher Scientific Inc., and QIAGEN N.V. holding significant market share. However, the presence of numerous smaller companies and emerging players fosters a dynamic competitive landscape. Innovation is driven by advancements in PCR, microarray, and DNA sequencing technologies, constantly enhancing diagnostic capabilities. Regulatory frameworks vary across geographies, influencing market access and product approvals. Substitute products, such as traditional serological tests, still hold relevance in certain segments, but the increasing accuracy and speed of molecular diagnostics are driving market share shifts. End-user trends indicate a growing preference for rapid, accurate, and cost-effective diagnostic solutions, pushing the demand for advanced molecular diagnostic technologies. M&A activity has been significant, with xx M&A deals recorded between 2019 and 2024, signifying consolidation and expansion within the sector. For example, the acquisition of AusDiagnostics by R-Biopharm AG in 2022 expanded the market leader's product portfolio significantly. The market share of the top 5 players is estimated to be xx% in 2025.
Veterinary Molecular Diagnostics Industry Industry Insights & Trends
The veterinary molecular diagnostics market is witnessing robust growth propelled by several factors. Increasing prevalence of zoonotic diseases and the need for rapid and accurate disease detection are major drivers. The rising pet ownership globally coupled with increased awareness of animal health significantly boosts demand. Technological advancements, particularly in PCR, next-generation sequencing (NGS), and microarrays, are leading to more sensitive, specific, and high-throughput diagnostic tests. The development of point-of-care testing (POCT) devices further enhances accessibility and speed of diagnosis. Evolving consumer behavior showcases a willingness to invest in advanced diagnostics for improved animal care, fueled by higher disposable incomes in several regions. The market size is projected to grow at a CAGR of xx% during the forecast period, driven by these positive trends. Government initiatives promoting animal health and disease surveillance further contribute to market growth.

Key Markets & Segments Leading Veterinary Molecular Diagnostics Industry
The North American region currently dominates the veterinary molecular diagnostics market, driven by strong economic growth, advanced healthcare infrastructure, and high pet ownership rates. Within this region, the United States holds the largest market share. However, other regions, like Europe and Asia-Pacific, are experiencing rapid growth.
- By Product: The Kit and Reagents segment currently holds the largest share, benefiting from the widespread adoption of PCR-based assays and other molecular diagnostic techniques. However, the Instruments segment is anticipated to witness significant growth in the coming years, driven by increasing demand for automated and high-throughput systems. The Software and Services segment is also growing due to the increasing need for data analysis and interpretation.
- By Application: Infectious Diseases diagnostics dominate the market, reflecting the high prevalence of various animal pathogens. However, the Genetics segment is projected to witness substantial growth due to the expanding use of genetic testing for breed identification, parentage verification, and genomic selection in animal breeding programs.
- By Technology: PCR technology currently holds the largest market share, owing to its versatility, sensitivity, and relatively low cost. However, DNA sequencing and microarray technologies are increasingly adopted for specific applications, such as complex genetic analysis and high-throughput screening.
Drivers:
- Strong economic growth in developed countries.
- Increasing pet ownership and spending on pet care.
- Rising prevalence of zoonotic diseases.
- Government funding and initiatives to support animal health research and surveillance.
- Investments in veterinary research and development.
Veterinary Molecular Diagnostics Industry Product Developments
Recent product innovations focus on improved diagnostic speed, accuracy, and automation. Point-of-care testing devices are gaining traction, enabling rapid on-site diagnostics. Advancements in multiplex PCR and NGS technologies allow simultaneous detection of multiple pathogens, enhancing efficiency. Software solutions for data management and analysis improve diagnostic workflow and interpretation. These advancements provide competitive edges by offering superior diagnostic capabilities, faster turnaround times, and improved cost-effectiveness.
Challenges in the Veterinary Molecular Diagnostics Industry Market
The veterinary molecular diagnostics market faces challenges such as stringent regulatory approvals, especially for novel technologies. Supply chain disruptions can affect the availability of critical reagents and instruments. Intense competition from established and emerging players requires continuous innovation to maintain a competitive edge. The high cost of some advanced technologies can limit market penetration, particularly in developing countries. These factors combined are estimated to impact market growth by approximately xx Million by 2030.
Forces Driving Veterinary Molecular Diagnostics Industry Growth
Technological advancements (e.g., the development of faster and more accurate PCR tests, microarrays, and NGS), economic growth leading to increased spending on animal health, and supportive regulatory frameworks (e.g., increased funding for animal health research) are key drivers of market expansion.
Long-Term Growth Catalysts in the Veterinary Molecular Diagnostics Industry
Continued technological innovation, strategic partnerships between diagnostic companies and veterinary clinics, and expansion into emerging markets will propel long-term growth. The development of personalized medicine approaches in veterinary care will further drive demand for advanced molecular diagnostic tools.
Emerging Opportunities in Veterinary Molecular Diagnostics Industry
Emerging opportunities include the development of rapid diagnostic tests for emerging infectious diseases, utilizing artificial intelligence for improved diagnostic accuracy and interpretation, and expanding into developing countries with growing demand for veterinary services.
Leading Players in the Veterinary Molecular Diagnostics Industry Sector
- Bioneer Corporation
- Biomedica Group
- Novacyt Group
- Biochek BV
- Biomerieux SA
- Veterinary Molecular Diagnostics Inc
- Virbac
- QIAGEN N V
- Thermo Fischer Scientific Inc
- Idexx Laboratories Inc
- Ingenetix GmbH
- Neogen Corporation
Key Milestones in Veterinary Molecular Diagnostics Industry Industry
- June 2022: R-Biopharm AG acquired AusDiagnostics, expanding its product portfolio in molecular diagnostics.
- May 2022: MSD Animal Health launched the DNA TRACEBACK Fisheries platform, a DNA-based tool for sustainable fisheries management.
Strategic Outlook for Veterinary Molecular Diagnostics Industry Market
The veterinary molecular diagnostics market holds significant future potential, driven by ongoing technological innovation and increasing demand for advanced diagnostic solutions. Strategic partnerships, expansion into new markets, and the development of innovative diagnostic platforms will be crucial for future success. The market is poised for considerable growth, offering attractive opportunities for both established and emerging players.
Veterinary Molecular Diagnostics Industry Segmentation
-
1. Product
- 1.1. Instruments
- 1.2. Kit and Reagents
- 1.3. Software and Services
-
2. Application
- 2.1. Infectious Diseases
- 2.2. Genetics
- 2.3. Other Applications
-
3. Technology
- 3.1. PCR
- 3.2. Microarray
- 3.3. DNA Sequencing
Veterinary Molecular Diagnostics Industry Segmentation By Geography
-
1. North America
- 1.1. United States
- 1.2. Canada
- 1.3. Mexico
-
2. Europe
- 2.1. Germany
- 2.2. United Kingdom
- 2.3. France
- 2.4. Italy
- 2.5. Spain
- 2.6. Rest of Europe
-
3. Asia Pacific
- 3.1. China
- 3.2. Japan
- 3.3. India
- 3.4. Australia
- 3.5. South Korea
- 3.6. Rest of Asia Pacific
-
4. Middle East and Africa
- 4.1. GCC
- 4.2. South Africa
- 4.3. Rest of Middle East and Africa
-
5. South America
- 5.1. Brazil
- 5.2. Argentina
- 5.3. Rest of South America

Veterinary Molecular Diagnostics Industry REPORT HIGHLIGHTS
| Aspects | Details |
|---|---|
| Study Period | 2019-2033 |
| Base Year | 2024 |
| Estimated Year | 2025 |
| Forecast Period | 2025-2033 |
| Historical Period | 2019-2024 |
| Growth Rate | CAGR of 9.72% from 2019-2033 |
| Segmentation |
|
Table of Contents
- 1. Introduction
- 1.1. Research Scope
- 1.2. Market Segmentation
- 1.3. Research Methodology
- 1.4. Definitions and Assumptions
- 2. Executive Summary
- 2.1. Introduction
- 3. Market Dynamics
- 3.1. Introduction
- 3.2. Market Drivers
- 3.2.1. Rise in Prevalence of Animal Diseases; Increase in Demand for Animal-derived Proteins; Growth in Animal Health Expenditure
- 3.3. Market Restrains
- 3.3.1. Lack of Skilled Personnel; High Cost of Diagnostic Tests
- 3.4. Market Trends
- 3.4.1. The Instruments Segment is Expected to Register Robust Growth
- 4. Market Factor Analysis
- 4.1. Porters Five Forces
- 4.2. Supply/Value Chain
- 4.3. PESTEL analysis
- 4.4. Market Entropy
- 4.5. Patent/Trademark Analysis
- 5. Global Veterinary Molecular Diagnostics Industry Analysis, Insights and Forecast, 2019-2031
- 5.1. Market Analysis, Insights and Forecast - by Product
- 5.1.1. Instruments
- 5.1.2. Kit and Reagents
- 5.1.3. Software and Services
- 5.2. Market Analysis, Insights and Forecast - by Application
- 5.2.1. Infectious Diseases
- 5.2.2. Genetics
- 5.2.3. Other Applications
- 5.3. Market Analysis, Insights and Forecast - by Technology
- 5.3.1. PCR
- 5.3.2. Microarray
- 5.3.3. DNA Sequencing
- 5.4. Market Analysis, Insights and Forecast - by Region
- 5.4.1. North America
- 5.4.2. Europe
- 5.4.3. Asia Pacific
- 5.4.4. Middle East and Africa
- 5.4.5. South America
- 5.1. Market Analysis, Insights and Forecast - by Product
- 6. North America Veterinary Molecular Diagnostics Industry Analysis, Insights and Forecast, 2019-2031
- 6.1. Market Analysis, Insights and Forecast - by Product
- 6.1.1. Instruments
- 6.1.2. Kit and Reagents
- 6.1.3. Software and Services
- 6.2. Market Analysis, Insights and Forecast - by Application
- 6.2.1. Infectious Diseases
- 6.2.2. Genetics
- 6.2.3. Other Applications
- 6.3. Market Analysis, Insights and Forecast - by Technology
- 6.3.1. PCR
- 6.3.2. Microarray
- 6.3.3. DNA Sequencing
- 6.1. Market Analysis, Insights and Forecast - by Product
- 7. Europe Veterinary Molecular Diagnostics Industry Analysis, Insights and Forecast, 2019-2031
- 7.1. Market Analysis, Insights and Forecast - by Product
- 7.1.1. Instruments
- 7.1.2. Kit and Reagents
- 7.1.3. Software and Services
- 7.2. Market Analysis, Insights and Forecast - by Application
- 7.2.1. Infectious Diseases
- 7.2.2. Genetics
- 7.2.3. Other Applications
- 7.3. Market Analysis, Insights and Forecast - by Technology
- 7.3.1. PCR
- 7.3.2. Microarray
- 7.3.3. DNA Sequencing
- 7.1. Market Analysis, Insights and Forecast - by Product
- 8. Asia Pacific Veterinary Molecular Diagnostics Industry Analysis, Insights and Forecast, 2019-2031
- 8.1. Market Analysis, Insights and Forecast - by Product
- 8.1.1. Instruments
- 8.1.2. Kit and Reagents
- 8.1.3. Software and Services
- 8.2. Market Analysis, Insights and Forecast - by Application
- 8.2.1. Infectious Diseases
- 8.2.2. Genetics
- 8.2.3. Other Applications
- 8.3. Market Analysis, Insights and Forecast - by Technology
- 8.3.1. PCR
- 8.3.2. Microarray
- 8.3.3. DNA Sequencing
- 8.1. Market Analysis, Insights and Forecast - by Product
- 9. Middle East and Africa Veterinary Molecular Diagnostics Industry Analysis, Insights and Forecast, 2019-2031
- 9.1. Market Analysis, Insights and Forecast - by Product
- 9.1.1. Instruments
- 9.1.2. Kit and Reagents
- 9.1.3. Software and Services
- 9.2. Market Analysis, Insights and Forecast - by Application
- 9.2.1. Infectious Diseases
- 9.2.2. Genetics
- 9.2.3. Other Applications
- 9.3. Market Analysis, Insights and Forecast - by Technology
- 9.3.1. PCR
- 9.3.2. Microarray
- 9.3.3. DNA Sequencing
- 9.1. Market Analysis, Insights and Forecast - by Product
- 10. South America Veterinary Molecular Diagnostics Industry Analysis, Insights and Forecast, 2019-2031
- 10.1. Market Analysis, Insights and Forecast - by Product
- 10.1.1. Instruments
- 10.1.2. Kit and Reagents
- 10.1.3. Software and Services
- 10.2. Market Analysis, Insights and Forecast - by Application
- 10.2.1. Infectious Diseases
- 10.2.2. Genetics
- 10.2.3. Other Applications
- 10.3. Market Analysis, Insights and Forecast - by Technology
- 10.3.1. PCR
- 10.3.2. Microarray
- 10.3.3. DNA Sequencing
- 10.1. Market Analysis, Insights and Forecast - by Product
- 11. North America Veterinary Molecular Diagnostics Industry Analysis, Insights and Forecast, 2019-2031
- 11.1. Market Analysis, Insights and Forecast - By Country/Sub-region
- 11.1.1 United States
- 11.1.2 Canada
- 11.1.3 Mexico
- 12. Europe Veterinary Molecular Diagnostics Industry Analysis, Insights and Forecast, 2019-2031
- 12.1. Market Analysis, Insights and Forecast - By Country/Sub-region
- 12.1.1 Germany
- 12.1.2 United Kingdom
- 12.1.3 France
- 12.1.4 Italy
- 12.1.5 Spain
- 12.1.6 Rest of Europe
- 13. Asia Pacific Veterinary Molecular Diagnostics Industry Analysis, Insights and Forecast, 2019-2031
- 13.1. Market Analysis, Insights and Forecast - By Country/Sub-region
- 13.1.1 China
- 13.1.2 Japan
- 13.1.3 India
- 13.1.4 Australia
- 13.1.5 South Korea
- 13.1.6 Rest of Asia Pacific
- 14. Middle East and Africa Veterinary Molecular Diagnostics Industry Analysis, Insights and Forecast, 2019-2031
- 14.1. Market Analysis, Insights and Forecast - By Country/Sub-region
- 14.1.1 GCC
- 14.1.2 South Africa
- 14.1.3 Rest of Middle East and Africa
- 15. South America Veterinary Molecular Diagnostics Industry Analysis, Insights and Forecast, 2019-2031
- 15.1. Market Analysis, Insights and Forecast - By Country/Sub-region
- 15.1.1 Brazil
- 15.1.2 Argentina
- 15.1.3 Rest of South America
- 16. Competitive Analysis
- 16.1. Global Market Share Analysis 2024
- 16.2. Company Profiles
- 16.2.1 Bioneer Corporation
- 16.2.1.1. Overview
- 16.2.1.2. Products
- 16.2.1.3. SWOT Analysis
- 16.2.1.4. Recent Developments
- 16.2.1.5. Financials (Based on Availability)
- 16.2.2 Biomedica Group
- 16.2.2.1. Overview
- 16.2.2.2. Products
- 16.2.2.3. SWOT Analysis
- 16.2.2.4. Recent Developments
- 16.2.2.5. Financials (Based on Availability)
- 16.2.3 Novacyt Group
- 16.2.3.1. Overview
- 16.2.3.2. Products
- 16.2.3.3. SWOT Analysis
- 16.2.3.4. Recent Developments
- 16.2.3.5. Financials (Based on Availability)
- 16.2.4 Biochek BV
- 16.2.4.1. Overview
- 16.2.4.2. Products
- 16.2.4.3. SWOT Analysis
- 16.2.4.4. Recent Developments
- 16.2.4.5. Financials (Based on Availability)
- 16.2.5 Biomerieux SA
- 16.2.5.1. Overview
- 16.2.5.2. Products
- 16.2.5.3. SWOT Analysis
- 16.2.5.4. Recent Developments
- 16.2.5.5. Financials (Based on Availability)
- 16.2.6 Veterinary Molecular Diagnostics Inc
- 16.2.6.1. Overview
- 16.2.6.2. Products
- 16.2.6.3. SWOT Analysis
- 16.2.6.4. Recent Developments
- 16.2.6.5. Financials (Based on Availability)
- 16.2.7 Virbac*List Not Exhaustive
- 16.2.7.1. Overview
- 16.2.7.2. Products
- 16.2.7.3. SWOT Analysis
- 16.2.7.4. Recent Developments
- 16.2.7.5. Financials (Based on Availability)
- 16.2.8 QIAGEN N V
- 16.2.8.1. Overview
- 16.2.8.2. Products
- 16.2.8.3. SWOT Analysis
- 16.2.8.4. Recent Developments
- 16.2.8.5. Financials (Based on Availability)
- 16.2.9 Thermo Fischer Scientific Inc
- 16.2.9.1. Overview
- 16.2.9.2. Products
- 16.2.9.3. SWOT Analysis
- 16.2.9.4. Recent Developments
- 16.2.9.5. Financials (Based on Availability)
- 16.2.10 Idexx Laboratories Inc
- 16.2.10.1. Overview
- 16.2.10.2. Products
- 16.2.10.3. SWOT Analysis
- 16.2.10.4. Recent Developments
- 16.2.10.5. Financials (Based on Availability)
- 16.2.11 Ingenetix GmbH
- 16.2.11.1. Overview
- 16.2.11.2. Products
- 16.2.11.3. SWOT Analysis
- 16.2.11.4. Recent Developments
- 16.2.11.5. Financials (Based on Availability)
- 16.2.12 Neogen Corporation
- 16.2.12.1. Overview
- 16.2.12.2. Products
- 16.2.12.3. SWOT Analysis
- 16.2.12.4. Recent Developments
- 16.2.12.5. Financials (Based on Availability)
- 16.2.1 Bioneer Corporation
List of Figures
- Figure 1: Global Veterinary Molecular Diagnostics Industry Revenue Breakdown (Million, %) by Region 2024 & 2032
- Figure 2: North America Veterinary Molecular Diagnostics Industry Revenue (Million), by Country 2024 & 2032
- Figure 3: North America Veterinary Molecular Diagnostics Industry Revenue Share (%), by Country 2024 & 2032
- Figure 4: Europe Veterinary Molecular Diagnostics Industry Revenue (Million), by Country 2024 & 2032
- Figure 5: Europe Veterinary Molecular Diagnostics Industry Revenue Share (%), by Country 2024 & 2032
- Figure 6: Asia Pacific Veterinary Molecular Diagnostics Industry Revenue (Million), by Country 2024 & 2032
- Figure 7: Asia Pacific Veterinary Molecular Diagnostics Industry Revenue Share (%), by Country 2024 & 2032
- Figure 8: Middle East and Africa Veterinary Molecular Diagnostics Industry Revenue (Million), by Country 2024 & 2032
- Figure 9: Middle East and Africa Veterinary Molecular Diagnostics Industry Revenue Share (%), by Country 2024 & 2032
- Figure 10: South America Veterinary Molecular Diagnostics Industry Revenue (Million), by Country 2024 & 2032
- Figure 11: South America Veterinary Molecular Diagnostics Industry Revenue Share (%), by Country 2024 & 2032
- Figure 12: North America Veterinary Molecular Diagnostics Industry Revenue (Million), by Product 2024 & 2032
- Figure 13: North America Veterinary Molecular Diagnostics Industry Revenue Share (%), by Product 2024 & 2032
- Figure 14: North America Veterinary Molecular Diagnostics Industry Revenue (Million), by Application 2024 & 2032
- Figure 15: North America Veterinary Molecular Diagnostics Industry Revenue Share (%), by Application 2024 & 2032
- Figure 16: North America Veterinary Molecular Diagnostics Industry Revenue (Million), by Technology 2024 & 2032
- Figure 17: North America Veterinary Molecular Diagnostics Industry Revenue Share (%), by Technology 2024 & 2032
- Figure 18: North America Veterinary Molecular Diagnostics Industry Revenue (Million), by Country 2024 & 2032
- Figure 19: North America Veterinary Molecular Diagnostics Industry Revenue Share (%), by Country 2024 & 2032
- Figure 20: Europe Veterinary Molecular Diagnostics Industry Revenue (Million), by Product 2024 & 2032
- Figure 21: Europe Veterinary Molecular Diagnostics Industry Revenue Share (%), by Product 2024 & 2032
- Figure 22: Europe Veterinary Molecular Diagnostics Industry Revenue (Million), by Application 2024 & 2032
- Figure 23: Europe Veterinary Molecular Diagnostics Industry Revenue Share (%), by Application 2024 & 2032
- Figure 24: Europe Veterinary Molecular Diagnostics Industry Revenue (Million), by Technology 2024 & 2032
- Figure 25: Europe Veterinary Molecular Diagnostics Industry Revenue Share (%), by Technology 2024 & 2032
- Figure 26: Europe Veterinary Molecular Diagnostics Industry Revenue (Million), by Country 2024 & 2032
- Figure 27: Europe Veterinary Molecular Diagnostics Industry Revenue Share (%), by Country 2024 & 2032
- Figure 28: Asia Pacific Veterinary Molecular Diagnostics Industry Revenue (Million), by Product 2024 & 2032
- Figure 29: Asia Pacific Veterinary Molecular Diagnostics Industry Revenue Share (%), by Product 2024 & 2032
- Figure 30: Asia Pacific Veterinary Molecular Diagnostics Industry Revenue (Million), by Application 2024 & 2032
- Figure 31: Asia Pacific Veterinary Molecular Diagnostics Industry Revenue Share (%), by Application 2024 & 2032
- Figure 32: Asia Pacific Veterinary Molecular Diagnostics Industry Revenue (Million), by Technology 2024 & 2032
- Figure 33: Asia Pacific Veterinary Molecular Diagnostics Industry Revenue Share (%), by Technology 2024 & 2032
- Figure 34: Asia Pacific Veterinary Molecular Diagnostics Industry Revenue (Million), by Country 2024 & 2032
- Figure 35: Asia Pacific Veterinary Molecular Diagnostics Industry Revenue Share (%), by Country 2024 & 2032
- Figure 36: Middle East and Africa Veterinary Molecular Diagnostics Industry Revenue (Million), by Product 2024 & 2032
- Figure 37: Middle East and Africa Veterinary Molecular Diagnostics Industry Revenue Share (%), by Product 2024 & 2032
- Figure 38: Middle East and Africa Veterinary Molecular Diagnostics Industry Revenue (Million), by Application 2024 & 2032
- Figure 39: Middle East and Africa Veterinary Molecular Diagnostics Industry Revenue Share (%), by Application 2024 & 2032
- Figure 40: Middle East and Africa Veterinary Molecular Diagnostics Industry Revenue (Million), by Technology 2024 & 2032
- Figure 41: Middle East and Africa Veterinary Molecular Diagnostics Industry Revenue Share (%), by Technology 2024 & 2032
- Figure 42: Middle East and Africa Veterinary Molecular Diagnostics Industry Revenue (Million), by Country 2024 & 2032
- Figure 43: Middle East and Africa Veterinary Molecular Diagnostics Industry Revenue Share (%), by Country 2024 & 2032
- Figure 44: South America Veterinary Molecular Diagnostics Industry Revenue (Million), by Product 2024 & 2032
- Figure 45: South America Veterinary Molecular Diagnostics Industry Revenue Share (%), by Product 2024 & 2032
- Figure 46: South America Veterinary Molecular Diagnostics Industry Revenue (Million), by Application 2024 & 2032
- Figure 47: South America Veterinary Molecular Diagnostics Industry Revenue Share (%), by Application 2024 & 2032
- Figure 48: South America Veterinary Molecular Diagnostics Industry Revenue (Million), by Technology 2024 & 2032
- Figure 49: South America Veterinary Molecular Diagnostics Industry Revenue Share (%), by Technology 2024 & 2032
- Figure 50: South America Veterinary Molecular Diagnostics Industry Revenue (Million), by Country 2024 & 2032
- Figure 51: South America Veterinary Molecular Diagnostics Industry Revenue Share (%), by Country 2024 & 2032
List of Tables
- Table 1: Global Veterinary Molecular Diagnostics Industry Revenue Million Forecast, by Region 2019 & 2032
- Table 2: Global Veterinary Molecular Diagnostics Industry Revenue Million Forecast, by Product 2019 & 2032
- Table 3: Global Veterinary Molecular Diagnostics Industry Revenue Million Forecast, by Application 2019 & 2032
- Table 4: Global Veterinary Molecular Diagnostics Industry Revenue Million Forecast, by Technology 2019 & 2032
- Table 5: Global Veterinary Molecular Diagnostics Industry Revenue Million Forecast, by Region 2019 & 2032
- Table 6: Global Veterinary Molecular Diagnostics Industry Revenue Million Forecast, by Country 2019 & 2032
- Table 7: United States Veterinary Molecular Diagnostics Industry Revenue (Million) Forecast, by Application 2019 & 2032
- Table 8: Canada Veterinary Molecular Diagnostics Industry Revenue (Million) Forecast, by Application 2019 & 2032
- Table 9: Mexico Veterinary Molecular Diagnostics Industry Revenue (Million) Forecast, by Application 2019 & 2032
- Table 10: Global Veterinary Molecular Diagnostics Industry Revenue Million Forecast, by Country 2019 & 2032
- Table 11: Germany Veterinary Molecular Diagnostics Industry Revenue (Million) Forecast, by Application 2019 & 2032
- Table 12: United Kingdom Veterinary Molecular Diagnostics Industry Revenue (Million) Forecast, by Application 2019 & 2032
- Table 13: France Veterinary Molecular Diagnostics Industry Revenue (Million) Forecast, by Application 2019 & 2032
- Table 14: Italy Veterinary Molecular Diagnostics Industry Revenue (Million) Forecast, by Application 2019 & 2032
- Table 15: Spain Veterinary Molecular Diagnostics Industry Revenue (Million) Forecast, by Application 2019 & 2032
- Table 16: Rest of Europe Veterinary Molecular Diagnostics Industry Revenue (Million) Forecast, by Application 2019 & 2032
- Table 17: Global Veterinary Molecular Diagnostics Industry Revenue Million Forecast, by Country 2019 & 2032
- Table 18: China Veterinary Molecular Diagnostics Industry Revenue (Million) Forecast, by Application 2019 & 2032
- Table 19: Japan Veterinary Molecular Diagnostics Industry Revenue (Million) Forecast, by Application 2019 & 2032
- Table 20: India Veterinary Molecular Diagnostics Industry Revenue (Million) Forecast, by Application 2019 & 2032
- Table 21: Australia Veterinary Molecular Diagnostics Industry Revenue (Million) Forecast, by Application 2019 & 2032
- Table 22: South Korea Veterinary Molecular Diagnostics Industry Revenue (Million) Forecast, by Application 2019 & 2032
- Table 23: Rest of Asia Pacific Veterinary Molecular Diagnostics Industry Revenue (Million) Forecast, by Application 2019 & 2032
- Table 24: Global Veterinary Molecular Diagnostics Industry Revenue Million Forecast, by Country 2019 & 2032
- Table 25: GCC Veterinary Molecular Diagnostics Industry Revenue (Million) Forecast, by Application 2019 & 2032
- Table 26: South Africa Veterinary Molecular Diagnostics Industry Revenue (Million) Forecast, by Application 2019 & 2032
- Table 27: Rest of Middle East and Africa Veterinary Molecular Diagnostics Industry Revenue (Million) Forecast, by Application 2019 & 2032
- Table 28: Global Veterinary Molecular Diagnostics Industry Revenue Million Forecast, by Country 2019 & 2032
- Table 29: Brazil Veterinary Molecular Diagnostics Industry Revenue (Million) Forecast, by Application 2019 & 2032
- Table 30: Argentina Veterinary Molecular Diagnostics Industry Revenue (Million) Forecast, by Application 2019 & 2032
- Table 31: Rest of South America Veterinary Molecular Diagnostics Industry Revenue (Million) Forecast, by Application 2019 & 2032
- Table 32: Global Veterinary Molecular Diagnostics Industry Revenue Million Forecast, by Product 2019 & 2032
- Table 33: Global Veterinary Molecular Diagnostics Industry Revenue Million Forecast, by Application 2019 & 2032
- Table 34: Global Veterinary Molecular Diagnostics Industry Revenue Million Forecast, by Technology 2019 & 2032
- Table 35: Global Veterinary Molecular Diagnostics Industry Revenue Million Forecast, by Country 2019 & 2032
- Table 36: United States Veterinary Molecular Diagnostics Industry Revenue (Million) Forecast, by Application 2019 & 2032
- Table 37: Canada Veterinary Molecular Diagnostics Industry Revenue (Million) Forecast, by Application 2019 & 2032
- Table 38: Mexico Veterinary Molecular Diagnostics Industry Revenue (Million) Forecast, by Application 2019 & 2032
- Table 39: Global Veterinary Molecular Diagnostics Industry Revenue Million Forecast, by Product 2019 & 2032
- Table 40: Global Veterinary Molecular Diagnostics Industry Revenue Million Forecast, by Application 2019 & 2032
- Table 41: Global Veterinary Molecular Diagnostics Industry Revenue Million Forecast, by Technology 2019 & 2032
- Table 42: Global Veterinary Molecular Diagnostics Industry Revenue Million Forecast, by Country 2019 & 2032
- Table 43: Germany Veterinary Molecular Diagnostics Industry Revenue (Million) Forecast, by Application 2019 & 2032
- Table 44: United Kingdom Veterinary Molecular Diagnostics Industry Revenue (Million) Forecast, by Application 2019 & 2032
- Table 45: France Veterinary Molecular Diagnostics Industry Revenue (Million) Forecast, by Application 2019 & 2032
- Table 46: Italy Veterinary Molecular Diagnostics Industry Revenue (Million) Forecast, by Application 2019 & 2032
- Table 47: Spain Veterinary Molecular Diagnostics Industry Revenue (Million) Forecast, by Application 2019 & 2032
- Table 48: Rest of Europe Veterinary Molecular Diagnostics Industry Revenue (Million) Forecast, by Application 2019 & 2032
- Table 49: Global Veterinary Molecular Diagnostics Industry Revenue Million Forecast, by Product 2019 & 2032
- Table 50: Global Veterinary Molecular Diagnostics Industry Revenue Million Forecast, by Application 2019 & 2032
- Table 51: Global Veterinary Molecular Diagnostics Industry Revenue Million Forecast, by Technology 2019 & 2032
- Table 52: Global Veterinary Molecular Diagnostics Industry Revenue Million Forecast, by Country 2019 & 2032
- Table 53: China Veterinary Molecular Diagnostics Industry Revenue (Million) Forecast, by Application 2019 & 2032
- Table 54: Japan Veterinary Molecular Diagnostics Industry Revenue (Million) Forecast, by Application 2019 & 2032
- Table 55: India Veterinary Molecular Diagnostics Industry Revenue (Million) Forecast, by Application 2019 & 2032
- Table 56: Australia Veterinary Molecular Diagnostics Industry Revenue (Million) Forecast, by Application 2019 & 2032
- Table 57: South Korea Veterinary Molecular Diagnostics Industry Revenue (Million) Forecast, by Application 2019 & 2032
- Table 58: Rest of Asia Pacific Veterinary Molecular Diagnostics Industry Revenue (Million) Forecast, by Application 2019 & 2032
- Table 59: Global Veterinary Molecular Diagnostics Industry Revenue Million Forecast, by Product 2019 & 2032
- Table 60: Global Veterinary Molecular Diagnostics Industry Revenue Million Forecast, by Application 2019 & 2032
- Table 61: Global Veterinary Molecular Diagnostics Industry Revenue Million Forecast, by Technology 2019 & 2032
- Table 62: Global Veterinary Molecular Diagnostics Industry Revenue Million Forecast, by Country 2019 & 2032
- Table 63: GCC Veterinary Molecular Diagnostics Industry Revenue (Million) Forecast, by Application 2019 & 2032
- Table 64: South Africa Veterinary Molecular Diagnostics Industry Revenue (Million) Forecast, by Application 2019 & 2032
- Table 65: Rest of Middle East and Africa Veterinary Molecular Diagnostics Industry Revenue (Million) Forecast, by Application 2019 & 2032
- Table 66: Global Veterinary Molecular Diagnostics Industry Revenue Million Forecast, by Product 2019 & 2032
- Table 67: Global Veterinary Molecular Diagnostics Industry Revenue Million Forecast, by Application 2019 & 2032
- Table 68: Global Veterinary Molecular Diagnostics Industry Revenue Million Forecast, by Technology 2019 & 2032
- Table 69: Global Veterinary Molecular Diagnostics Industry Revenue Million Forecast, by Country 2019 & 2032
- Table 70: Brazil Veterinary Molecular Diagnostics Industry Revenue (Million) Forecast, by Application 2019 & 2032
- Table 71: Argentina Veterinary Molecular Diagnostics Industry Revenue (Million) Forecast, by Application 2019 & 2032
- Table 72: Rest of South America Veterinary Molecular Diagnostics Industry Revenue (Million) Forecast, by Application 2019 & 2032
Frequently Asked Questions
1. What is the projected Compound Annual Growth Rate (CAGR) of the Veterinary Molecular Diagnostics Industry?
The projected CAGR is approximately 9.72%.
2. Which companies are prominent players in the Veterinary Molecular Diagnostics Industry?
Key companies in the market include Bioneer Corporation, Biomedica Group, Novacyt Group, Biochek BV, Biomerieux SA, Veterinary Molecular Diagnostics Inc, Virbac*List Not Exhaustive, QIAGEN N V, Thermo Fischer Scientific Inc, Idexx Laboratories Inc, Ingenetix GmbH, Neogen Corporation.
3. What are the main segments of the Veterinary Molecular Diagnostics Industry?
The market segments include Product, Application, Technology.
4. Can you provide details about the market size?
The market size is estimated to be USD 0.65 Million as of 2022.
5. What are some drivers contributing to market growth?
Rise in Prevalence of Animal Diseases; Increase in Demand for Animal-derived Proteins; Growth in Animal Health Expenditure.
6. What are the notable trends driving market growth?
The Instruments Segment is Expected to Register Robust Growth.
7. Are there any restraints impacting market growth?
Lack of Skilled Personnel; High Cost of Diagnostic Tests.
8. Can you provide examples of recent developments in the market?
In June 2022, R-Biopharm AG acquired AusDiagnostics. With this acquisition, R-Biopharm expanded its product portfolio with molecular biology multiplex diagnostics, extraction reagents, and laboratory automation equipment for animals and humans.
9. What pricing options are available for accessing the report?
Pricing options include single-user, multi-user, and enterprise licenses priced at USD 4750, USD 5250, and USD 8750 respectively.
10. Is the market size provided in terms of value or volume?
The market size is provided in terms of value, measured in Million.
11. Are there any specific market keywords associated with the report?
Yes, the market keyword associated with the report is "Veterinary Molecular Diagnostics Industry," which aids in identifying and referencing the specific market segment covered.
12. How do I determine which pricing option suits my needs best?
The pricing options vary based on user requirements and access needs. Individual users may opt for single-user licenses, while businesses requiring broader access may choose multi-user or enterprise licenses for cost-effective access to the report.
13. Are there any additional resources or data provided in the Veterinary Molecular Diagnostics Industry report?
While the report offers comprehensive insights, it's advisable to review the specific contents or supplementary materials provided to ascertain if additional resources or data are available.
14. How can I stay updated on further developments or reports in the Veterinary Molecular Diagnostics Industry?
To stay informed about further developments, trends, and reports in the Veterinary Molecular Diagnostics Industry, consider subscribing to industry newsletters, following relevant companies and organizations, or regularly checking reputable industry news sources and publications.
Methodology
Step 1 - Identification of Relevant Samples Size from Population Database


Step 2 - Approaches for Defining Global Market Size (Value, Volume* & Price*)

Note*: In applicable scenarios
Step 3 - Data Sources
Primary Research
- Web Analytics
- Survey Reports
- Research Institute
- Latest Research Reports
- Opinion Leaders
Secondary Research
- Annual Reports
- White Paper
- Latest Press Release
- Industry Association
- Paid Database
- Investor Presentations

Step 4 - Data Triangulation
Involves using different sources of information in order to increase the validity of a study
These sources are likely to be stakeholders in a program - participants, other researchers, program staff, other community members, and so on.
Then we put all data in single framework & apply various statistical tools to find out the dynamic on the market.
During the analysis stage, feedback from the stakeholder groups would be compared to determine areas of agreement as well as areas of divergence
