

Key Insights
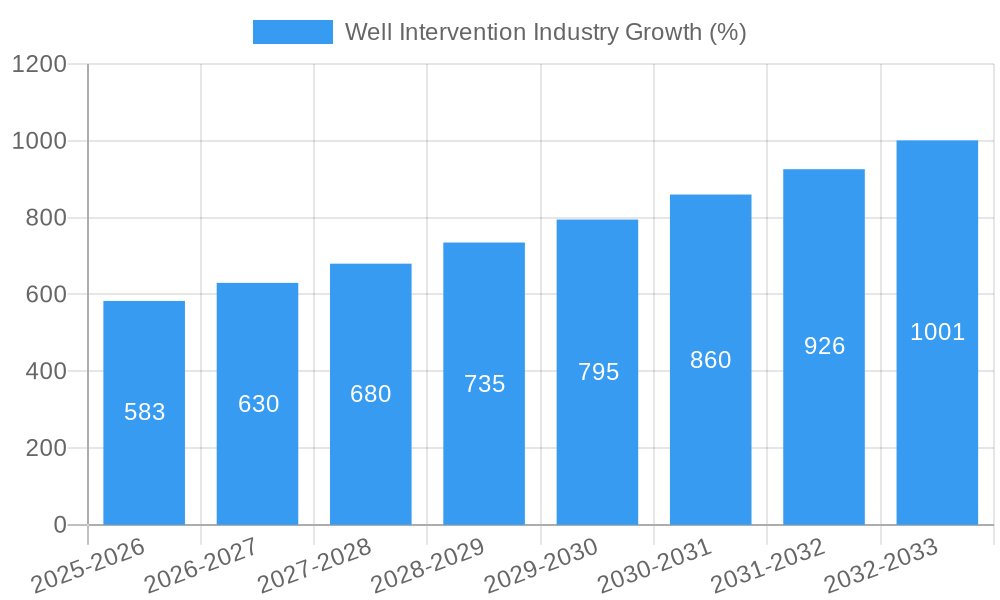
The global well intervention market, valued at $8.49 billion in 2025, is projected to experience robust growth, driven by increasing demand for enhanced oil recovery techniques and aging oil and gas infrastructure requiring more frequent interventions. A Compound Annual Growth Rate (CAGR) of 6.80% from 2025 to 2033 indicates a significant expansion of the market, reaching an estimated $14.7 billion by 2033. This growth is fueled by several key factors. Firstly, the rising global energy demand necessitates efficient and effective methods for maintaining production from existing wells, boosting the need for well intervention services. Secondly, technological advancements in intervention techniques, such as coiled tubing and wireline operations, are improving efficiency and reducing operational costs, making them more attractive to operators. Finally, stricter environmental regulations are pushing for improved well integrity and reduced emissions, increasing the adoption of advanced well intervention technologies.
The market is segmented geographically, with North America, Europe, and Asia-Pacific representing significant regional markets. North America benefits from established oil and gas infrastructure and a high concentration of service providers, while Asia-Pacific is experiencing rapid growth due to significant investments in exploration and production activities, particularly in countries like China and India. Competition is fierce, with major players like Schlumberger, Halliburton, Baker Hughes, and Weatherford International vying for market share through technological innovation, strategic partnerships, and acquisitions. While challenges exist, such as fluctuations in oil prices and geopolitical uncertainties, the long-term outlook for the well intervention market remains positive, driven by sustained energy demand and ongoing technological improvements. The onshore segment currently dominates due to the greater accessibility and established infrastructure, however, the offshore segment is expected to see increased growth as exploration and production move to more challenging environments.

Well Intervention Industry Market Report: 2019-2033 Forecast
This comprehensive report provides an in-depth analysis of the Well Intervention Industry, offering actionable insights for stakeholders across the value chain. With a study period spanning 2019-2033, a base year of 2025, and a forecast period of 2025-2033, this report presents a detailed overview of market dynamics, key players, and future growth opportunities. The global market size is estimated at $xx Million in 2025, with a projected CAGR of xx% during the forecast period.
Well Intervention Industry Market Concentration & Dynamics
The Well Intervention market is characterized by a moderately concentrated landscape dominated by a few major players like Schlumberger Limited, Halliburton Company, and Baker Hughes Company, collectively holding approximately xx% of the market share in 2025. Smaller players like Scientific Drilling International Inc and Weatherford International Ltd compete for the remaining market share, often specializing in niche areas or geographic locations. The industry witnesses significant M&A activity, with an estimated xx deals recorded between 2019 and 2024, primarily driven by companies seeking to expand their service portfolios and geographical reach. Innovation plays a vital role, with continuous advancements in technologies like robotic interventions and advanced data analytics shaping the market. Regulatory frameworks, varying across different regions, influence operational costs and safety standards. Substitute products, while limited, are emerging, posing potential challenges to established players. End-user trends, particularly towards enhanced oil recovery techniques and sustainable practices, are shaping demand.
- Market Share (2025): Schlumberger Limited (xx%), Halliburton Company (xx%), Baker Hughes Company (xx%), Others (xx%)
- M&A Deal Count (2019-2024): xx
- Key Innovation Areas: Robotic well intervention, advanced data analytics, enhanced oil recovery techniques.
Well Intervention Industry Industry Insights & Trends
The Well Intervention market is experiencing robust growth driven by increasing oil and gas exploration and production activities globally. The rising demand for enhanced oil recovery (EOR) techniques and the growing need for well integrity management are major growth catalysts. Technological advancements in remote operations, automation, and data analytics are transforming the industry. The shift towards digitalization and the adoption of Industry 4.0 technologies are also enhancing operational efficiency and reducing downtime. Consumer behavior is shifting towards sustainable and environmentally friendly practices, putting pressure on companies to adopt cleaner technologies and reduce their carbon footprint. The market size is projected to reach $xx Million by 2033.
Key Markets & Segments Leading Well Intervention Industry
The offshore segment dominates the Well Intervention market, driven by the higher complexity and cost associated with offshore operations, resulting in greater demand for specialized well intervention services. This segment accounts for approximately xx% of the total market revenue in 2025. While the Onshore segment presents a substantial market, the higher operational complexity and technological advancements required for Offshore projects leads to higher revenue generation.
Drivers for Offshore Segment Dominance:
- High Complexity & Cost: Demand for specialized equipment and expertise leads to higher service pricing.
- Technological Advancements: Deployment of advanced technologies like ROVs and subsea intervention systems.
- Geographical Expansion: Exploration and production activities shifting towards deeper waters.
Drivers for Onshore Segment Growth:
- Economic Growth in Emerging Markets: Increased investment in onshore oil and gas exploration and production activities.
- Improved Infrastructure: Development of transportation networks and related infrastructure.
- Cost-Effective Operations: Relatively lower operational cost compared to offshore activities.
Well Intervention Industry Product Developments
Recent advancements include the development of lighter, more efficient intervention tools, improved robotics and automation for reduced human intervention, and advanced data analytics for optimized well management. These innovations enhance safety, speed up operations, and improve overall cost-effectiveness, giving companies a significant competitive edge in the market. The integration of Artificial Intelligence and Machine Learning in well intervention systems continues to transform the industry.
Challenges in the Well Intervention Industry Market
The Well Intervention industry faces challenges including stringent regulatory requirements, volatile oil and gas prices, supply chain disruptions, and intense competition among established players and emerging technologies. These factors contribute to price fluctuations and impact overall profitability. Specifically, regulatory hurdles in certain regions, such as obtaining permits and complying with environmental regulations, cause significant delays and added costs.
Forces Driving Well Intervention Industry Growth
Technological advancements, rising oil and gas prices, and growing demand for enhanced oil recovery methods are primary growth drivers. Increased investments in offshore exploration and production activities, particularly in deepwater regions, also contribute significantly. Supportive government policies promoting exploration and production in certain regions further accelerate market growth.
Long-Term Growth Catalysts in the Well Intervention Industry
Long-term growth is propelled by the continued adoption of advanced technologies, strategic partnerships between service providers and operators, and the expansion into new and emerging markets. Focus on sustainable practices and environmentally friendly technologies further contributes to long-term market growth, particularly in regions with stringent environmental regulations.
Emerging Opportunities in Well Intervention Industry
Emerging opportunities lie in the development and application of advanced automation, robotics, and AI in well intervention operations. The expansion into unconventional resources and geographically challenging environments, such as deepwater and arctic regions, opens significant growth avenues. Focus on providing sustainable and environmentally friendly solutions presents a compelling opportunity for gaining a competitive advantage.
Leading Players in the Well Intervention Industry Sector
- China Oilfield Services Ltd
- Vallourec SA
- National Oilwell Varco Inc
- Baker Hughes Company
- Halliburton Company
- Weatherford International Ltd
- Schlumberger Limited
- Scientific Drilling International Inc
Key Milestones in Well Intervention Industry Industry
- May 2023: TechnipFMC secures a contract from Equinor for RLWI services on the Norwegian Continental Shelf, highlighting growing demand for production enhancement and pre-plug-and-abandonment services.
- March 2023: Petroleum Safety Authority Norway (PSA) approves Norske Shell's use of the Island Constructor vessel for well intervention, indicating increased investment in specialized well intervention equipment.
Strategic Outlook for Well Intervention Industry Market
The Well Intervention market exhibits significant growth potential, driven by technological advancements, increasing global energy demand, and the focus on enhancing oil and gas recovery. Strategic partnerships, expansion into new geographical regions, and investment in sustainable technologies present lucrative opportunities for established and emerging players. Companies focusing on innovation and operational efficiency will be well-positioned to capitalize on the long-term growth prospects of this dynamic market.
Well Intervention Industry Segmentation
-
1. Location of Deployment
- 1.1. Onshore
- 1.2. Offshore
Well Intervention Industry Segmentation By Geography
-
1. North America
- 1.1. United States of America
- 1.2. Canada
- 1.3. Rest of the North America
-
2. Europe
- 2.1. United Kingdom
- 2.2. France
- 2.3. Germany
- 2.4. Italy
- 2.5. Rest of the Europe
-
3. Asia Pacific
- 3.1. China
- 3.2. India
- 3.3. South Korea
- 3.4. Rest of the Asia Pacific
-
4. South America
- 4.1. Brazil
- 4.2. Argentina
- 4.3. Rest of the South America
-
5. Middle East and Africa
- 5.1. United Arab Emirates
- 5.2. Saudi Arabia
- 5.3. Rest of the Middle East and Africa

Well Intervention Industry REPORT HIGHLIGHTS
| Aspects | Details |
|---|---|
| Study Period | 2019-2033 |
| Base Year | 2024 |
| Estimated Year | 2025 |
| Forecast Period | 2025-2033 |
| Historical Period | 2019-2024 |
| Growth Rate | CAGR of 6.80% from 2019-2033 |
| Segmentation |
|
Table of Contents
- 1. Introduction
- 1.1. Research Scope
- 1.2. Market Segmentation
- 1.3. Research Methodology
- 1.4. Definitions and Assumptions
- 2. Executive Summary
- 2.1. Introduction
- 3. Market Dynamics
- 3.1. Introduction
- 3.2. Market Drivers
- 3.2.1. 4.; Increased Drilling and Completion Activities
- 3.3. Market Restrains
- 3.3.1. 4.; Volatility of Oil Prices
- 3.4. Market Trends
- 3.4.1. Offshore Segment to have a Significant Market Share
- 4. Market Factor Analysis
- 4.1. Porters Five Forces
- 4.2. Supply/Value Chain
- 4.3. PESTEL analysis
- 4.4. Market Entropy
- 4.5. Patent/Trademark Analysis
- 5. Global Well Intervention Industry Analysis, Insights and Forecast, 2019-2031
- 5.1. Market Analysis, Insights and Forecast - by Location of Deployment
- 5.1.1. Onshore
- 5.1.2. Offshore
- 5.2. Market Analysis, Insights and Forecast - by Region
- 5.2.1. North America
- 5.2.2. Europe
- 5.2.3. Asia Pacific
- 5.2.4. South America
- 5.2.5. Middle East and Africa
- 5.1. Market Analysis, Insights and Forecast - by Location of Deployment
- 6. North America Well Intervention Industry Analysis, Insights and Forecast, 2019-2031
- 6.1. Market Analysis, Insights and Forecast - by Location of Deployment
- 6.1.1. Onshore
- 6.1.2. Offshore
- 6.1. Market Analysis, Insights and Forecast - by Location of Deployment
- 7. Europe Well Intervention Industry Analysis, Insights and Forecast, 2019-2031
- 7.1. Market Analysis, Insights and Forecast - by Location of Deployment
- 7.1.1. Onshore
- 7.1.2. Offshore
- 7.1. Market Analysis, Insights and Forecast - by Location of Deployment
- 8. Asia Pacific Well Intervention Industry Analysis, Insights and Forecast, 2019-2031
- 8.1. Market Analysis, Insights and Forecast - by Location of Deployment
- 8.1.1. Onshore
- 8.1.2. Offshore
- 8.1. Market Analysis, Insights and Forecast - by Location of Deployment
- 9. South America Well Intervention Industry Analysis, Insights and Forecast, 2019-2031
- 9.1. Market Analysis, Insights and Forecast - by Location of Deployment
- 9.1.1. Onshore
- 9.1.2. Offshore
- 9.1. Market Analysis, Insights and Forecast - by Location of Deployment
- 10. Middle East and Africa Well Intervention Industry Analysis, Insights and Forecast, 2019-2031
- 10.1. Market Analysis, Insights and Forecast - by Location of Deployment
- 10.1.1. Onshore
- 10.1.2. Offshore
- 10.1. Market Analysis, Insights and Forecast - by Location of Deployment
- 11. North America Well Intervention Industry Analysis, Insights and Forecast, 2019-2031
- 11.1. Market Analysis, Insights and Forecast - By Country/Sub-region
- 11.1.1 United States
- 11.1.2 Canada
- 11.1.3 Mexico
- 12. Europe Well Intervention Industry Analysis, Insights and Forecast, 2019-2031
- 12.1. Market Analysis, Insights and Forecast - By Country/Sub-region
- 12.1.1 Germany
- 12.1.2 United Kingdom
- 12.1.3 France
- 12.1.4 Spain
- 12.1.5 Italy
- 12.1.6 Spain
- 12.1.7 Belgium
- 12.1.8 Netherland
- 12.1.9 Nordics
- 12.1.10 Rest of Europe
- 13. Asia Pacific Well Intervention Industry Analysis, Insights and Forecast, 2019-2031
- 13.1. Market Analysis, Insights and Forecast - By Country/Sub-region
- 13.1.1 China
- 13.1.2 Japan
- 13.1.3 India
- 13.1.4 South Korea
- 13.1.5 Southeast Asia
- 13.1.6 Australia
- 13.1.7 Indonesia
- 13.1.8 Phillipes
- 13.1.9 Singapore
- 13.1.10 Thailandc
- 13.1.11 Rest of Asia Pacific
- 14. South America Well Intervention Industry Analysis, Insights and Forecast, 2019-2031
- 14.1. Market Analysis, Insights and Forecast - By Country/Sub-region
- 14.1.1 Brazil
- 14.1.2 Argentina
- 14.1.3 Peru
- 14.1.4 Chile
- 14.1.5 Colombia
- 14.1.6 Ecuador
- 14.1.7 Venezuela
- 14.1.8 Rest of South America
- 15. MEA Well Intervention Industry Analysis, Insights and Forecast, 2019-2031
- 15.1. Market Analysis, Insights and Forecast - By Country/Sub-region
- 15.1.1 United Arab Emirates
- 15.1.2 Saudi Arabia
- 15.1.3 South Africa
- 15.1.4 Rest of Middle East and Africa
- 16. Competitive Analysis
- 16.1. Global Market Share Analysis 2024
- 16.2. Company Profiles
- 16.2.1 China Oilfield Services Ltd
- 16.2.1.1. Overview
- 16.2.1.2. Products
- 16.2.1.3. SWOT Analysis
- 16.2.1.4. Recent Developments
- 16.2.1.5. Financials (Based on Availability)
- 16.2.2 Vallourec SA
- 16.2.2.1. Overview
- 16.2.2.2. Products
- 16.2.2.3. SWOT Analysis
- 16.2.2.4. Recent Developments
- 16.2.2.5. Financials (Based on Availability)
- 16.2.3 National Oilwell Varco Inc
- 16.2.3.1. Overview
- 16.2.3.2. Products
- 16.2.3.3. SWOT Analysis
- 16.2.3.4. Recent Developments
- 16.2.3.5. Financials (Based on Availability)
- 16.2.4 Baker Hughes Company
- 16.2.4.1. Overview
- 16.2.4.2. Products
- 16.2.4.3. SWOT Analysis
- 16.2.4.4. Recent Developments
- 16.2.4.5. Financials (Based on Availability)
- 16.2.5 Halliburton Company
- 16.2.5.1. Overview
- 16.2.5.2. Products
- 16.2.5.3. SWOT Analysis
- 16.2.5.4. Recent Developments
- 16.2.5.5. Financials (Based on Availability)
- 16.2.6 Weatherford International Ltd
- 16.2.6.1. Overview
- 16.2.6.2. Products
- 16.2.6.3. SWOT Analysis
- 16.2.6.4. Recent Developments
- 16.2.6.5. Financials (Based on Availability)
- 16.2.7 Schlumberger Limited
- 16.2.7.1. Overview
- 16.2.7.2. Products
- 16.2.7.3. SWOT Analysis
- 16.2.7.4. Recent Developments
- 16.2.7.5. Financials (Based on Availability)
- 16.2.8 Scientific Drilling International Inc
- 16.2.8.1. Overview
- 16.2.8.2. Products
- 16.2.8.3. SWOT Analysis
- 16.2.8.4. Recent Developments
- 16.2.8.5. Financials (Based on Availability)
- 16.2.1 China Oilfield Services Ltd
List of Figures
- Figure 1: Global Well Intervention Industry Revenue Breakdown (Million, %) by Region 2024 & 2032
- Figure 2: North America Well Intervention Industry Revenue (Million), by Country 2024 & 2032
- Figure 3: North America Well Intervention Industry Revenue Share (%), by Country 2024 & 2032
- Figure 4: Europe Well Intervention Industry Revenue (Million), by Country 2024 & 2032
- Figure 5: Europe Well Intervention Industry Revenue Share (%), by Country 2024 & 2032
- Figure 6: Asia Pacific Well Intervention Industry Revenue (Million), by Country 2024 & 2032
- Figure 7: Asia Pacific Well Intervention Industry Revenue Share (%), by Country 2024 & 2032
- Figure 8: South America Well Intervention Industry Revenue (Million), by Country 2024 & 2032
- Figure 9: South America Well Intervention Industry Revenue Share (%), by Country 2024 & 2032
- Figure 10: MEA Well Intervention Industry Revenue (Million), by Country 2024 & 2032
- Figure 11: MEA Well Intervention Industry Revenue Share (%), by Country 2024 & 2032
- Figure 12: North America Well Intervention Industry Revenue (Million), by Location of Deployment 2024 & 2032
- Figure 13: North America Well Intervention Industry Revenue Share (%), by Location of Deployment 2024 & 2032
- Figure 14: North America Well Intervention Industry Revenue (Million), by Country 2024 & 2032
- Figure 15: North America Well Intervention Industry Revenue Share (%), by Country 2024 & 2032
- Figure 16: Europe Well Intervention Industry Revenue (Million), by Location of Deployment 2024 & 2032
- Figure 17: Europe Well Intervention Industry Revenue Share (%), by Location of Deployment 2024 & 2032
- Figure 18: Europe Well Intervention Industry Revenue (Million), by Country 2024 & 2032
- Figure 19: Europe Well Intervention Industry Revenue Share (%), by Country 2024 & 2032
- Figure 20: Asia Pacific Well Intervention Industry Revenue (Million), by Location of Deployment 2024 & 2032
- Figure 21: Asia Pacific Well Intervention Industry Revenue Share (%), by Location of Deployment 2024 & 2032
- Figure 22: Asia Pacific Well Intervention Industry Revenue (Million), by Country 2024 & 2032
- Figure 23: Asia Pacific Well Intervention Industry Revenue Share (%), by Country 2024 & 2032
- Figure 24: South America Well Intervention Industry Revenue (Million), by Location of Deployment 2024 & 2032
- Figure 25: South America Well Intervention Industry Revenue Share (%), by Location of Deployment 2024 & 2032
- Figure 26: South America Well Intervention Industry Revenue (Million), by Country 2024 & 2032
- Figure 27: South America Well Intervention Industry Revenue Share (%), by Country 2024 & 2032
- Figure 28: Middle East and Africa Well Intervention Industry Revenue (Million), by Location of Deployment 2024 & 2032
- Figure 29: Middle East and Africa Well Intervention Industry Revenue Share (%), by Location of Deployment 2024 & 2032
- Figure 30: Middle East and Africa Well Intervention Industry Revenue (Million), by Country 2024 & 2032
- Figure 31: Middle East and Africa Well Intervention Industry Revenue Share (%), by Country 2024 & 2032
List of Tables
- Table 1: Global Well Intervention Industry Revenue Million Forecast, by Region 2019 & 2032
- Table 2: Global Well Intervention Industry Revenue Million Forecast, by Location of Deployment 2019 & 2032
- Table 3: Global Well Intervention Industry Revenue Million Forecast, by Region 2019 & 2032
- Table 4: Global Well Intervention Industry Revenue Million Forecast, by Country 2019 & 2032
- Table 5: United States Well Intervention Industry Revenue (Million) Forecast, by Application 2019 & 2032
- Table 6: Canada Well Intervention Industry Revenue (Million) Forecast, by Application 2019 & 2032
- Table 7: Mexico Well Intervention Industry Revenue (Million) Forecast, by Application 2019 & 2032
- Table 8: Global Well Intervention Industry Revenue Million Forecast, by Country 2019 & 2032
- Table 9: Germany Well Intervention Industry Revenue (Million) Forecast, by Application 2019 & 2032
- Table 10: United Kingdom Well Intervention Industry Revenue (Million) Forecast, by Application 2019 & 2032
- Table 11: France Well Intervention Industry Revenue (Million) Forecast, by Application 2019 & 2032
- Table 12: Spain Well Intervention Industry Revenue (Million) Forecast, by Application 2019 & 2032
- Table 13: Italy Well Intervention Industry Revenue (Million) Forecast, by Application 2019 & 2032
- Table 14: Spain Well Intervention Industry Revenue (Million) Forecast, by Application 2019 & 2032
- Table 15: Belgium Well Intervention Industry Revenue (Million) Forecast, by Application 2019 & 2032
- Table 16: Netherland Well Intervention Industry Revenue (Million) Forecast, by Application 2019 & 2032
- Table 17: Nordics Well Intervention Industry Revenue (Million) Forecast, by Application 2019 & 2032
- Table 18: Rest of Europe Well Intervention Industry Revenue (Million) Forecast, by Application 2019 & 2032
- Table 19: Global Well Intervention Industry Revenue Million Forecast, by Country 2019 & 2032
- Table 20: China Well Intervention Industry Revenue (Million) Forecast, by Application 2019 & 2032
- Table 21: Japan Well Intervention Industry Revenue (Million) Forecast, by Application 2019 & 2032
- Table 22: India Well Intervention Industry Revenue (Million) Forecast, by Application 2019 & 2032
- Table 23: South Korea Well Intervention Industry Revenue (Million) Forecast, by Application 2019 & 2032
- Table 24: Southeast Asia Well Intervention Industry Revenue (Million) Forecast, by Application 2019 & 2032
- Table 25: Australia Well Intervention Industry Revenue (Million) Forecast, by Application 2019 & 2032
- Table 26: Indonesia Well Intervention Industry Revenue (Million) Forecast, by Application 2019 & 2032
- Table 27: Phillipes Well Intervention Industry Revenue (Million) Forecast, by Application 2019 & 2032
- Table 28: Singapore Well Intervention Industry Revenue (Million) Forecast, by Application 2019 & 2032
- Table 29: Thailandc Well Intervention Industry Revenue (Million) Forecast, by Application 2019 & 2032
- Table 30: Rest of Asia Pacific Well Intervention Industry Revenue (Million) Forecast, by Application 2019 & 2032
- Table 31: Global Well Intervention Industry Revenue Million Forecast, by Country 2019 & 2032
- Table 32: Brazil Well Intervention Industry Revenue (Million) Forecast, by Application 2019 & 2032
- Table 33: Argentina Well Intervention Industry Revenue (Million) Forecast, by Application 2019 & 2032
- Table 34: Peru Well Intervention Industry Revenue (Million) Forecast, by Application 2019 & 2032
- Table 35: Chile Well Intervention Industry Revenue (Million) Forecast, by Application 2019 & 2032
- Table 36: Colombia Well Intervention Industry Revenue (Million) Forecast, by Application 2019 & 2032
- Table 37: Ecuador Well Intervention Industry Revenue (Million) Forecast, by Application 2019 & 2032
- Table 38: Venezuela Well Intervention Industry Revenue (Million) Forecast, by Application 2019 & 2032
- Table 39: Rest of South America Well Intervention Industry Revenue (Million) Forecast, by Application 2019 & 2032
- Table 40: Global Well Intervention Industry Revenue Million Forecast, by Country 2019 & 2032
- Table 41: United Arab Emirates Well Intervention Industry Revenue (Million) Forecast, by Application 2019 & 2032
- Table 42: Saudi Arabia Well Intervention Industry Revenue (Million) Forecast, by Application 2019 & 2032
- Table 43: South Africa Well Intervention Industry Revenue (Million) Forecast, by Application 2019 & 2032
- Table 44: Rest of Middle East and Africa Well Intervention Industry Revenue (Million) Forecast, by Application 2019 & 2032
- Table 45: Global Well Intervention Industry Revenue Million Forecast, by Location of Deployment 2019 & 2032
- Table 46: Global Well Intervention Industry Revenue Million Forecast, by Country 2019 & 2032
- Table 47: United States of America Well Intervention Industry Revenue (Million) Forecast, by Application 2019 & 2032
- Table 48: Canada Well Intervention Industry Revenue (Million) Forecast, by Application 2019 & 2032
- Table 49: Rest of the North America Well Intervention Industry Revenue (Million) Forecast, by Application 2019 & 2032
- Table 50: Global Well Intervention Industry Revenue Million Forecast, by Location of Deployment 2019 & 2032
- Table 51: Global Well Intervention Industry Revenue Million Forecast, by Country 2019 & 2032
- Table 52: United Kingdom Well Intervention Industry Revenue (Million) Forecast, by Application 2019 & 2032
- Table 53: France Well Intervention Industry Revenue (Million) Forecast, by Application 2019 & 2032
- Table 54: Germany Well Intervention Industry Revenue (Million) Forecast, by Application 2019 & 2032
- Table 55: Italy Well Intervention Industry Revenue (Million) Forecast, by Application 2019 & 2032
- Table 56: Rest of the Europe Well Intervention Industry Revenue (Million) Forecast, by Application 2019 & 2032
- Table 57: Global Well Intervention Industry Revenue Million Forecast, by Location of Deployment 2019 & 2032
- Table 58: Global Well Intervention Industry Revenue Million Forecast, by Country 2019 & 2032
- Table 59: China Well Intervention Industry Revenue (Million) Forecast, by Application 2019 & 2032
- Table 60: India Well Intervention Industry Revenue (Million) Forecast, by Application 2019 & 2032
- Table 61: South Korea Well Intervention Industry Revenue (Million) Forecast, by Application 2019 & 2032
- Table 62: Rest of the Asia Pacific Well Intervention Industry Revenue (Million) Forecast, by Application 2019 & 2032
- Table 63: Global Well Intervention Industry Revenue Million Forecast, by Location of Deployment 2019 & 2032
- Table 64: Global Well Intervention Industry Revenue Million Forecast, by Country 2019 & 2032
- Table 65: Brazil Well Intervention Industry Revenue (Million) Forecast, by Application 2019 & 2032
- Table 66: Argentina Well Intervention Industry Revenue (Million) Forecast, by Application 2019 & 2032
- Table 67: Rest of the South America Well Intervention Industry Revenue (Million) Forecast, by Application 2019 & 2032
- Table 68: Global Well Intervention Industry Revenue Million Forecast, by Location of Deployment 2019 & 2032
- Table 69: Global Well Intervention Industry Revenue Million Forecast, by Country 2019 & 2032
- Table 70: United Arab Emirates Well Intervention Industry Revenue (Million) Forecast, by Application 2019 & 2032
- Table 71: Saudi Arabia Well Intervention Industry Revenue (Million) Forecast, by Application 2019 & 2032
- Table 72: Rest of the Middle East and Africa Well Intervention Industry Revenue (Million) Forecast, by Application 2019 & 2032
Frequently Asked Questions
1. What is the projected Compound Annual Growth Rate (CAGR) of the Well Intervention Industry?
The projected CAGR is approximately 6.80%.
2. Which companies are prominent players in the Well Intervention Industry?
Key companies in the market include China Oilfield Services Ltd, Vallourec SA, National Oilwell Varco Inc, Baker Hughes Company, Halliburton Company, Weatherford International Ltd, Schlumberger Limited, Scientific Drilling International Inc.
3. What are the main segments of the Well Intervention Industry?
The market segments include Location of Deployment.
4. Can you provide details about the market size?
The market size is estimated to be USD 8.49 Million as of 2022.
5. What are some drivers contributing to market growth?
4.; Increased Drilling and Completion Activities.
6. What are the notable trends driving market growth?
Offshore Segment to have a Significant Market Share.
7. Are there any restraints impacting market growth?
4.; Volatility of Oil Prices.
8. Can you provide examples of recent developments in the market?
In May 2023, TechnipFMC got a contract from Equinor to provide riserless light well intervention (RLWI) services on the Norwegian Continental Shelf. The contract includes production enhancement, production data, and pre-plug-and-abandonment services with a time bond from 2024 to 2025, with options to extend for the three subsequent years.
9. What pricing options are available for accessing the report?
Pricing options include single-user, multi-user, and enterprise licenses priced at USD 4750, USD 5250, and USD 8750 respectively.
10. Is the market size provided in terms of value or volume?
The market size is provided in terms of value, measured in Million.
11. Are there any specific market keywords associated with the report?
Yes, the market keyword associated with the report is "Well Intervention Industry," which aids in identifying and referencing the specific market segment covered.
12. How do I determine which pricing option suits my needs best?
The pricing options vary based on user requirements and access needs. Individual users may opt for single-user licenses, while businesses requiring broader access may choose multi-user or enterprise licenses for cost-effective access to the report.
13. Are there any additional resources or data provided in the Well Intervention Industry report?
While the report offers comprehensive insights, it's advisable to review the specific contents or supplementary materials provided to ascertain if additional resources or data are available.
14. How can I stay updated on further developments or reports in the Well Intervention Industry?
To stay informed about further developments, trends, and reports in the Well Intervention Industry, consider subscribing to industry newsletters, following relevant companies and organizations, or regularly checking reputable industry news sources and publications.
Methodology
Step 1 - Identification of Relevant Samples Size from Population Database


Step 2 - Approaches for Defining Global Market Size (Value, Volume* & Price*)

Note*: In applicable scenarios
Step 3 - Data Sources
Primary Research
- Web Analytics
- Survey Reports
- Research Institute
- Latest Research Reports
- Opinion Leaders
Secondary Research
- Annual Reports
- White Paper
- Latest Press Release
- Industry Association
- Paid Database
- Investor Presentations

Step 4 - Data Triangulation
Involves using different sources of information in order to increase the validity of a study
These sources are likely to be stakeholders in a program - participants, other researchers, program staff, other community members, and so on.
Then we put all data in single framework & apply various statistical tools to find out the dynamic on the market.
During the analysis stage, feedback from the stakeholder groups would be compared to determine areas of agreement as well as areas of divergence
