

Key Insights
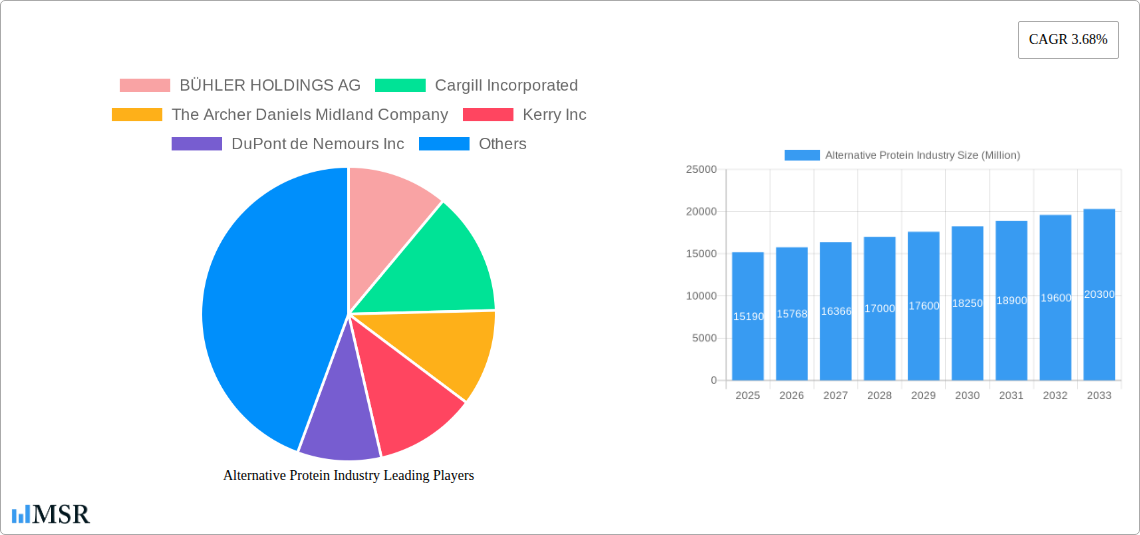
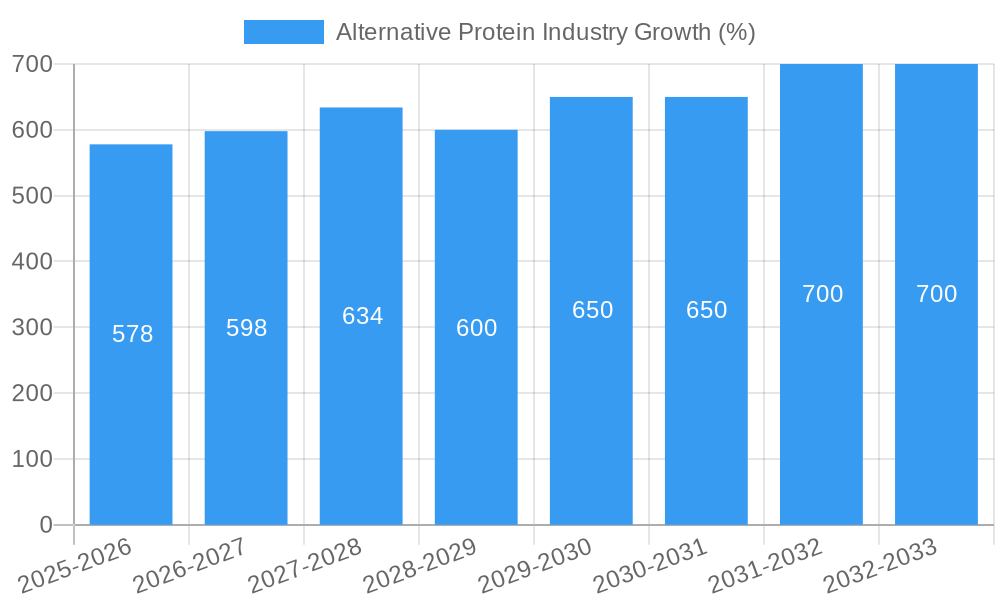
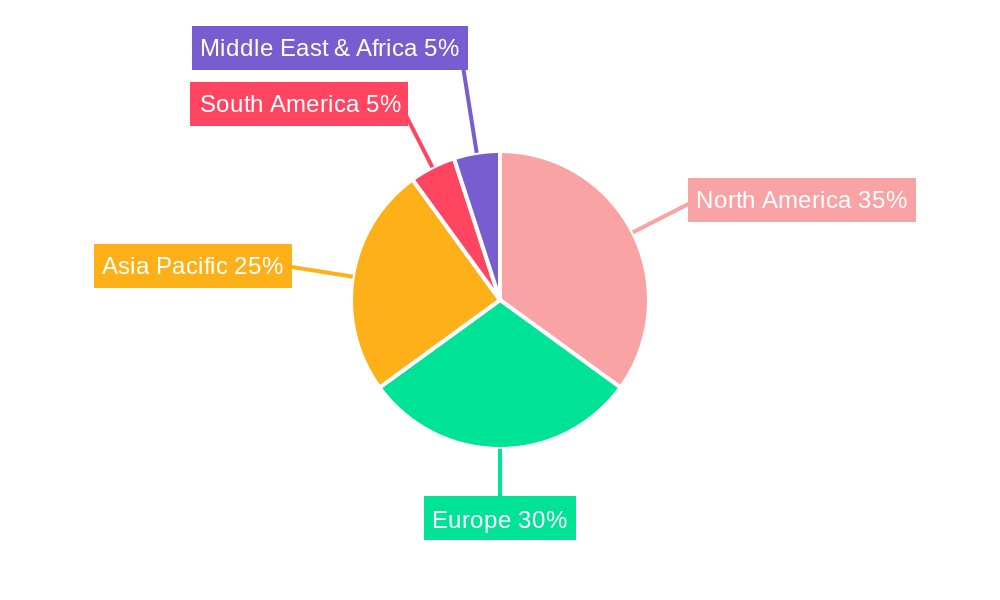
The alternative protein market, valued at $15.19 billion in 2025, is experiencing robust growth, projected to expand at a compound annual growth rate (CAGR) of 3.68% from 2025 to 2033. This surge is driven by several key factors. Increasing consumer awareness of the environmental impact of traditional meat production, coupled with growing concerns about animal welfare, is fueling demand for plant-based alternatives. Furthermore, the rising prevalence of health-conscious diets and the increasing incidence of lifestyle diseases are bolstering the adoption of plant-based proteins as healthier alternatives. Technological advancements in creating more palatable and texturally-similar meat substitutes are also significantly contributing to market expansion. Key segments include plant-based meat, dairy, and egg alternatives, sourced primarily from food and beverage, and animal feed industries. North America and Europe currently dominate the market, but the Asia-Pacific region is poised for significant growth, given its large and rapidly growing population and increasing disposable incomes. Competitive dynamics are intense, with major players like Bühler Holdings AG, Cargill Incorporated, and Archer Daniels Midland Company investing heavily in research and development, mergers, and acquisitions to strengthen their market positions. However, challenges such as consumer perception, price competitiveness compared to traditional proteins, and regulatory hurdles remain significant hurdles for market penetration.
The market's future trajectory will depend heavily on overcoming these challenges. Successful strategies will involve continued innovation in product development to address taste and texture concerns, expanding distribution channels to reach a wider consumer base, and promoting the environmental and health benefits of alternative proteins through targeted marketing campaigns. Government initiatives promoting sustainable food systems and policies supportive of the alternative protein industry will also play a crucial role in driving further market expansion. The sustained focus on improving the nutritional profile and affordability of alternative proteins is essential for achieving widespread adoption and realizing the market's full potential.
Alternative Protein Industry: A Comprehensive Market Report (2019-2033)
This comprehensive report provides an in-depth analysis of the burgeoning alternative protein industry, projecting a market valued at xx Million by 2033. Driven by increasing consumer demand for sustainable and ethical food sources, the industry is experiencing rapid growth and significant innovation. This report offers invaluable insights for stakeholders, investors, and industry professionals seeking to navigate this dynamic landscape. The study period covers 2019-2033, with a base year of 2025 and a forecast period of 2025-2033.
Alternative Protein Industry Market Concentration & Dynamics
The alternative protein market is characterized by a moderately concentrated landscape with several key players dominating specific segments. Major players such as BÜHLER HOLDINGS AG, Cargill Incorporated, The Archer Daniels Midland Company, Kerry Inc, DuPont de Nemours Inc, Glanbia PLC, Roquette Freres, Royal Avebe UA, Ingredion Incorporated, and Corbion NV hold significant market share, though the overall market exhibits a degree of fragmentation due to the emergence of numerous startups and smaller players.
Market share distribution is dynamic, influenced by factors like innovation, product differentiation, and M&A activity. While precise market share figures for each company vary by segment and year, it's observed that the top 10 players likely account for more than 60% of the global market in 2025.
Innovation Ecosystems: Significant investment in R&D drives continuous innovation in alternative protein sources (e.g., plant-based, cell-based, and insect-based proteins) and processing technologies.
Regulatory Frameworks: Regulatory landscapes vary across countries, impacting market access and product approvals. Harmonization of regulations across different regions is crucial for industry growth.
Substitute Products: Traditional animal proteins remain significant substitutes, but their market share is gradually declining.
End-User Trends: Growing consumer awareness of health, sustainability, and ethical concerns fuels the demand for alternative protein sources.
M&A Activities: The industry witnesses frequent M&A activities, reflecting the strategic moves of major players to consolidate market share and access new technologies and product lines. The number of deals reached an estimated xx in 2024, representing xx% growth compared to 2019.
Alternative Protein Industry Industry Insights & Trends
The alternative protein industry is witnessing explosive growth, with the global market size estimated at xx Million in 2025. Driven by factors such as increasing consumer demand for plant-based options, growing environmental concerns about traditional animal agriculture, and technological advancements in protein production, the industry is projected to exhibit a compound annual growth rate (CAGR) of xx% from 2025 to 2033. The market is expanding across various segments, including plant-based meat, dairy alternatives, and egg replacements, with innovations in taste, texture, and nutritional profile driving adoption. The rising prevalence of veganism and vegetarianism is further boosting market expansion. Technological disruptions, such as precision fermentation and cultured meat technologies, are poised to revolutionize the industry in the coming years, enhancing scalability and efficiency.
Furthermore, shifting consumer preferences toward healthier and more sustainable food choices are contributing significantly to the industry's growth. The growing awareness of the environmental impact of traditional livestock farming is further fueling the demand for alternative protein sources, as consumers are increasingly seeking options that have a lower carbon footprint.
Key Markets & Segments Leading Alternative Protein Industry
The alternative protein industry shows significant growth potential across various regions, with North America and Europe currently leading the market. However, Asia-Pacific is projected to experience the fastest growth in the coming years due to rising disposable incomes and changing dietary patterns.
By Source:
- Plant-based: This segment dominates the market, encompassing soy, pea, rice, and other plant-based proteins. Growth is driven by increasing consumer acceptance and advancements in product development.
- Animal feed industries: Alternative proteins are gaining traction as sustainable and cost-effective alternatives in animal feed.
By Application:
- Plant-based meat: This segment is witnessing the highest growth, with significant innovation in product development mimicking the texture and taste of traditional meat products.
- Dairy alternatives: Plant-based milk, yogurt, and cheese alternatives are gaining widespread popularity due to their health and ethical appeal.
- Egg alternatives: Plant-based egg replacements are increasingly used in baking and other applications, driven by concerns about animal welfare and food allergies.
Drivers of Market Dominance:
- Economic growth: Increasing disposable incomes in emerging markets fuel demand for premium food products.
- Changing consumer preferences: Growing awareness of health, sustainability, and ethical considerations drives adoption of alternative proteins.
- Technological advancements: Innovations in protein production and processing technologies are critical for market growth.
- Government support: Policies and initiatives promoting sustainable agriculture and food security are creating favorable market conditions.
Alternative Protein Industry Product Developments
Recent years have witnessed remarkable innovations in alternative protein products. Companies are continuously developing new products with enhanced taste, texture, and nutritional profiles to meet the diverse needs of consumers. Technological advancements, such as precision fermentation, enable the creation of novel protein sources with superior characteristics. This leads to improved functionality and competitiveness in various applications, ranging from meat analogs to dairy alternatives. The focus is on developing products that are indistinguishable from traditional animal-based counterparts, catering to the growing demand for sustainable and ethically produced food options.
Challenges in the Alternative Protein Industry Market
The alternative protein industry faces several challenges that could hinder its growth. High production costs are a major hurdle, particularly for cell-based and cultivated meat products. Supply chain complexities, including the sourcing of raw materials and distribution, pose additional challenges. Moreover, regulatory uncertainties in different markets can impede product launches and market entry. Finally, intense competition from established food companies and the emergence of new entrants in the space pose further challenges. These factors, if not adequately addressed, could result in a significant decrease in market penetration rate from the expected xx%.
Forces Driving Alternative Protein Industry Growth
Several factors are driving the growth of the alternative protein industry. Technological advancements, particularly in precision fermentation and plant-based protein engineering, are continuously improving the quality, cost-effectiveness, and scalability of alternative protein production. The increasing consumer demand for sustainable and ethical food sources is another major driver. Furthermore, government regulations and incentives promoting sustainable agriculture and reducing the environmental impact of food production are creating favorable conditions for industry growth. These positive forces combined can lead to a significant market expansion, with projections exceeding xx Million in the next decade.
Long-Term Growth Catalysts in the Alternative Protein Industry
Long-term growth hinges on continuous innovation in protein sources and processing technologies. Strategic partnerships between established food companies and innovative startups are crucial to accelerate development and market penetration. Expansion into new markets, particularly in developing economies with large populations and rising disposable incomes, will be key to driving future growth. The development of novel protein sources, such as insect-based proteins or single-cell proteins, will further diversify the market and cater to emerging consumer preferences.
Emerging Opportunities in Alternative Protein Industry
Emerging opportunities lie in expanding into new market segments, such as functional foods and dietary supplements. The development of personalized nutrition products tailored to specific dietary needs and health conditions presents a significant opportunity for growth. Furthermore, leveraging advanced technologies like artificial intelligence and machine learning to optimize production processes and improve product quality can provide a competitive edge. Finally, focusing on sustainable sourcing and packaging practices will attract environmentally conscious consumers and further enhance brand reputation.
Leading Players in the Alternative Protein Industry Sector
- BÜHLER HOLDINGS AG
- Cargill Incorporated
- The Archer Daniels Midland Company
- Kerry Inc
- DuPont de Nemours Inc
- Glanbia PLC
- Roquette Freres
- Royal Avebe UA
- Ingredion Incorporated
- Corbion NV
Key Milestones in Alternative Protein Industry Industry
- 2020, July: Kerry introduced 13 new plant-based, allergen-free protein options.
- 2020, October: Cargill expanded its pea protein line to European markets.
- 2021, December: ADM acquired Sojaprotein, a European non-GMO soy ingredient provider.
Strategic Outlook for Alternative Protein Industry Market
The alternative protein industry presents significant growth potential in the coming years, driven by continuous technological advancements, evolving consumer preferences, and favorable regulatory frameworks. Strategic partnerships and M&A activities will play a crucial role in shaping the market landscape. Companies focusing on product innovation, sustainable sourcing, and efficient production processes are expected to gain a competitive edge. The market is poised for significant expansion, presenting considerable opportunities for investors and industry players willing to embrace the challenges and capitalize on the industry’s growth potential. This market is expected to reach xx Million by 2033, demonstrating a strong positive growth trajectory.
Alternative Protein Industry Segmentation
-
1. Source
-
1.1. Plant Protein
- 1.1.1. Soy Protein
- 1.1.2. Wheat Protein
- 1.1.3. Pea Protein
- 1.1.4. Other Plant Proteins
- 1.2. Mycoprotein
- 1.3. Algal protein
- 1.4. Insect Protein
-
1.1. Plant Protein
-
2. Application
-
2.1. Food and Beverage
- 2.1.1. Bakery
- 2.1.2. Confectionery
- 2.1.3. Plant-Based Dairy Products
- 2.1.4. Beverages
- 2.1.5. Other Food and Beverages
- 2.2. Dietary Supplements
- 2.3. Animal Feed and Pet Food
- 2.4. Personal Care and Cosmetics
-
2.1. Food and Beverage
Alternative Protein Industry Segmentation By Geography
-
1. North America
- 1.1. United States
- 1.2. Canada
- 1.3. Mexico
- 1.4. Rest of North America
-
2. Europe
- 2.1. Spain
- 2.2. United Kingdom
- 2.3. Germany
- 2.4. France
- 2.5. Italy
- 2.6. Russia
- 2.7. Rest of Europe
-
3. Asia Pacific
- 3.1. China
- 3.2. Japan
- 3.3. India
- 3.4. Australia
- 3.5. Rest of Asia Pacific
-
4. South America
- 4.1. Brazil
- 4.2. Argentina
- 4.3. Rest of South America
-
5. Middle East and Africa
- 5.1. South Africa
- 5.2. Saudi Arabia
- 5.3. Rest of Middle East and Africa
Alternative Protein Industry REPORT HIGHLIGHTS
| Aspects | Details |
|---|---|
| Study Period | 2019-2033 |
| Base Year | 2024 |
| Estimated Year | 2025 |
| Forecast Period | 2025-2033 |
| Historical Period | 2019-2024 |
| Growth Rate | CAGR of 3.68% from 2019-2033 |
| Segmentation |
|
Table of Contents
- 1. Introduction
- 1.1. Research Scope
- 1.2. Market Segmentation
- 1.3. Research Methodology
- 1.4. Definitions and Assumptions
- 2. Executive Summary
- 2.1. Introduction
- 3. Market Dynamics
- 3.1. Introduction
- 3.2. Market Drivers
- 3.2.1. Increasing Demand for Vegan Food & Beverages Driving the Market; Intolerance and Allergies Associated with Animal Protein Products
- 3.3. Market Restrains
- 3.3.1. High Market Penetration of Animal Protein
- 3.4. Market Trends
- 3.4.1. Growing Preference For Plant-Based Protein Products
- 4. Market Factor Analysis
- 4.1. Porters Five Forces
- 4.2. Supply/Value Chain
- 4.3. PESTEL analysis
- 4.4. Market Entropy
- 4.5. Patent/Trademark Analysis
- 5. Global Alternative Protein Industry Analysis, Insights and Forecast, 2019-2031
- 5.1. Market Analysis, Insights and Forecast - by Source
- 5.1.1. Plant Protein
- 5.1.1.1. Soy Protein
- 5.1.1.2. Wheat Protein
- 5.1.1.3. Pea Protein
- 5.1.1.4. Other Plant Proteins
- 5.1.2. Mycoprotein
- 5.1.3. Algal protein
- 5.1.4. Insect Protein
- 5.1.1. Plant Protein
- 5.2. Market Analysis, Insights and Forecast - by Application
- 5.2.1. Food and Beverage
- 5.2.1.1. Bakery
- 5.2.1.2. Confectionery
- 5.2.1.3. Plant-Based Dairy Products
- 5.2.1.4. Beverages
- 5.2.1.5. Other Food and Beverages
- 5.2.2. Dietary Supplements
- 5.2.3. Animal Feed and Pet Food
- 5.2.4. Personal Care and Cosmetics
- 5.2.1. Food and Beverage
- 5.3. Market Analysis, Insights and Forecast - by Region
- 5.3.1. North America
- 5.3.2. Europe
- 5.3.3. Asia Pacific
- 5.3.4. South America
- 5.3.5. Middle East and Africa
- 5.1. Market Analysis, Insights and Forecast - by Source
- 6. North America Alternative Protein Industry Analysis, Insights and Forecast, 2019-2031
- 6.1. Market Analysis, Insights and Forecast - by Source
- 6.1.1. Plant Protein
- 6.1.1.1. Soy Protein
- 6.1.1.2. Wheat Protein
- 6.1.1.3. Pea Protein
- 6.1.1.4. Other Plant Proteins
- 6.1.2. Mycoprotein
- 6.1.3. Algal protein
- 6.1.4. Insect Protein
- 6.1.1. Plant Protein
- 6.2. Market Analysis, Insights and Forecast - by Application
- 6.2.1. Food and Beverage
- 6.2.1.1. Bakery
- 6.2.1.2. Confectionery
- 6.2.1.3. Plant-Based Dairy Products
- 6.2.1.4. Beverages
- 6.2.1.5. Other Food and Beverages
- 6.2.2. Dietary Supplements
- 6.2.3. Animal Feed and Pet Food
- 6.2.4. Personal Care and Cosmetics
- 6.2.1. Food and Beverage
- 6.1. Market Analysis, Insights and Forecast - by Source
- 7. Europe Alternative Protein Industry Analysis, Insights and Forecast, 2019-2031
- 7.1. Market Analysis, Insights and Forecast - by Source
- 7.1.1. Plant Protein
- 7.1.1.1. Soy Protein
- 7.1.1.2. Wheat Protein
- 7.1.1.3. Pea Protein
- 7.1.1.4. Other Plant Proteins
- 7.1.2. Mycoprotein
- 7.1.3. Algal protein
- 7.1.4. Insect Protein
- 7.1.1. Plant Protein
- 7.2. Market Analysis, Insights and Forecast - by Application
- 7.2.1. Food and Beverage
- 7.2.1.1. Bakery
- 7.2.1.2. Confectionery
- 7.2.1.3. Plant-Based Dairy Products
- 7.2.1.4. Beverages
- 7.2.1.5. Other Food and Beverages
- 7.2.2. Dietary Supplements
- 7.2.3. Animal Feed and Pet Food
- 7.2.4. Personal Care and Cosmetics
- 7.2.1. Food and Beverage
- 7.1. Market Analysis, Insights and Forecast - by Source
- 8. Asia Pacific Alternative Protein Industry Analysis, Insights and Forecast, 2019-2031
- 8.1. Market Analysis, Insights and Forecast - by Source
- 8.1.1. Plant Protein
- 8.1.1.1. Soy Protein
- 8.1.1.2. Wheat Protein
- 8.1.1.3. Pea Protein
- 8.1.1.4. Other Plant Proteins
- 8.1.2. Mycoprotein
- 8.1.3. Algal protein
- 8.1.4. Insect Protein
- 8.1.1. Plant Protein
- 8.2. Market Analysis, Insights and Forecast - by Application
- 8.2.1. Food and Beverage
- 8.2.1.1. Bakery
- 8.2.1.2. Confectionery
- 8.2.1.3. Plant-Based Dairy Products
- 8.2.1.4. Beverages
- 8.2.1.5. Other Food and Beverages
- 8.2.2. Dietary Supplements
- 8.2.3. Animal Feed and Pet Food
- 8.2.4. Personal Care and Cosmetics
- 8.2.1. Food and Beverage
- 8.1. Market Analysis, Insights and Forecast - by Source
- 9. South America Alternative Protein Industry Analysis, Insights and Forecast, 2019-2031
- 9.1. Market Analysis, Insights and Forecast - by Source
- 9.1.1. Plant Protein
- 9.1.1.1. Soy Protein
- 9.1.1.2. Wheat Protein
- 9.1.1.3. Pea Protein
- 9.1.1.4. Other Plant Proteins
- 9.1.2. Mycoprotein
- 9.1.3. Algal protein
- 9.1.4. Insect Protein
- 9.1.1. Plant Protein
- 9.2. Market Analysis, Insights and Forecast - by Application
- 9.2.1. Food and Beverage
- 9.2.1.1. Bakery
- 9.2.1.2. Confectionery
- 9.2.1.3. Plant-Based Dairy Products
- 9.2.1.4. Beverages
- 9.2.1.5. Other Food and Beverages
- 9.2.2. Dietary Supplements
- 9.2.3. Animal Feed and Pet Food
- 9.2.4. Personal Care and Cosmetics
- 9.2.1. Food and Beverage
- 9.1. Market Analysis, Insights and Forecast - by Source
- 10. Middle East and Africa Alternative Protein Industry Analysis, Insights and Forecast, 2019-2031
- 10.1. Market Analysis, Insights and Forecast - by Source
- 10.1.1. Plant Protein
- 10.1.1.1. Soy Protein
- 10.1.1.2. Wheat Protein
- 10.1.1.3. Pea Protein
- 10.1.1.4. Other Plant Proteins
- 10.1.2. Mycoprotein
- 10.1.3. Algal protein
- 10.1.4. Insect Protein
- 10.1.1. Plant Protein
- 10.2. Market Analysis, Insights and Forecast - by Application
- 10.2.1. Food and Beverage
- 10.2.1.1. Bakery
- 10.2.1.2. Confectionery
- 10.2.1.3. Plant-Based Dairy Products
- 10.2.1.4. Beverages
- 10.2.1.5. Other Food and Beverages
- 10.2.2. Dietary Supplements
- 10.2.3. Animal Feed and Pet Food
- 10.2.4. Personal Care and Cosmetics
- 10.2.1. Food and Beverage
- 10.1. Market Analysis, Insights and Forecast - by Source
- 11. North America Alternative Protein Industry Analysis, Insights and Forecast, 2019-2031
- 11.1. Market Analysis, Insights and Forecast - By Country/Sub-region
- 11.1.1 United States
- 11.1.2 Canada
- 11.1.3 Mexico
- 11.1.4 Rest of North America
- 12. Europe Alternative Protein Industry Analysis, Insights and Forecast, 2019-2031
- 12.1. Market Analysis, Insights and Forecast - By Country/Sub-region
- 12.1.1 Spain
- 12.1.2 United Kingdom
- 12.1.3 Germany
- 12.1.4 France
- 12.1.5 Italy
- 12.1.6 Russia
- 12.1.7 Rest of Europe
- 13. Asia Pacific Alternative Protein Industry Analysis, Insights and Forecast, 2019-2031
- 13.1. Market Analysis, Insights and Forecast - By Country/Sub-region
- 13.1.1 China
- 13.1.2 Japan
- 13.1.3 India
- 13.1.4 Australia
- 13.1.5 Rest of Asia Pacific
- 14. South America Alternative Protein Industry Analysis, Insights and Forecast, 2019-2031
- 14.1. Market Analysis, Insights and Forecast - By Country/Sub-region
- 14.1.1 Brazil
- 14.1.2 Argentina
- 14.1.3 Rest of South America
- 15. Middle East & Africa Alternative Protein Industry Analysis, Insights and Forecast, 2019-2031
- 15.1. Market Analysis, Insights and Forecast - By Country/Sub-region
- 15.1.1 UAE
- 15.1.2 South Africa
- 15.1.3 Saudi Arabia
- 15.1.4 Rest of MEA
- 16. Competitive Analysis
- 16.1. Global Market Share Analysis 2024
- 16.2. Company Profiles
- 16.2.1 BÜHLER HOLDINGS AG
- 16.2.1.1. Overview
- 16.2.1.2. Products
- 16.2.1.3. SWOT Analysis
- 16.2.1.4. Recent Developments
- 16.2.1.5. Financials (Based on Availability)
- 16.2.2 Cargill Incorporated
- 16.2.2.1. Overview
- 16.2.2.2. Products
- 16.2.2.3. SWOT Analysis
- 16.2.2.4. Recent Developments
- 16.2.2.5. Financials (Based on Availability)
- 16.2.3 The Archer Daniels Midland Company
- 16.2.3.1. Overview
- 16.2.3.2. Products
- 16.2.3.3. SWOT Analysis
- 16.2.3.4. Recent Developments
- 16.2.3.5. Financials (Based on Availability)
- 16.2.4 Kerry Inc
- 16.2.4.1. Overview
- 16.2.4.2. Products
- 16.2.4.3. SWOT Analysis
- 16.2.4.4. Recent Developments
- 16.2.4.5. Financials (Based on Availability)
- 16.2.5 DuPont de Nemours Inc
- 16.2.5.1. Overview
- 16.2.5.2. Products
- 16.2.5.3. SWOT Analysis
- 16.2.5.4. Recent Developments
- 16.2.5.5. Financials (Based on Availability)
- 16.2.6 Glanbia PLC
- 16.2.6.1. Overview
- 16.2.6.2. Products
- 16.2.6.3. SWOT Analysis
- 16.2.6.4. Recent Developments
- 16.2.6.5. Financials (Based on Availability)
- 16.2.7 Roquette Freres*List Not Exhaustive
- 16.2.7.1. Overview
- 16.2.7.2. Products
- 16.2.7.3. SWOT Analysis
- 16.2.7.4. Recent Developments
- 16.2.7.5. Financials (Based on Availability)
- 16.2.8 Royal Avebe UA
- 16.2.8.1. Overview
- 16.2.8.2. Products
- 16.2.8.3. SWOT Analysis
- 16.2.8.4. Recent Developments
- 16.2.8.5. Financials (Based on Availability)
- 16.2.9 Ingredion Incorporated
- 16.2.9.1. Overview
- 16.2.9.2. Products
- 16.2.9.3. SWOT Analysis
- 16.2.9.4. Recent Developments
- 16.2.9.5. Financials (Based on Availability)
- 16.2.10 Corbion NV
- 16.2.10.1. Overview
- 16.2.10.2. Products
- 16.2.10.3. SWOT Analysis
- 16.2.10.4. Recent Developments
- 16.2.10.5. Financials (Based on Availability)
- 16.2.1 BÜHLER HOLDINGS AG
List of Figures
- Figure 1: Global Alternative Protein Industry Revenue Breakdown (Million, %) by Region 2024 & 2032
- Figure 2: North America Alternative Protein Industry Revenue (Million), by Country 2024 & 2032
- Figure 3: North America Alternative Protein Industry Revenue Share (%), by Country 2024 & 2032
- Figure 4: Europe Alternative Protein Industry Revenue (Million), by Country 2024 & 2032
- Figure 5: Europe Alternative Protein Industry Revenue Share (%), by Country 2024 & 2032
- Figure 6: Asia Pacific Alternative Protein Industry Revenue (Million), by Country 2024 & 2032
- Figure 7: Asia Pacific Alternative Protein Industry Revenue Share (%), by Country 2024 & 2032
- Figure 8: South America Alternative Protein Industry Revenue (Million), by Country 2024 & 2032
- Figure 9: South America Alternative Protein Industry Revenue Share (%), by Country 2024 & 2032
- Figure 10: Middle East & Africa Alternative Protein Industry Revenue (Million), by Country 2024 & 2032
- Figure 11: Middle East & Africa Alternative Protein Industry Revenue Share (%), by Country 2024 & 2032
- Figure 12: North America Alternative Protein Industry Revenue (Million), by Source 2024 & 2032
- Figure 13: North America Alternative Protein Industry Revenue Share (%), by Source 2024 & 2032
- Figure 14: North America Alternative Protein Industry Revenue (Million), by Application 2024 & 2032
- Figure 15: North America Alternative Protein Industry Revenue Share (%), by Application 2024 & 2032
- Figure 16: North America Alternative Protein Industry Revenue (Million), by Country 2024 & 2032
- Figure 17: North America Alternative Protein Industry Revenue Share (%), by Country 2024 & 2032
- Figure 18: Europe Alternative Protein Industry Revenue (Million), by Source 2024 & 2032
- Figure 19: Europe Alternative Protein Industry Revenue Share (%), by Source 2024 & 2032
- Figure 20: Europe Alternative Protein Industry Revenue (Million), by Application 2024 & 2032
- Figure 21: Europe Alternative Protein Industry Revenue Share (%), by Application 2024 & 2032
- Figure 22: Europe Alternative Protein Industry Revenue (Million), by Country 2024 & 2032
- Figure 23: Europe Alternative Protein Industry Revenue Share (%), by Country 2024 & 2032
- Figure 24: Asia Pacific Alternative Protein Industry Revenue (Million), by Source 2024 & 2032
- Figure 25: Asia Pacific Alternative Protein Industry Revenue Share (%), by Source 2024 & 2032
- Figure 26: Asia Pacific Alternative Protein Industry Revenue (Million), by Application 2024 & 2032
- Figure 27: Asia Pacific Alternative Protein Industry Revenue Share (%), by Application 2024 & 2032
- Figure 28: Asia Pacific Alternative Protein Industry Revenue (Million), by Country 2024 & 2032
- Figure 29: Asia Pacific Alternative Protein Industry Revenue Share (%), by Country 2024 & 2032
- Figure 30: South America Alternative Protein Industry Revenue (Million), by Source 2024 & 2032
- Figure 31: South America Alternative Protein Industry Revenue Share (%), by Source 2024 & 2032
- Figure 32: South America Alternative Protein Industry Revenue (Million), by Application 2024 & 2032
- Figure 33: South America Alternative Protein Industry Revenue Share (%), by Application 2024 & 2032
- Figure 34: South America Alternative Protein Industry Revenue (Million), by Country 2024 & 2032
- Figure 35: South America Alternative Protein Industry Revenue Share (%), by Country 2024 & 2032
- Figure 36: Middle East and Africa Alternative Protein Industry Revenue (Million), by Source 2024 & 2032
- Figure 37: Middle East and Africa Alternative Protein Industry Revenue Share (%), by Source 2024 & 2032
- Figure 38: Middle East and Africa Alternative Protein Industry Revenue (Million), by Application 2024 & 2032
- Figure 39: Middle East and Africa Alternative Protein Industry Revenue Share (%), by Application 2024 & 2032
- Figure 40: Middle East and Africa Alternative Protein Industry Revenue (Million), by Country 2024 & 2032
- Figure 41: Middle East and Africa Alternative Protein Industry Revenue Share (%), by Country 2024 & 2032
List of Tables
- Table 1: Global Alternative Protein Industry Revenue Million Forecast, by Region 2019 & 2032
- Table 2: Global Alternative Protein Industry Revenue Million Forecast, by Source 2019 & 2032
- Table 3: Global Alternative Protein Industry Revenue Million Forecast, by Application 2019 & 2032
- Table 4: Global Alternative Protein Industry Revenue Million Forecast, by Region 2019 & 2032
- Table 5: Global Alternative Protein Industry Revenue Million Forecast, by Country 2019 & 2032
- Table 6: United States Alternative Protein Industry Revenue (Million) Forecast, by Application 2019 & 2032
- Table 7: Canada Alternative Protein Industry Revenue (Million) Forecast, by Application 2019 & 2032
- Table 8: Mexico Alternative Protein Industry Revenue (Million) Forecast, by Application 2019 & 2032
- Table 9: Rest of North America Alternative Protein Industry Revenue (Million) Forecast, by Application 2019 & 2032
- Table 10: Global Alternative Protein Industry Revenue Million Forecast, by Country 2019 & 2032
- Table 11: Spain Alternative Protein Industry Revenue (Million) Forecast, by Application 2019 & 2032
- Table 12: United Kingdom Alternative Protein Industry Revenue (Million) Forecast, by Application 2019 & 2032
- Table 13: Germany Alternative Protein Industry Revenue (Million) Forecast, by Application 2019 & 2032
- Table 14: France Alternative Protein Industry Revenue (Million) Forecast, by Application 2019 & 2032
- Table 15: Italy Alternative Protein Industry Revenue (Million) Forecast, by Application 2019 & 2032
- Table 16: Russia Alternative Protein Industry Revenue (Million) Forecast, by Application 2019 & 2032
- Table 17: Rest of Europe Alternative Protein Industry Revenue (Million) Forecast, by Application 2019 & 2032
- Table 18: Global Alternative Protein Industry Revenue Million Forecast, by Country 2019 & 2032
- Table 19: China Alternative Protein Industry Revenue (Million) Forecast, by Application 2019 & 2032
- Table 20: Japan Alternative Protein Industry Revenue (Million) Forecast, by Application 2019 & 2032
- Table 21: India Alternative Protein Industry Revenue (Million) Forecast, by Application 2019 & 2032
- Table 22: Australia Alternative Protein Industry Revenue (Million) Forecast, by Application 2019 & 2032
- Table 23: Rest of Asia Pacific Alternative Protein Industry Revenue (Million) Forecast, by Application 2019 & 2032
- Table 24: Global Alternative Protein Industry Revenue Million Forecast, by Country 2019 & 2032
- Table 25: Brazil Alternative Protein Industry Revenue (Million) Forecast, by Application 2019 & 2032
- Table 26: Argentina Alternative Protein Industry Revenue (Million) Forecast, by Application 2019 & 2032
- Table 27: Rest of South America Alternative Protein Industry Revenue (Million) Forecast, by Application 2019 & 2032
- Table 28: Global Alternative Protein Industry Revenue Million Forecast, by Country 2019 & 2032
- Table 29: UAE Alternative Protein Industry Revenue (Million) Forecast, by Application 2019 & 2032
- Table 30: South Africa Alternative Protein Industry Revenue (Million) Forecast, by Application 2019 & 2032
- Table 31: Saudi Arabia Alternative Protein Industry Revenue (Million) Forecast, by Application 2019 & 2032
- Table 32: Rest of MEA Alternative Protein Industry Revenue (Million) Forecast, by Application 2019 & 2032
- Table 33: Global Alternative Protein Industry Revenue Million Forecast, by Source 2019 & 2032
- Table 34: Global Alternative Protein Industry Revenue Million Forecast, by Application 2019 & 2032
- Table 35: Global Alternative Protein Industry Revenue Million Forecast, by Country 2019 & 2032
- Table 36: United States Alternative Protein Industry Revenue (Million) Forecast, by Application 2019 & 2032
- Table 37: Canada Alternative Protein Industry Revenue (Million) Forecast, by Application 2019 & 2032
- Table 38: Mexico Alternative Protein Industry Revenue (Million) Forecast, by Application 2019 & 2032
- Table 39: Rest of North America Alternative Protein Industry Revenue (Million) Forecast, by Application 2019 & 2032
- Table 40: Global Alternative Protein Industry Revenue Million Forecast, by Source 2019 & 2032
- Table 41: Global Alternative Protein Industry Revenue Million Forecast, by Application 2019 & 2032
- Table 42: Global Alternative Protein Industry Revenue Million Forecast, by Country 2019 & 2032
- Table 43: Spain Alternative Protein Industry Revenue (Million) Forecast, by Application 2019 & 2032
- Table 44: United Kingdom Alternative Protein Industry Revenue (Million) Forecast, by Application 2019 & 2032
- Table 45: Germany Alternative Protein Industry Revenue (Million) Forecast, by Application 2019 & 2032
- Table 46: France Alternative Protein Industry Revenue (Million) Forecast, by Application 2019 & 2032
- Table 47: Italy Alternative Protein Industry Revenue (Million) Forecast, by Application 2019 & 2032
- Table 48: Russia Alternative Protein Industry Revenue (Million) Forecast, by Application 2019 & 2032
- Table 49: Rest of Europe Alternative Protein Industry Revenue (Million) Forecast, by Application 2019 & 2032
- Table 50: Global Alternative Protein Industry Revenue Million Forecast, by Source 2019 & 2032
- Table 51: Global Alternative Protein Industry Revenue Million Forecast, by Application 2019 & 2032
- Table 52: Global Alternative Protein Industry Revenue Million Forecast, by Country 2019 & 2032
- Table 53: China Alternative Protein Industry Revenue (Million) Forecast, by Application 2019 & 2032
- Table 54: Japan Alternative Protein Industry Revenue (Million) Forecast, by Application 2019 & 2032
- Table 55: India Alternative Protein Industry Revenue (Million) Forecast, by Application 2019 & 2032
- Table 56: Australia Alternative Protein Industry Revenue (Million) Forecast, by Application 2019 & 2032
- Table 57: Rest of Asia Pacific Alternative Protein Industry Revenue (Million) Forecast, by Application 2019 & 2032
- Table 58: Global Alternative Protein Industry Revenue Million Forecast, by Source 2019 & 2032
- Table 59: Global Alternative Protein Industry Revenue Million Forecast, by Application 2019 & 2032
- Table 60: Global Alternative Protein Industry Revenue Million Forecast, by Country 2019 & 2032
- Table 61: Brazil Alternative Protein Industry Revenue (Million) Forecast, by Application 2019 & 2032
- Table 62: Argentina Alternative Protein Industry Revenue (Million) Forecast, by Application 2019 & 2032
- Table 63: Rest of South America Alternative Protein Industry Revenue (Million) Forecast, by Application 2019 & 2032
- Table 64: Global Alternative Protein Industry Revenue Million Forecast, by Source 2019 & 2032
- Table 65: Global Alternative Protein Industry Revenue Million Forecast, by Application 2019 & 2032
- Table 66: Global Alternative Protein Industry Revenue Million Forecast, by Country 2019 & 2032
- Table 67: South Africa Alternative Protein Industry Revenue (Million) Forecast, by Application 2019 & 2032
- Table 68: Saudi Arabia Alternative Protein Industry Revenue (Million) Forecast, by Application 2019 & 2032
- Table 69: Rest of Middle East and Africa Alternative Protein Industry Revenue (Million) Forecast, by Application 2019 & 2032
Frequently Asked Questions
1. What is the projected Compound Annual Growth Rate (CAGR) of the Alternative Protein Industry?
The projected CAGR is approximately 3.68%.
2. Which companies are prominent players in the Alternative Protein Industry?
Key companies in the market include BÜHLER HOLDINGS AG, Cargill Incorporated, The Archer Daniels Midland Company, Kerry Inc, DuPont de Nemours Inc, Glanbia PLC, Roquette Freres*List Not Exhaustive, Royal Avebe UA, Ingredion Incorporated, Corbion NV.
3. What are the main segments of the Alternative Protein Industry?
The market segments include Source, Application.
4. Can you provide details about the market size?
The market size is estimated to be USD 15.19 Million as of 2022.
5. What are some drivers contributing to market growth?
Increasing Demand for Vegan Food & Beverages Driving the Market; Intolerance and Allergies Associated with Animal Protein Products.
6. What are the notable trends driving market growth?
Growing Preference For Plant-Based Protein Products.
7. Are there any restraints impacting market growth?
High Market Penetration of Animal Protein.
8. Can you provide examples of recent developments in the market?
In 2021, ADM announced that it had reached an agreement to acquire Sojaprotein, a leading European provider of non-GMO soy ingredients.
9. What pricing options are available for accessing the report?
Pricing options include single-user, multi-user, and enterprise licenses priced at USD 4750, USD 5250, and USD 8750 respectively.
10. Is the market size provided in terms of value or volume?
The market size is provided in terms of value, measured in Million.
11. Are there any specific market keywords associated with the report?
Yes, the market keyword associated with the report is "Alternative Protein Industry," which aids in identifying and referencing the specific market segment covered.
12. How do I determine which pricing option suits my needs best?
The pricing options vary based on user requirements and access needs. Individual users may opt for single-user licenses, while businesses requiring broader access may choose multi-user or enterprise licenses for cost-effective access to the report.
13. Are there any additional resources or data provided in the Alternative Protein Industry report?
While the report offers comprehensive insights, it's advisable to review the specific contents or supplementary materials provided to ascertain if additional resources or data are available.
14. How can I stay updated on further developments or reports in the Alternative Protein Industry?
To stay informed about further developments, trends, and reports in the Alternative Protein Industry, consider subscribing to industry newsletters, following relevant companies and organizations, or regularly checking reputable industry news sources and publications.
Methodology
Step 1 - Identification of Relevant Samples Size from Population Database


Step 2 - Approaches for Defining Global Market Size (Value, Volume* & Price*)

Note*: In applicable scenarios
Step 3 - Data Sources
Primary Research
- Web Analytics
- Survey Reports
- Research Institute
- Latest Research Reports
- Opinion Leaders
Secondary Research
- Annual Reports
- White Paper
- Latest Press Release
- Industry Association
- Paid Database
- Investor Presentations

Step 4 - Data Triangulation
Involves using different sources of information in order to increase the validity of a study
These sources are likely to be stakeholders in a program - participants, other researchers, program staff, other community members, and so on.
Then we put all data in single framework & apply various statistical tools to find out the dynamic on the market.
During the analysis stage, feedback from the stakeholder groups would be compared to determine areas of agreement as well as areas of divergence
