

Key Insights
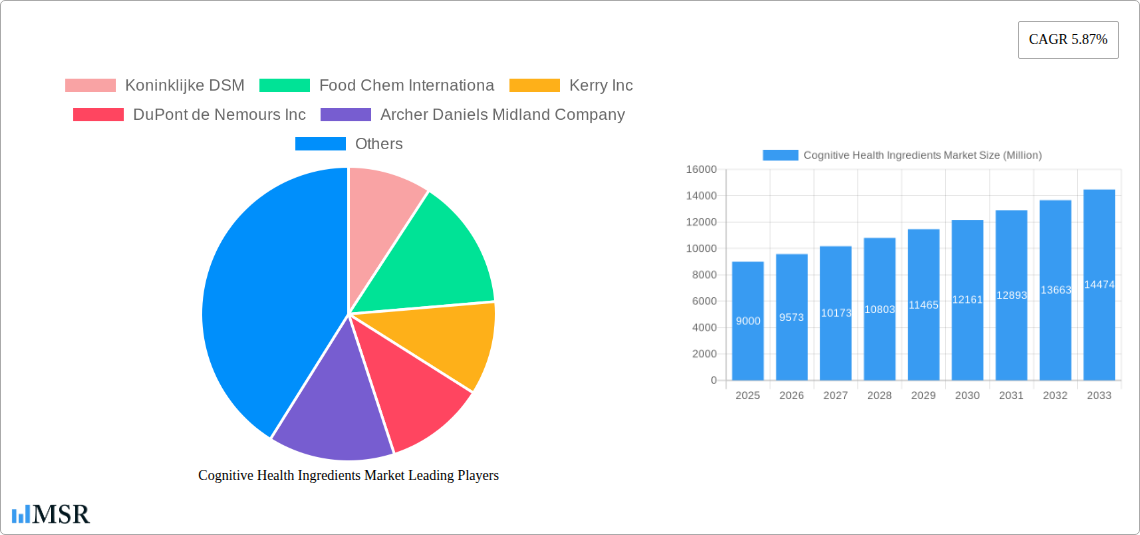
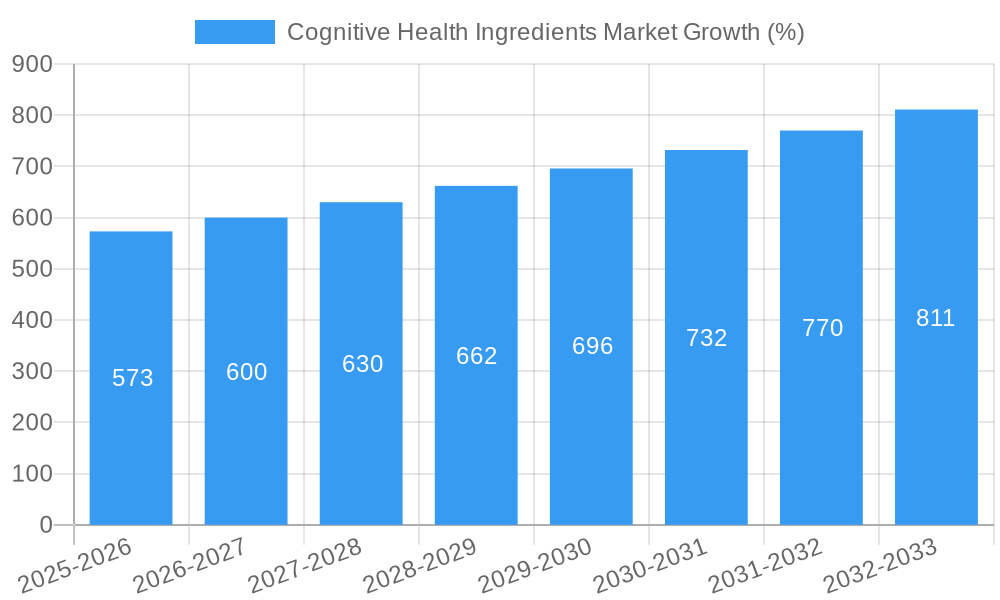
The Cognitive Health Ingredients market, currently valued at approximately $9 billion (2025), is projected to experience robust growth, exhibiting a Compound Annual Growth Rate (CAGR) of 5.87% from 2025 to 2033. This expansion is driven by several key factors. The rising global prevalence of age-related cognitive decline, including Alzheimer's disease and dementia, is fueling significant demand for effective cognitive enhancement solutions. Increasing consumer awareness of the link between diet and brain health is also a major driver, leading to greater adoption of functional foods and dietary supplements containing cognitive-enhancing ingredients. Furthermore, advancements in research and development are continuously bringing forth innovative ingredients with improved efficacy and safety profiles, further propelling market growth. Key product segments driving this expansion include vitamins and minerals (particularly B vitamins and omega-3 fatty acids), probiotics & prebiotics, and botanical extracts such as Ginkgo biloba and Bacopa monnieri. The functional food and beverage application segment is expected to witness significant growth due to increasing consumer preference for convenient and palatable delivery methods. Major players in the market, including Koninklijke DSM, Kerry Inc., and BASF SE, are strategically investing in research, product development, and acquisitions to solidify their market positions and capitalize on the growing demand. Geographic expansion, particularly in rapidly developing economies in Asia-Pacific, is also expected to contribute significantly to the overall market expansion.
The competitive landscape is characterized by a mix of large multinational corporations and smaller specialized ingredient suppliers. These companies are focusing on strategic partnerships, mergers and acquisitions, and the development of novel and scientifically-backed ingredients to gain a competitive edge. However, regulatory hurdles and concerns regarding the efficacy and safety of certain ingredients represent key restraints. The market is also influenced by fluctuating raw material prices and the increasing complexity of navigating global supply chains. Despite these challenges, the long-term outlook for the cognitive health ingredients market remains positive, driven by the growing aging population, rising healthcare expenditure, and increased consumer focus on proactive health management. The market is poised for significant expansion as consumers increasingly seek natural and effective ways to support their cognitive well-being.
Cognitive Health Ingredients Market: A Comprehensive Report (2019-2033)
This in-depth report provides a comprehensive analysis of the Cognitive Health Ingredients Market, offering actionable insights for stakeholders across the value chain. With a study period spanning 2019-2033, a base year of 2025, and a forecast period of 2025-2033, this report utilizes rigorous data analysis to illuminate key trends and opportunities. The market is projected to reach xx Million by 2033, exhibiting a CAGR of xx% during the forecast period. Leading players such as Koninklijke DSM, Food Chem International, Kerry Inc, DuPont de Nemours Inc, Archer Daniels Midland Company, BASF SE, Corbion N V, Cargill Inc, Ingredion Incorporated, and Rousselot BV are shaping market dynamics. The report analyzes key segments including Vitamins and Minerals, Omega PUFA, Probiotics & Prebiotics, Amino Acids, Proteins & Peptides, Fibers, and Botanical Extracts, across applications in Functional Food and Beverages and Dietary Supplements.
Cognitive Health Ingredients Market Market Concentration & Dynamics
The Cognitive Health Ingredients Market exhibits a moderately concentrated landscape, with the top 10 players holding an estimated xx% market share in 2025. Market concentration is influenced by factors such as economies of scale in production and distribution, strong brand recognition, and extensive R&D capabilities. Innovation within the market is driven by the development of novel ingredients with enhanced efficacy and bioavailability, as well as the exploration of new delivery systems. Stringent regulatory frameworks, particularly regarding ingredient safety and labeling, impact market dynamics. Substitute products, such as traditional herbal remedies and lifestyle changes, compete for market share, influencing consumer choices. End-user trends show a growing preference for natural and organic ingredients, prompting companies to focus on sustainable sourcing and production methods. M&A activity in the sector has been steadily increasing in recent years, with xx mergers and acquisitions recorded between 2019 and 2024. These activities reflect a strategic push to expand product portfolios, enter new markets, and enhance technological capabilities.
- Market Share: Top 10 players hold xx% in 2025.
- M&A Activity: xx deals between 2019-2024.
- Key Drivers: Innovation, consumer preference, regulatory changes.
Cognitive Health Ingredients Market Industry Insights & Trends
The Cognitive Health Ingredients Market is experiencing robust growth, driven by several key factors. The rising global prevalence of cognitive decline and age-related neurological disorders is a major propellant, fueling demand for effective cognitive enhancement solutions. Increased consumer awareness of the importance of brain health and the benefits of dietary supplements is driving adoption. Technological advancements in ingredient extraction, formulation, and delivery methods have led to the development of more potent and bioavailable products, enhancing market appeal. Furthermore, the increasing integration of cognitive health ingredients into functional foods and beverages is broadening market penetration. The market size was valued at xx Million in 2025 and is projected to reach xx Million by 2033, growing at a CAGR of xx%. Changing consumer preferences towards healthier lifestyles are contributing significantly to this growth. The increasing disposable incomes in developing economies are also creating new market opportunities. However, challenges such as stringent regulatory hurdles and fluctuations in raw material prices need to be addressed.
Key Markets & Segments Leading Cognitive Health Ingredients Market
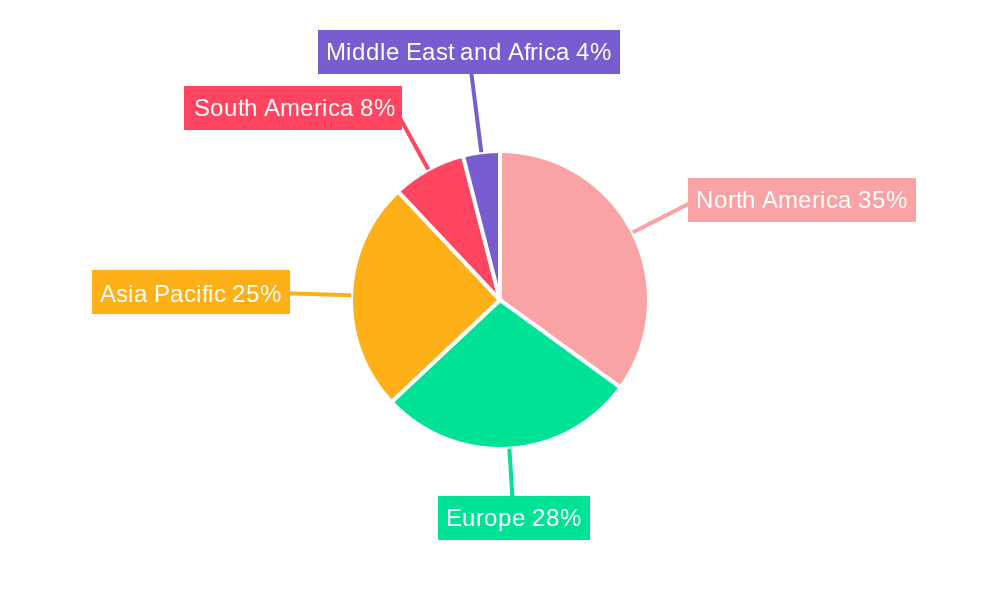
The North American region currently holds the dominant position in the Cognitive Health Ingredients Market, owing to high consumer awareness, robust regulatory frameworks, and substantial investments in research and development. Within product types, Vitamins and Minerals currently commands the largest market share due to their established efficacy and widespread availability. In terms of applications, Dietary Supplements represent a significant segment, driven by the increasing demand for targeted cognitive enhancement solutions.
Drivers for Key Segments:
- Vitamins & Minerals: Established efficacy, wide availability, cost-effectiveness.
- Omega PUFA: Growing awareness of brain health benefits, increasing demand for functional foods.
- Dietary Supplements: Targeted solutions, ease of consumption, growing consumer preference.
- North America: High consumer awareness, robust regulations, substantial R&D investment.
Dominance Analysis: North America's dominance stems from high disposable incomes, strong regulatory support for the nutraceutical industry, and increased consumer awareness of cognitive health issues. The region's advanced healthcare infrastructure and higher rate of adoption of supplements also contribute to this market leadership.
Cognitive Health Ingredients Market Product Developments
Recent years have witnessed significant product innovations in the Cognitive Health Ingredients Market, focusing on enhancing efficacy, bioavailability, and delivery systems. Technological advancements such as microencapsulation and liposomal delivery are improving the absorption and utilization of active ingredients. New product formulations are emerging that combine multiple ingredients to provide synergistic benefits for cognitive function. This focus on innovation is crucial for companies seeking a competitive edge in a dynamic marketplace.
Challenges in the Cognitive Health Ingredients Market Market
The Cognitive Health Ingredients Market faces several challenges. Strict regulatory compliance, fluctuating raw material prices, and intense competition from existing and emerging players impact profitability and growth potential. Supply chain disruptions, particularly during times of global instability, can also pose significant operational challenges. Ensuring consistent product quality and maintaining ethical sourcing practices are also crucial concerns. These factors contribute to the variability in market growth rates and profit margins across different players. The impact of these challenges is estimated to cause a slowdown of xx% in market growth in the next 5 years.
Forces Driving Cognitive Health Ingredients Market Growth
Several factors are driving the growth of the Cognitive Health Ingredients Market. Technological advancements resulting in superior ingredient delivery systems and more effective formulations are significant contributors. The growing elderly population globally is a strong driver due to increased susceptibility to cognitive decline. Increasing consumer awareness of brain health and cognitive enhancement is also a key driver. Supportive government regulations and policies that encourage the development and adoption of such products are also pivotal.
Challenges in the Cognitive Health Ingredients Market Market
Long-term growth in the Cognitive Health Ingredients Market hinges on continuous innovation in ingredient formulation and delivery, strategic partnerships across the value chain, and expansion into new and emerging markets. A focus on personalized nutrition solutions that cater to specific cognitive health needs will also be crucial in the years to come. Investment in research and development of novel ingredients will be essential for maintaining a competitive edge.
Emerging Opportunities in Cognitive Health Ingredients Market
Emerging opportunities lie in personalized nutrition solutions targeting specific cognitive health needs and leveraging advancements in genomics and nutrigenomics. Expanding into developing markets with rising disposable incomes offers significant growth potential. Functional food and beverage integration will further increase market penetration. Developing innovative delivery systems will enhance bioavailability and product appeal.
Leading Players in the Cognitive Health Ingredients Market Sector
- Koninklijke DSM
- Food Chem International
- Kerry Inc
- DuPont de Nemours Inc
- Archer Daniels Midland Company
- BASF SE
- Corbion N V
- Cargill Inc
- Ingredion Incorporated
- Rousselot BV
Key Milestones in Cognitive Health Ingredients Market Industry
- 2022: Launch of a new line of omega-3 supplements by Kerry Inc., focusing on improved bioavailability.
- 2023: Expansion of production capacity for probiotics by DuPont de Nemours Inc., to meet growing demand.
- 2024: Acquisition of a smaller botanical extracts company by Cargill Inc., enhancing its product portfolio.
Strategic Outlook for Cognitive Health Ingredients Market Market
The Cognitive Health Ingredients Market shows strong future potential, driven by a confluence of factors, including an aging global population, increasing consumer awareness of brain health, and technological advancements in product development. Strategic opportunities exist in developing personalized nutrition solutions, expanding into emerging markets, and establishing robust supply chains to ensure consistent product quality. Companies that invest in R&D and adopt innovative marketing strategies are best positioned for long-term success.
Cognitive Health Ingredients Market Segmentation
-
1. Product Type
- 1.1. Vitamins and Minerals
- 1.2. Omega PUFA
- 1.3. Probiotics & Prebiotics
- 1.4. Amino Acids, Proteins & Peptides
- 1.5. Fibers
- 1.6. Botanical Extracts
-
2. Application
- 2.1. Functional Food and Beverages
- 2.2. Dietary Supplements
Cognitive Health Ingredients Market Segmentation By Geography
-
1. North America
- 1.1. United States
- 1.2. Canada
- 1.3. Mexico
- 1.4. Rest of North America
-
2. Europe
- 2.1. Germany
- 2.2. United Kingdom
- 2.3. France
- 2.4. Russia
- 2.5. Spain
- 2.6. Italy
- 2.7. Rest of Europe
-
3. Asia Pacific
- 3.1. India
- 3.2. China
- 3.3. Japan
- 3.4. Australia
- 3.5. Rest of Asia Pacific
-
4. South America
- 4.1. Brazil
- 4.2. Argentina
- 4.3. Rest of South America
-
5. Middle East and Africa
- 5.1. South Africa
- 5.2. Saudi Arabia
- 5.3. Rest of Middle East and Africa
Cognitive Health Ingredients Market REPORT HIGHLIGHTS
| Aspects | Details |
|---|---|
| Study Period | 2019-2033 |
| Base Year | 2024 |
| Estimated Year | 2025 |
| Forecast Period | 2025-2033 |
| Historical Period | 2019-2024 |
| Growth Rate | CAGR of 5.87% from 2019-2033 |
| Segmentation |
|
Table of Contents
- 1. Introduction
- 1.1. Research Scope
- 1.2. Market Segmentation
- 1.3. Research Methodology
- 1.4. Definitions and Assumptions
- 2. Executive Summary
- 2.1. Introduction
- 3. Market Dynamics
- 3.1. Introduction
- 3.2. Market Drivers
- 3.2.1. Increasing Demand For Convenience & Processed Food
- 3.3. Market Restrains
- 3.3.1. Increased Consumer Awareness On Side-Effects Of Chemical Additives
- 3.4. Market Trends
- 3.4.1. Natural Health Ingredients Perceived to Be Highly Effective among Arthritis Patients
- 4. Market Factor Analysis
- 4.1. Porters Five Forces
- 4.2. Supply/Value Chain
- 4.3. PESTEL analysis
- 4.4. Market Entropy
- 4.5. Patent/Trademark Analysis
- 5. Global Cognitive Health Ingredients Market Analysis, Insights and Forecast, 2019-2031
- 5.1. Market Analysis, Insights and Forecast - by Product Type
- 5.1.1. Vitamins and Minerals
- 5.1.2. Omega PUFA
- 5.1.3. Probiotics & Prebiotics
- 5.1.4. Amino Acids, Proteins & Peptides
- 5.1.5. Fibers
- 5.1.6. Botanical Extracts
- 5.2. Market Analysis, Insights and Forecast - by Application
- 5.2.1. Functional Food and Beverages
- 5.2.2. Dietary Supplements
- 5.3. Market Analysis, Insights and Forecast - by Region
- 5.3.1. North America
- 5.3.2. Europe
- 5.3.3. Asia Pacific
- 5.3.4. South America
- 5.3.5. Middle East and Africa
- 5.1. Market Analysis, Insights and Forecast - by Product Type
- 6. North America Cognitive Health Ingredients Market Analysis, Insights and Forecast, 2019-2031
- 6.1. Market Analysis, Insights and Forecast - by Product Type
- 6.1.1. Vitamins and Minerals
- 6.1.2. Omega PUFA
- 6.1.3. Probiotics & Prebiotics
- 6.1.4. Amino Acids, Proteins & Peptides
- 6.1.5. Fibers
- 6.1.6. Botanical Extracts
- 6.2. Market Analysis, Insights and Forecast - by Application
- 6.2.1. Functional Food and Beverages
- 6.2.2. Dietary Supplements
- 6.1. Market Analysis, Insights and Forecast - by Product Type
- 7. Europe Cognitive Health Ingredients Market Analysis, Insights and Forecast, 2019-2031
- 7.1. Market Analysis, Insights and Forecast - by Product Type
- 7.1.1. Vitamins and Minerals
- 7.1.2. Omega PUFA
- 7.1.3. Probiotics & Prebiotics
- 7.1.4. Amino Acids, Proteins & Peptides
- 7.1.5. Fibers
- 7.1.6. Botanical Extracts
- 7.2. Market Analysis, Insights and Forecast - by Application
- 7.2.1. Functional Food and Beverages
- 7.2.2. Dietary Supplements
- 7.1. Market Analysis, Insights and Forecast - by Product Type
- 8. Asia Pacific Cognitive Health Ingredients Market Analysis, Insights and Forecast, 2019-2031
- 8.1. Market Analysis, Insights and Forecast - by Product Type
- 8.1.1. Vitamins and Minerals
- 8.1.2. Omega PUFA
- 8.1.3. Probiotics & Prebiotics
- 8.1.4. Amino Acids, Proteins & Peptides
- 8.1.5. Fibers
- 8.1.6. Botanical Extracts
- 8.2. Market Analysis, Insights and Forecast - by Application
- 8.2.1. Functional Food and Beverages
- 8.2.2. Dietary Supplements
- 8.1. Market Analysis, Insights and Forecast - by Product Type
- 9. South America Cognitive Health Ingredients Market Analysis, Insights and Forecast, 2019-2031
- 9.1. Market Analysis, Insights and Forecast - by Product Type
- 9.1.1. Vitamins and Minerals
- 9.1.2. Omega PUFA
- 9.1.3. Probiotics & Prebiotics
- 9.1.4. Amino Acids, Proteins & Peptides
- 9.1.5. Fibers
- 9.1.6. Botanical Extracts
- 9.2. Market Analysis, Insights and Forecast - by Application
- 9.2.1. Functional Food and Beverages
- 9.2.2. Dietary Supplements
- 9.1. Market Analysis, Insights and Forecast - by Product Type
- 10. Middle East and Africa Cognitive Health Ingredients Market Analysis, Insights and Forecast, 2019-2031
- 10.1. Market Analysis, Insights and Forecast - by Product Type
- 10.1.1. Vitamins and Minerals
- 10.1.2. Omega PUFA
- 10.1.3. Probiotics & Prebiotics
- 10.1.4. Amino Acids, Proteins & Peptides
- 10.1.5. Fibers
- 10.1.6. Botanical Extracts
- 10.2. Market Analysis, Insights and Forecast - by Application
- 10.2.1. Functional Food and Beverages
- 10.2.2. Dietary Supplements
- 10.1. Market Analysis, Insights and Forecast - by Product Type
- 11. North America Cognitive Health Ingredients Market Analysis, Insights and Forecast, 2019-2031
- 11.1. Market Analysis, Insights and Forecast - By Country/Sub-region
- 11.1.1 United States
- 11.1.2 Canada
- 11.1.3 Mexico
- 11.1.4 Rest of North America
- 12. Europe Cognitive Health Ingredients Market Analysis, Insights and Forecast, 2019-2031
- 12.1. Market Analysis, Insights and Forecast - By Country/Sub-region
- 12.1.1 Germany
- 12.1.2 United Kingdom
- 12.1.3 France
- 12.1.4 Russia
- 12.1.5 Spain
- 12.1.6 Italy
- 12.1.7 Rest of Europe
- 13. Asia Pacific Cognitive Health Ingredients Market Analysis, Insights and Forecast, 2019-2031
- 13.1. Market Analysis, Insights and Forecast - By Country/Sub-region
- 13.1.1 India
- 13.1.2 China
- 13.1.3 Japan
- 13.1.4 Australia
- 13.1.5 Rest of Asia Pacific
- 14. South America Cognitive Health Ingredients Market Analysis, Insights and Forecast, 2019-2031
- 14.1. Market Analysis, Insights and Forecast - By Country/Sub-region
- 14.1.1 Brazil
- 14.1.2 Argentina
- 14.1.3 Rest of South America
- 15. Middle East and Africa Cognitive Health Ingredients Market Analysis, Insights and Forecast, 2019-2031
- 15.1. Market Analysis, Insights and Forecast - By Country/Sub-region
- 15.1.1 South Africa
- 15.1.2 Saudi Arabia
- 15.1.3 Rest of Middle East and Africa
- 16. Competitive Analysis
- 16.1. Global Market Share Analysis 2024
- 16.2. Company Profiles
- 16.2.1 Koninklijke DSM
- 16.2.1.1. Overview
- 16.2.1.2. Products
- 16.2.1.3. SWOT Analysis
- 16.2.1.4. Recent Developments
- 16.2.1.5. Financials (Based on Availability)
- 16.2.2 Food Chem Internationa
- 16.2.2.1. Overview
- 16.2.2.2. Products
- 16.2.2.3. SWOT Analysis
- 16.2.2.4. Recent Developments
- 16.2.2.5. Financials (Based on Availability)
- 16.2.3 Kerry Inc
- 16.2.3.1. Overview
- 16.2.3.2. Products
- 16.2.3.3. SWOT Analysis
- 16.2.3.4. Recent Developments
- 16.2.3.5. Financials (Based on Availability)
- 16.2.4 DuPont de Nemours Inc
- 16.2.4.1. Overview
- 16.2.4.2. Products
- 16.2.4.3. SWOT Analysis
- 16.2.4.4. Recent Developments
- 16.2.4.5. Financials (Based on Availability)
- 16.2.5 Archer Daniels Midland Company
- 16.2.5.1. Overview
- 16.2.5.2. Products
- 16.2.5.3. SWOT Analysis
- 16.2.5.4. Recent Developments
- 16.2.5.5. Financials (Based on Availability)
- 16.2.6 BASF SE
- 16.2.6.1. Overview
- 16.2.6.2. Products
- 16.2.6.3. SWOT Analysis
- 16.2.6.4. Recent Developments
- 16.2.6.5. Financials (Based on Availability)
- 16.2.7 Corbion N V
- 16.2.7.1. Overview
- 16.2.7.2. Products
- 16.2.7.3. SWOT Analysis
- 16.2.7.4. Recent Developments
- 16.2.7.5. Financials (Based on Availability)
- 16.2.8 Cargill Inc
- 16.2.8.1. Overview
- 16.2.8.2. Products
- 16.2.8.3. SWOT Analysis
- 16.2.8.4. Recent Developments
- 16.2.8.5. Financials (Based on Availability)
- 16.2.9 Ingredion Incorporated
- 16.2.9.1. Overview
- 16.2.9.2. Products
- 16.2.9.3. SWOT Analysis
- 16.2.9.4. Recent Developments
- 16.2.9.5. Financials (Based on Availability)
- 16.2.10 Rousselot BV
- 16.2.10.1. Overview
- 16.2.10.2. Products
- 16.2.10.3. SWOT Analysis
- 16.2.10.4. Recent Developments
- 16.2.10.5. Financials (Based on Availability)
- 16.2.1 Koninklijke DSM
List of Figures
- Figure 1: Global Cognitive Health Ingredients Market Revenue Breakdown (Million, %) by Region 2024 & 2032
- Figure 2: Global Cognitive Health Ingredients Market Volume Breakdown (K Tons, %) by Region 2024 & 2032
- Figure 3: North America Cognitive Health Ingredients Market Revenue (Million), by Country 2024 & 2032
- Figure 4: North America Cognitive Health Ingredients Market Volume (K Tons), by Country 2024 & 2032
- Figure 5: North America Cognitive Health Ingredients Market Revenue Share (%), by Country 2024 & 2032
- Figure 6: North America Cognitive Health Ingredients Market Volume Share (%), by Country 2024 & 2032
- Figure 7: Europe Cognitive Health Ingredients Market Revenue (Million), by Country 2024 & 2032
- Figure 8: Europe Cognitive Health Ingredients Market Volume (K Tons), by Country 2024 & 2032
- Figure 9: Europe Cognitive Health Ingredients Market Revenue Share (%), by Country 2024 & 2032
- Figure 10: Europe Cognitive Health Ingredients Market Volume Share (%), by Country 2024 & 2032
- Figure 11: Asia Pacific Cognitive Health Ingredients Market Revenue (Million), by Country 2024 & 2032
- Figure 12: Asia Pacific Cognitive Health Ingredients Market Volume (K Tons), by Country 2024 & 2032
- Figure 13: Asia Pacific Cognitive Health Ingredients Market Revenue Share (%), by Country 2024 & 2032
- Figure 14: Asia Pacific Cognitive Health Ingredients Market Volume Share (%), by Country 2024 & 2032
- Figure 15: South America Cognitive Health Ingredients Market Revenue (Million), by Country 2024 & 2032
- Figure 16: South America Cognitive Health Ingredients Market Volume (K Tons), by Country 2024 & 2032
- Figure 17: South America Cognitive Health Ingredients Market Revenue Share (%), by Country 2024 & 2032
- Figure 18: South America Cognitive Health Ingredients Market Volume Share (%), by Country 2024 & 2032
- Figure 19: Middle East and Africa Cognitive Health Ingredients Market Revenue (Million), by Country 2024 & 2032
- Figure 20: Middle East and Africa Cognitive Health Ingredients Market Volume (K Tons), by Country 2024 & 2032
- Figure 21: Middle East and Africa Cognitive Health Ingredients Market Revenue Share (%), by Country 2024 & 2032
- Figure 22: Middle East and Africa Cognitive Health Ingredients Market Volume Share (%), by Country 2024 & 2032
- Figure 23: North America Cognitive Health Ingredients Market Revenue (Million), by Product Type 2024 & 2032
- Figure 24: North America Cognitive Health Ingredients Market Volume (K Tons), by Product Type 2024 & 2032
- Figure 25: North America Cognitive Health Ingredients Market Revenue Share (%), by Product Type 2024 & 2032
- Figure 26: North America Cognitive Health Ingredients Market Volume Share (%), by Product Type 2024 & 2032
- Figure 27: North America Cognitive Health Ingredients Market Revenue (Million), by Application 2024 & 2032
- Figure 28: North America Cognitive Health Ingredients Market Volume (K Tons), by Application 2024 & 2032
- Figure 29: North America Cognitive Health Ingredients Market Revenue Share (%), by Application 2024 & 2032
- Figure 30: North America Cognitive Health Ingredients Market Volume Share (%), by Application 2024 & 2032
- Figure 31: North America Cognitive Health Ingredients Market Revenue (Million), by Country 2024 & 2032
- Figure 32: North America Cognitive Health Ingredients Market Volume (K Tons), by Country 2024 & 2032
- Figure 33: North America Cognitive Health Ingredients Market Revenue Share (%), by Country 2024 & 2032
- Figure 34: North America Cognitive Health Ingredients Market Volume Share (%), by Country 2024 & 2032
- Figure 35: Europe Cognitive Health Ingredients Market Revenue (Million), by Product Type 2024 & 2032
- Figure 36: Europe Cognitive Health Ingredients Market Volume (K Tons), by Product Type 2024 & 2032
- Figure 37: Europe Cognitive Health Ingredients Market Revenue Share (%), by Product Type 2024 & 2032
- Figure 38: Europe Cognitive Health Ingredients Market Volume Share (%), by Product Type 2024 & 2032
- Figure 39: Europe Cognitive Health Ingredients Market Revenue (Million), by Application 2024 & 2032
- Figure 40: Europe Cognitive Health Ingredients Market Volume (K Tons), by Application 2024 & 2032
- Figure 41: Europe Cognitive Health Ingredients Market Revenue Share (%), by Application 2024 & 2032
- Figure 42: Europe Cognitive Health Ingredients Market Volume Share (%), by Application 2024 & 2032
- Figure 43: Europe Cognitive Health Ingredients Market Revenue (Million), by Country 2024 & 2032
- Figure 44: Europe Cognitive Health Ingredients Market Volume (K Tons), by Country 2024 & 2032
- Figure 45: Europe Cognitive Health Ingredients Market Revenue Share (%), by Country 2024 & 2032
- Figure 46: Europe Cognitive Health Ingredients Market Volume Share (%), by Country 2024 & 2032
- Figure 47: Asia Pacific Cognitive Health Ingredients Market Revenue (Million), by Product Type 2024 & 2032
- Figure 48: Asia Pacific Cognitive Health Ingredients Market Volume (K Tons), by Product Type 2024 & 2032
- Figure 49: Asia Pacific Cognitive Health Ingredients Market Revenue Share (%), by Product Type 2024 & 2032
- Figure 50: Asia Pacific Cognitive Health Ingredients Market Volume Share (%), by Product Type 2024 & 2032
- Figure 51: Asia Pacific Cognitive Health Ingredients Market Revenue (Million), by Application 2024 & 2032
- Figure 52: Asia Pacific Cognitive Health Ingredients Market Volume (K Tons), by Application 2024 & 2032
- Figure 53: Asia Pacific Cognitive Health Ingredients Market Revenue Share (%), by Application 2024 & 2032
- Figure 54: Asia Pacific Cognitive Health Ingredients Market Volume Share (%), by Application 2024 & 2032
- Figure 55: Asia Pacific Cognitive Health Ingredients Market Revenue (Million), by Country 2024 & 2032
- Figure 56: Asia Pacific Cognitive Health Ingredients Market Volume (K Tons), by Country 2024 & 2032
- Figure 57: Asia Pacific Cognitive Health Ingredients Market Revenue Share (%), by Country 2024 & 2032
- Figure 58: Asia Pacific Cognitive Health Ingredients Market Volume Share (%), by Country 2024 & 2032
- Figure 59: South America Cognitive Health Ingredients Market Revenue (Million), by Product Type 2024 & 2032
- Figure 60: South America Cognitive Health Ingredients Market Volume (K Tons), by Product Type 2024 & 2032
- Figure 61: South America Cognitive Health Ingredients Market Revenue Share (%), by Product Type 2024 & 2032
- Figure 62: South America Cognitive Health Ingredients Market Volume Share (%), by Product Type 2024 & 2032
- Figure 63: South America Cognitive Health Ingredients Market Revenue (Million), by Application 2024 & 2032
- Figure 64: South America Cognitive Health Ingredients Market Volume (K Tons), by Application 2024 & 2032
- Figure 65: South America Cognitive Health Ingredients Market Revenue Share (%), by Application 2024 & 2032
- Figure 66: South America Cognitive Health Ingredients Market Volume Share (%), by Application 2024 & 2032
- Figure 67: South America Cognitive Health Ingredients Market Revenue (Million), by Country 2024 & 2032
- Figure 68: South America Cognitive Health Ingredients Market Volume (K Tons), by Country 2024 & 2032
- Figure 69: South America Cognitive Health Ingredients Market Revenue Share (%), by Country 2024 & 2032
- Figure 70: South America Cognitive Health Ingredients Market Volume Share (%), by Country 2024 & 2032
- Figure 71: Middle East and Africa Cognitive Health Ingredients Market Revenue (Million), by Product Type 2024 & 2032
- Figure 72: Middle East and Africa Cognitive Health Ingredients Market Volume (K Tons), by Product Type 2024 & 2032
- Figure 73: Middle East and Africa Cognitive Health Ingredients Market Revenue Share (%), by Product Type 2024 & 2032
- Figure 74: Middle East and Africa Cognitive Health Ingredients Market Volume Share (%), by Product Type 2024 & 2032
- Figure 75: Middle East and Africa Cognitive Health Ingredients Market Revenue (Million), by Application 2024 & 2032
- Figure 76: Middle East and Africa Cognitive Health Ingredients Market Volume (K Tons), by Application 2024 & 2032
- Figure 77: Middle East and Africa Cognitive Health Ingredients Market Revenue Share (%), by Application 2024 & 2032
- Figure 78: Middle East and Africa Cognitive Health Ingredients Market Volume Share (%), by Application 2024 & 2032
- Figure 79: Middle East and Africa Cognitive Health Ingredients Market Revenue (Million), by Country 2024 & 2032
- Figure 80: Middle East and Africa Cognitive Health Ingredients Market Volume (K Tons), by Country 2024 & 2032
- Figure 81: Middle East and Africa Cognitive Health Ingredients Market Revenue Share (%), by Country 2024 & 2032
- Figure 82: Middle East and Africa Cognitive Health Ingredients Market Volume Share (%), by Country 2024 & 2032
List of Tables
- Table 1: Global Cognitive Health Ingredients Market Revenue Million Forecast, by Region 2019 & 2032
- Table 2: Global Cognitive Health Ingredients Market Volume K Tons Forecast, by Region 2019 & 2032
- Table 3: Global Cognitive Health Ingredients Market Revenue Million Forecast, by Product Type 2019 & 2032
- Table 4: Global Cognitive Health Ingredients Market Volume K Tons Forecast, by Product Type 2019 & 2032
- Table 5: Global Cognitive Health Ingredients Market Revenue Million Forecast, by Application 2019 & 2032
- Table 6: Global Cognitive Health Ingredients Market Volume K Tons Forecast, by Application 2019 & 2032
- Table 7: Global Cognitive Health Ingredients Market Revenue Million Forecast, by Region 2019 & 2032
- Table 8: Global Cognitive Health Ingredients Market Volume K Tons Forecast, by Region 2019 & 2032
- Table 9: Global Cognitive Health Ingredients Market Revenue Million Forecast, by Country 2019 & 2032
- Table 10: Global Cognitive Health Ingredients Market Volume K Tons Forecast, by Country 2019 & 2032
- Table 11: United States Cognitive Health Ingredients Market Revenue (Million) Forecast, by Application 2019 & 2032
- Table 12: United States Cognitive Health Ingredients Market Volume (K Tons) Forecast, by Application 2019 & 2032
- Table 13: Canada Cognitive Health Ingredients Market Revenue (Million) Forecast, by Application 2019 & 2032
- Table 14: Canada Cognitive Health Ingredients Market Volume (K Tons) Forecast, by Application 2019 & 2032
- Table 15: Mexico Cognitive Health Ingredients Market Revenue (Million) Forecast, by Application 2019 & 2032
- Table 16: Mexico Cognitive Health Ingredients Market Volume (K Tons) Forecast, by Application 2019 & 2032
- Table 17: Rest of North America Cognitive Health Ingredients Market Revenue (Million) Forecast, by Application 2019 & 2032
- Table 18: Rest of North America Cognitive Health Ingredients Market Volume (K Tons) Forecast, by Application 2019 & 2032
- Table 19: Global Cognitive Health Ingredients Market Revenue Million Forecast, by Country 2019 & 2032
- Table 20: Global Cognitive Health Ingredients Market Volume K Tons Forecast, by Country 2019 & 2032
- Table 21: Germany Cognitive Health Ingredients Market Revenue (Million) Forecast, by Application 2019 & 2032
- Table 22: Germany Cognitive Health Ingredients Market Volume (K Tons) Forecast, by Application 2019 & 2032
- Table 23: United Kingdom Cognitive Health Ingredients Market Revenue (Million) Forecast, by Application 2019 & 2032
- Table 24: United Kingdom Cognitive Health Ingredients Market Volume (K Tons) Forecast, by Application 2019 & 2032
- Table 25: France Cognitive Health Ingredients Market Revenue (Million) Forecast, by Application 2019 & 2032
- Table 26: France Cognitive Health Ingredients Market Volume (K Tons) Forecast, by Application 2019 & 2032
- Table 27: Russia Cognitive Health Ingredients Market Revenue (Million) Forecast, by Application 2019 & 2032
- Table 28: Russia Cognitive Health Ingredients Market Volume (K Tons) Forecast, by Application 2019 & 2032
- Table 29: Spain Cognitive Health Ingredients Market Revenue (Million) Forecast, by Application 2019 & 2032
- Table 30: Spain Cognitive Health Ingredients Market Volume (K Tons) Forecast, by Application 2019 & 2032
- Table 31: Italy Cognitive Health Ingredients Market Revenue (Million) Forecast, by Application 2019 & 2032
- Table 32: Italy Cognitive Health Ingredients Market Volume (K Tons) Forecast, by Application 2019 & 2032
- Table 33: Rest of Europe Cognitive Health Ingredients Market Revenue (Million) Forecast, by Application 2019 & 2032
- Table 34: Rest of Europe Cognitive Health Ingredients Market Volume (K Tons) Forecast, by Application 2019 & 2032
- Table 35: Global Cognitive Health Ingredients Market Revenue Million Forecast, by Country 2019 & 2032
- Table 36: Global Cognitive Health Ingredients Market Volume K Tons Forecast, by Country 2019 & 2032
- Table 37: India Cognitive Health Ingredients Market Revenue (Million) Forecast, by Application 2019 & 2032
- Table 38: India Cognitive Health Ingredients Market Volume (K Tons) Forecast, by Application 2019 & 2032
- Table 39: China Cognitive Health Ingredients Market Revenue (Million) Forecast, by Application 2019 & 2032
- Table 40: China Cognitive Health Ingredients Market Volume (K Tons) Forecast, by Application 2019 & 2032
- Table 41: Japan Cognitive Health Ingredients Market Revenue (Million) Forecast, by Application 2019 & 2032
- Table 42: Japan Cognitive Health Ingredients Market Volume (K Tons) Forecast, by Application 2019 & 2032
- Table 43: Australia Cognitive Health Ingredients Market Revenue (Million) Forecast, by Application 2019 & 2032
- Table 44: Australia Cognitive Health Ingredients Market Volume (K Tons) Forecast, by Application 2019 & 2032
- Table 45: Rest of Asia Pacific Cognitive Health Ingredients Market Revenue (Million) Forecast, by Application 2019 & 2032
- Table 46: Rest of Asia Pacific Cognitive Health Ingredients Market Volume (K Tons) Forecast, by Application 2019 & 2032
- Table 47: Global Cognitive Health Ingredients Market Revenue Million Forecast, by Country 2019 & 2032
- Table 48: Global Cognitive Health Ingredients Market Volume K Tons Forecast, by Country 2019 & 2032
- Table 49: Brazil Cognitive Health Ingredients Market Revenue (Million) Forecast, by Application 2019 & 2032
- Table 50: Brazil Cognitive Health Ingredients Market Volume (K Tons) Forecast, by Application 2019 & 2032
- Table 51: Argentina Cognitive Health Ingredients Market Revenue (Million) Forecast, by Application 2019 & 2032
- Table 52: Argentina Cognitive Health Ingredients Market Volume (K Tons) Forecast, by Application 2019 & 2032
- Table 53: Rest of South America Cognitive Health Ingredients Market Revenue (Million) Forecast, by Application 2019 & 2032
- Table 54: Rest of South America Cognitive Health Ingredients Market Volume (K Tons) Forecast, by Application 2019 & 2032
- Table 55: Global Cognitive Health Ingredients Market Revenue Million Forecast, by Country 2019 & 2032
- Table 56: Global Cognitive Health Ingredients Market Volume K Tons Forecast, by Country 2019 & 2032
- Table 57: South Africa Cognitive Health Ingredients Market Revenue (Million) Forecast, by Application 2019 & 2032
- Table 58: South Africa Cognitive Health Ingredients Market Volume (K Tons) Forecast, by Application 2019 & 2032
- Table 59: Saudi Arabia Cognitive Health Ingredients Market Revenue (Million) Forecast, by Application 2019 & 2032
- Table 60: Saudi Arabia Cognitive Health Ingredients Market Volume (K Tons) Forecast, by Application 2019 & 2032
- Table 61: Rest of Middle East and Africa Cognitive Health Ingredients Market Revenue (Million) Forecast, by Application 2019 & 2032
- Table 62: Rest of Middle East and Africa Cognitive Health Ingredients Market Volume (K Tons) Forecast, by Application 2019 & 2032
- Table 63: Global Cognitive Health Ingredients Market Revenue Million Forecast, by Product Type 2019 & 2032
- Table 64: Global Cognitive Health Ingredients Market Volume K Tons Forecast, by Product Type 2019 & 2032
- Table 65: Global Cognitive Health Ingredients Market Revenue Million Forecast, by Application 2019 & 2032
- Table 66: Global Cognitive Health Ingredients Market Volume K Tons Forecast, by Application 2019 & 2032
- Table 67: Global Cognitive Health Ingredients Market Revenue Million Forecast, by Country 2019 & 2032
- Table 68: Global Cognitive Health Ingredients Market Volume K Tons Forecast, by Country 2019 & 2032
- Table 69: United States Cognitive Health Ingredients Market Revenue (Million) Forecast, by Application 2019 & 2032
- Table 70: United States Cognitive Health Ingredients Market Volume (K Tons) Forecast, by Application 2019 & 2032
- Table 71: Canada Cognitive Health Ingredients Market Revenue (Million) Forecast, by Application 2019 & 2032
- Table 72: Canada Cognitive Health Ingredients Market Volume (K Tons) Forecast, by Application 2019 & 2032
- Table 73: Mexico Cognitive Health Ingredients Market Revenue (Million) Forecast, by Application 2019 & 2032
- Table 74: Mexico Cognitive Health Ingredients Market Volume (K Tons) Forecast, by Application 2019 & 2032
- Table 75: Rest of North America Cognitive Health Ingredients Market Revenue (Million) Forecast, by Application 2019 & 2032
- Table 76: Rest of North America Cognitive Health Ingredients Market Volume (K Tons) Forecast, by Application 2019 & 2032
- Table 77: Global Cognitive Health Ingredients Market Revenue Million Forecast, by Product Type 2019 & 2032
- Table 78: Global Cognitive Health Ingredients Market Volume K Tons Forecast, by Product Type 2019 & 2032
- Table 79: Global Cognitive Health Ingredients Market Revenue Million Forecast, by Application 2019 & 2032
- Table 80: Global Cognitive Health Ingredients Market Volume K Tons Forecast, by Application 2019 & 2032
- Table 81: Global Cognitive Health Ingredients Market Revenue Million Forecast, by Country 2019 & 2032
- Table 82: Global Cognitive Health Ingredients Market Volume K Tons Forecast, by Country 2019 & 2032
- Table 83: Germany Cognitive Health Ingredients Market Revenue (Million) Forecast, by Application 2019 & 2032
- Table 84: Germany Cognitive Health Ingredients Market Volume (K Tons) Forecast, by Application 2019 & 2032
- Table 85: United Kingdom Cognitive Health Ingredients Market Revenue (Million) Forecast, by Application 2019 & 2032
- Table 86: United Kingdom Cognitive Health Ingredients Market Volume (K Tons) Forecast, by Application 2019 & 2032
- Table 87: France Cognitive Health Ingredients Market Revenue (Million) Forecast, by Application 2019 & 2032
- Table 88: France Cognitive Health Ingredients Market Volume (K Tons) Forecast, by Application 2019 & 2032
- Table 89: Russia Cognitive Health Ingredients Market Revenue (Million) Forecast, by Application 2019 & 2032
- Table 90: Russia Cognitive Health Ingredients Market Volume (K Tons) Forecast, by Application 2019 & 2032
- Table 91: Spain Cognitive Health Ingredients Market Revenue (Million) Forecast, by Application 2019 & 2032
- Table 92: Spain Cognitive Health Ingredients Market Volume (K Tons) Forecast, by Application 2019 & 2032
- Table 93: Italy Cognitive Health Ingredients Market Revenue (Million) Forecast, by Application 2019 & 2032
- Table 94: Italy Cognitive Health Ingredients Market Volume (K Tons) Forecast, by Application 2019 & 2032
- Table 95: Rest of Europe Cognitive Health Ingredients Market Revenue (Million) Forecast, by Application 2019 & 2032
- Table 96: Rest of Europe Cognitive Health Ingredients Market Volume (K Tons) Forecast, by Application 2019 & 2032
- Table 97: Global Cognitive Health Ingredients Market Revenue Million Forecast, by Product Type 2019 & 2032
- Table 98: Global Cognitive Health Ingredients Market Volume K Tons Forecast, by Product Type 2019 & 2032
- Table 99: Global Cognitive Health Ingredients Market Revenue Million Forecast, by Application 2019 & 2032
- Table 100: Global Cognitive Health Ingredients Market Volume K Tons Forecast, by Application 2019 & 2032
- Table 101: Global Cognitive Health Ingredients Market Revenue Million Forecast, by Country 2019 & 2032
- Table 102: Global Cognitive Health Ingredients Market Volume K Tons Forecast, by Country 2019 & 2032
- Table 103: India Cognitive Health Ingredients Market Revenue (Million) Forecast, by Application 2019 & 2032
- Table 104: India Cognitive Health Ingredients Market Volume (K Tons) Forecast, by Application 2019 & 2032
- Table 105: China Cognitive Health Ingredients Market Revenue (Million) Forecast, by Application 2019 & 2032
- Table 106: China Cognitive Health Ingredients Market Volume (K Tons) Forecast, by Application 2019 & 2032
- Table 107: Japan Cognitive Health Ingredients Market Revenue (Million) Forecast, by Application 2019 & 2032
- Table 108: Japan Cognitive Health Ingredients Market Volume (K Tons) Forecast, by Application 2019 & 2032
- Table 109: Australia Cognitive Health Ingredients Market Revenue (Million) Forecast, by Application 2019 & 2032
- Table 110: Australia Cognitive Health Ingredients Market Volume (K Tons) Forecast, by Application 2019 & 2032
- Table 111: Rest of Asia Pacific Cognitive Health Ingredients Market Revenue (Million) Forecast, by Application 2019 & 2032
- Table 112: Rest of Asia Pacific Cognitive Health Ingredients Market Volume (K Tons) Forecast, by Application 2019 & 2032
- Table 113: Global Cognitive Health Ingredients Market Revenue Million Forecast, by Product Type 2019 & 2032
- Table 114: Global Cognitive Health Ingredients Market Volume K Tons Forecast, by Product Type 2019 & 2032
- Table 115: Global Cognitive Health Ingredients Market Revenue Million Forecast, by Application 2019 & 2032
- Table 116: Global Cognitive Health Ingredients Market Volume K Tons Forecast, by Application 2019 & 2032
- Table 117: Global Cognitive Health Ingredients Market Revenue Million Forecast, by Country 2019 & 2032
- Table 118: Global Cognitive Health Ingredients Market Volume K Tons Forecast, by Country 2019 & 2032
- Table 119: Brazil Cognitive Health Ingredients Market Revenue (Million) Forecast, by Application 2019 & 2032
- Table 120: Brazil Cognitive Health Ingredients Market Volume (K Tons) Forecast, by Application 2019 & 2032
- Table 121: Argentina Cognitive Health Ingredients Market Revenue (Million) Forecast, by Application 2019 & 2032
- Table 122: Argentina Cognitive Health Ingredients Market Volume (K Tons) Forecast, by Application 2019 & 2032
- Table 123: Rest of South America Cognitive Health Ingredients Market Revenue (Million) Forecast, by Application 2019 & 2032
- Table 124: Rest of South America Cognitive Health Ingredients Market Volume (K Tons) Forecast, by Application 2019 & 2032
- Table 125: Global Cognitive Health Ingredients Market Revenue Million Forecast, by Product Type 2019 & 2032
- Table 126: Global Cognitive Health Ingredients Market Volume K Tons Forecast, by Product Type 2019 & 2032
- Table 127: Global Cognitive Health Ingredients Market Revenue Million Forecast, by Application 2019 & 2032
- Table 128: Global Cognitive Health Ingredients Market Volume K Tons Forecast, by Application 2019 & 2032
- Table 129: Global Cognitive Health Ingredients Market Revenue Million Forecast, by Country 2019 & 2032
- Table 130: Global Cognitive Health Ingredients Market Volume K Tons Forecast, by Country 2019 & 2032
- Table 131: South Africa Cognitive Health Ingredients Market Revenue (Million) Forecast, by Application 2019 & 2032
- Table 132: South Africa Cognitive Health Ingredients Market Volume (K Tons) Forecast, by Application 2019 & 2032
- Table 133: Saudi Arabia Cognitive Health Ingredients Market Revenue (Million) Forecast, by Application 2019 & 2032
- Table 134: Saudi Arabia Cognitive Health Ingredients Market Volume (K Tons) Forecast, by Application 2019 & 2032
- Table 135: Rest of Middle East and Africa Cognitive Health Ingredients Market Revenue (Million) Forecast, by Application 2019 & 2032
- Table 136: Rest of Middle East and Africa Cognitive Health Ingredients Market Volume (K Tons) Forecast, by Application 2019 & 2032
Frequently Asked Questions
1. What is the projected Compound Annual Growth Rate (CAGR) of the Cognitive Health Ingredients Market?
The projected CAGR is approximately 5.87%.
2. Which companies are prominent players in the Cognitive Health Ingredients Market?
Key companies in the market include Koninklijke DSM, Food Chem Internationa, Kerry Inc, DuPont de Nemours Inc, Archer Daniels Midland Company, BASF SE, Corbion N V, Cargill Inc, Ingredion Incorporated, Rousselot BV.
3. What are the main segments of the Cognitive Health Ingredients Market?
The market segments include Product Type, Application.
4. Can you provide details about the market size?
The market size is estimated to be USD 9000 Million as of 2022.
5. What are some drivers contributing to market growth?
Increasing Demand For Convenience & Processed Food.
6. What are the notable trends driving market growth?
Natural Health Ingredients Perceived to Be Highly Effective among Arthritis Patients.
7. Are there any restraints impacting market growth?
Increased Consumer Awareness On Side-Effects Of Chemical Additives.
8. Can you provide examples of recent developments in the market?
The launch of new products by major players
9. What pricing options are available for accessing the report?
Pricing options include single-user, multi-user, and enterprise licenses priced at USD 4750, USD 5250, and USD 8750 respectively.
10. Is the market size provided in terms of value or volume?
The market size is provided in terms of value, measured in Million and volume, measured in K Tons.
11. Are there any specific market keywords associated with the report?
Yes, the market keyword associated with the report is "Cognitive Health Ingredients Market," which aids in identifying and referencing the specific market segment covered.
12. How do I determine which pricing option suits my needs best?
The pricing options vary based on user requirements and access needs. Individual users may opt for single-user licenses, while businesses requiring broader access may choose multi-user or enterprise licenses for cost-effective access to the report.
13. Are there any additional resources or data provided in the Cognitive Health Ingredients Market report?
While the report offers comprehensive insights, it's advisable to review the specific contents or supplementary materials provided to ascertain if additional resources or data are available.
14. How can I stay updated on further developments or reports in the Cognitive Health Ingredients Market?
To stay informed about further developments, trends, and reports in the Cognitive Health Ingredients Market, consider subscribing to industry newsletters, following relevant companies and organizations, or regularly checking reputable industry news sources and publications.
Methodology
Step 1 - Identification of Relevant Samples Size from Population Database


Step 2 - Approaches for Defining Global Market Size (Value, Volume* & Price*)

Note*: In applicable scenarios
Step 3 - Data Sources
Primary Research
- Web Analytics
- Survey Reports
- Research Institute
- Latest Research Reports
- Opinion Leaders
Secondary Research
- Annual Reports
- White Paper
- Latest Press Release
- Industry Association
- Paid Database
- Investor Presentations

Step 4 - Data Triangulation
Involves using different sources of information in order to increase the validity of a study
These sources are likely to be stakeholders in a program - participants, other researchers, program staff, other community members, and so on.
Then we put all data in single framework & apply various statistical tools to find out the dynamic on the market.
During the analysis stage, feedback from the stakeholder groups would be compared to determine areas of agreement as well as areas of divergence
