

Key Insights
The Asia-Pacific (APAC) edible meat market is experiencing robust growth, projected to reach a substantial size by 2033, driven by several key factors. Rising disposable incomes across the region, particularly in rapidly developing economies like India and Indonesia, are fueling increased meat consumption. Changing dietary habits, a shift towards Westernized diets, and the growing popularity of convenient, ready-to-eat meat products are further boosting market expansion. The thriving food service industry, including restaurants and quick-service establishments, significantly contributes to the demand for edible meat. While the canned segment holds a considerable share, the fresh/chilled segment is witnessing rapid growth due to increasing consumer preference for high-quality, fresh meat. However, the market faces challenges such as fluctuating raw material prices, concerns regarding food safety and traceability, and the impact of stringent regulations on meat processing and distribution. Specific regional variations exist; for instance, beef enjoys high demand in Australia, while poultry is a staple in many other countries. Competitive pressures from established multinational players and emerging local producers are shaping the market landscape. Strategic partnerships, product diversification, and investments in advanced processing technologies are crucial for companies to maintain a strong market position.
The market segmentation highlights significant opportunities. China and India, with their vast populations and expanding middle classes, represent key growth drivers, while countries like Australia and Japan, with established meat consumption patterns, remain important markets. The processed meat segment is expected to maintain strong growth, propelled by increasing demand for value-added products. The off-trade distribution channel currently dominates, but online meat sales and delivery services are gaining momentum, presenting new opportunities for market players. The poultry segment demonstrates particularly strong growth prospects due to its affordability and widespread acceptance across various cultural backgrounds within the region. However, potential challenges include the growing awareness of health concerns related to red meat consumption, which may influence consumer choices and the market's overall composition over the forecast period. A focus on sustainable and ethical sourcing practices will become increasingly important to meet evolving consumer demands and regulations.
APAC Edible Meat Market: A Comprehensive Report (2019-2033)
This comprehensive report provides a detailed analysis of the Asia-Pacific (APAC) edible meat market, offering invaluable insights for industry stakeholders, investors, and strategic decision-makers. The study period covers 2019-2033, with a base year of 2025 and a forecast period of 2025-2033. The report leverages extensive market research to provide actionable intelligence, including market sizing, segmentation, competitive landscape, and future growth projections. Key segments analyzed include beef, mutton, pork, poultry, and other meats, across various forms (fresh/chilled, frozen, canned, processed), distribution channels (on-trade, off-trade), and major APAC countries (Australia, China, India, Indonesia, Japan, Malaysia, South Korea, and Rest of Asia-Pacific). The report also details significant industry developments, including recent M&A activities and expansion plans from major players like Tyson Foods and Tönnies Holding.
APAC Edible Meat Market Concentration & Dynamics
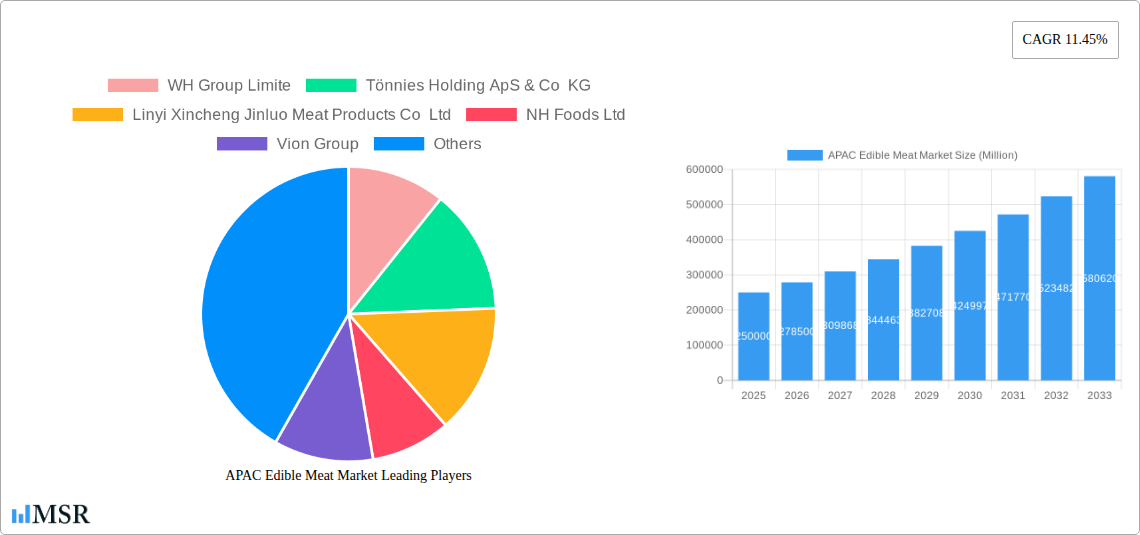
The APAC edible meat market exhibits a moderately concentrated structure, with several large players dominating specific segments and geographies. Market share analysis reveals a dynamic landscape, with companies like WH Group Limited, Tönnies Holding ApS & Co KG, and Tyson Foods Inc holding significant positions. However, regional variations are significant, with local players holding substantial shares in certain countries.
Market Concentration Metrics (2024 Estimates):
- Top 5 players' market share: xx%
- Herfindahl-Hirschman Index (HHI): xx
Innovation Ecosystems: The market shows a growing emphasis on technological advancements, particularly in processing and packaging, to enhance product quality, shelf life, and safety.
Regulatory Frameworks: Varying regulatory landscapes across APAC countries influence production standards, food safety regulations, and labeling requirements, impacting market dynamics.
Substitute Products: Plant-based meat alternatives are gaining traction, although their current market share remains relatively small, posing a potential long-term challenge.
End-User Trends: Growing urbanization, changing dietary habits (increasing meat consumption in developing economies), and rising disposable incomes are driving demand.
M&A Activities: The past few years have seen notable M&A activity, reflecting industry consolidation and expansion strategies (e.g., Tyson Foods' investments in Malaysia). The number of M&A deals in the APAC edible meat market from 2019 to 2024 is estimated at xx.
APAC Edible Meat Market Industry Insights & Trends
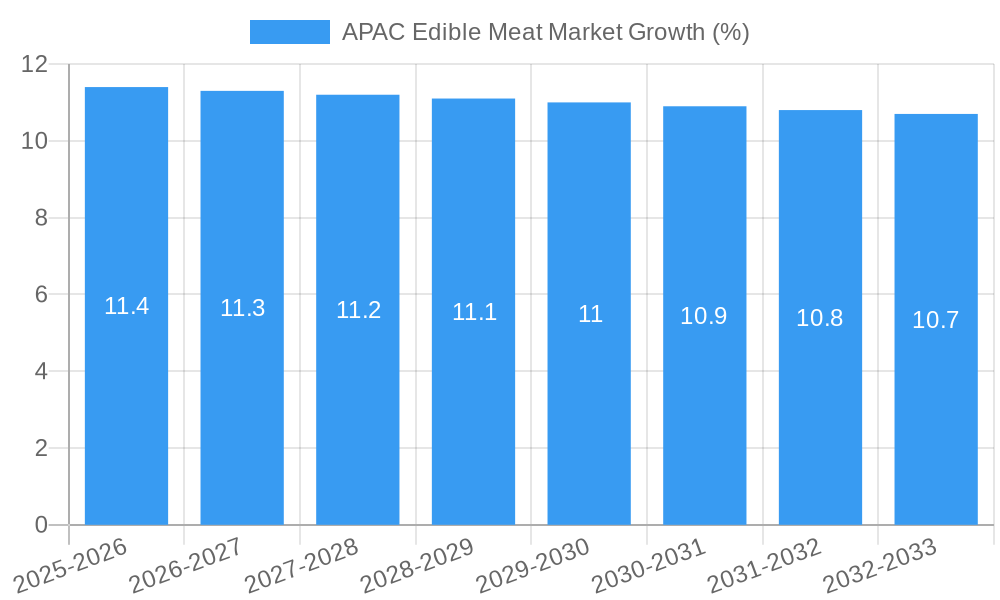
The APAC edible meat market experienced significant growth during the historical period (2019-2024), driven by factors such as rising per capita meat consumption, particularly in rapidly developing economies like India and Indonesia. The market size in 2024 is estimated at USD xx Million. The Compound Annual Growth Rate (CAGR) from 2019 to 2024 was approximately xx%. The forecast period (2025-2033) anticipates continued growth, although at a potentially slower pace due to factors like increasing awareness of health and sustainability issues. Technological disruptions, such as automation in processing and precision livestock farming, are transforming the industry, enhancing efficiency and productivity. Evolving consumer behavior, including increasing demand for convenience and ready-to-eat products, is shaping product innovation. The projected market size for 2033 is USD xx Million, with a projected CAGR of xx% during the forecast period.
Key Markets & Segments Leading APAC Edible Meat Market
Dominant Regions & Segments:
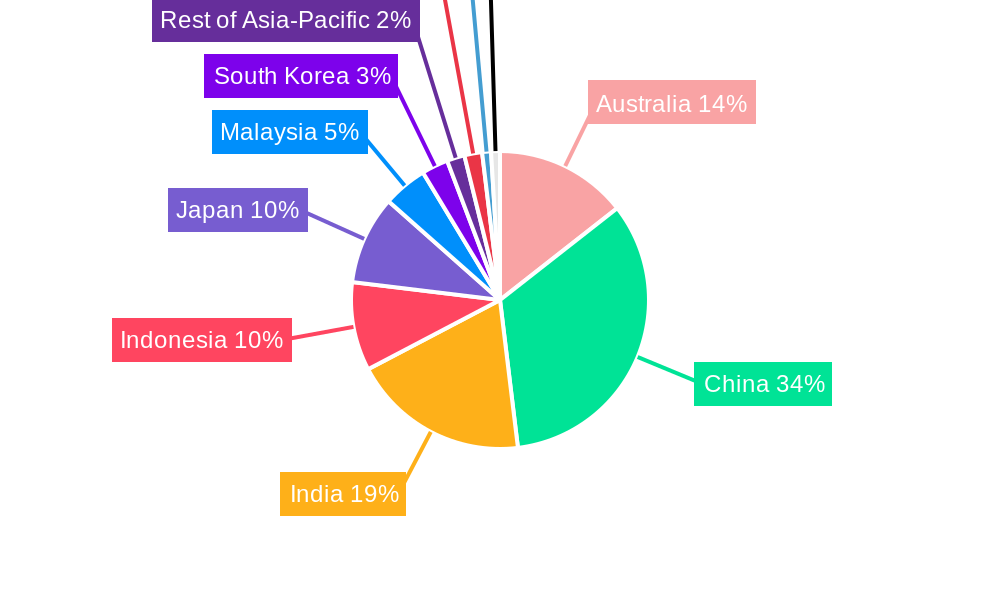
- Country: China represents the largest market within APAC, due to its vast population and increasing meat consumption. India demonstrates significant growth potential, albeit from a smaller base.
- Type: Poultry is currently the dominant meat type, followed by pork. Beef and mutton consumption varies significantly across different countries within the region.
- Form: Fresh/chilled meat holds the largest share, followed by frozen. Canned and processed meats are gaining popularity due to convenience.
- Distribution Channel: Off-trade channels (supermarkets, hypermarkets, etc.) constitute the major distribution mode.
Growth Drivers by Segment:
- China: Rapid economic growth, rising disposable incomes, and urbanization.
- India: Increasing middle class, dietary shifts towards higher meat consumption, improved cold chain infrastructure.
- Indonesia: Growing population, increasing urbanization, and a developing middle class.
- Poultry: Affordability, convenience, and versatility.
- Fresh/Chilled: Preference for freshness and quality.
APAC Edible Meat Market Product Developments
Significant product innovations are observed in the APAC edible meat market, focusing on value-added products like ready-to-eat meals, marinated meats, and processed meat snacks. These cater to the growing demand for convenience and time-saving solutions. Technological advancements such as improved packaging methods (e.g., modified atmosphere packaging) are extending shelf life and enhancing food safety. Companies are also focusing on product differentiation through unique flavor profiles and healthier options (reduced fat, organic). These innovations provide competitive advantages, allowing businesses to capture premium market segments and elevate brand recognition.
Challenges in the APAC Edible Meat Market
Several challenges hinder the growth of the APAC edible meat market. These include:
- Regulatory hurdles: Variations in food safety regulations and labeling requirements across different APAC countries create complexities for businesses operating regionally. Compliance costs and procedural differences impact operational efficiency.
- Supply chain issues: Maintaining consistent supply chains in diverse geographic regions poses challenges, potentially leading to price volatility. Cold chain infrastructure limitations in certain areas affect product quality and availability.
- Competitive pressures: The market is characterized by both intense competition among large players and the rise of new entrants, increasing pressure on pricing and profitability.
Forces Driving APAC Edible Meat Market Growth
Several factors propel the growth of the APAC edible meat market:
- Rising disposable incomes: Increased purchasing power in many APAC countries directly correlates with higher meat consumption.
- Economic growth: Overall economic progress drives demand for higher-quality protein sources, including meat.
- Technological advancements: Automation in livestock farming and meat processing enhance efficiency and productivity.
Long-Term Growth Catalysts in the APAC Edible Meat Market
Long-term growth will be spurred by strategic partnerships between established players and local producers. Expansion into new market segments (e.g., value-added ready-to-eat products) and the adoption of innovative technologies (e.g., precision livestock farming, alternative protein sources) will continue to reshape the sector. Investment in cold-chain infrastructure improvement will unlock vast growth potential in developing regions.
Emerging Opportunities in APAC Edible Meat Market
Emerging opportunities exist in the specialized meat segments (e.g., organic, free-range) driven by consumer preferences for health and ethical sourcing. The increasing integration of technology within the supply chain and retail channels (e.g., online meat delivery platforms) present new avenues for growth.
Leading Players in the APAC Edible Meat Market Sector
- WH Group Limited
- Tönnies Holding ApS & Co KG
- Linyi Xincheng Jinluo Meat Products Co Ltd
- NH Foods Ltd
- Vion Group
- Tyson Foods Inc
- Westfleisch SCE mbH
- Bid Corporation Limited
- China Yurun Food Group Ltd
- Danish Crown AmbA
- COFCO Corporation
Key Milestones in APAC Edible Meat Market Industry
- February 2021: Tyson Foods acquired a 49% stake in a Malaysian poultry business, expanding its presence in the region.
- October 2023: Tönnies Holding initiated a joint venture in Sichuan, China, for slaughterhouse and butchery facilities, signifying significant investment in the Chinese market.
- November 2023: Tyson Foods announced plans to build new production facilities in China and Thailand, and expand its Netherlands facility, adding over 100,000 tonnes of poultry capacity and creating hundreds of jobs.
Strategic Outlook for APAC Edible Meat Market
The APAC edible meat market presents a significant long-term growth opportunity. Strategic investments in sustainable practices, technological innovation, and cold chain infrastructure will be crucial for success. Companies focusing on value-added products, meeting evolving consumer preferences, and adapting to regional regulatory landscapes are best positioned to capitalize on the market's expansion potential. The market is expected to witness sustained growth, driven by increasing demand and ongoing industry consolidation.
APAC Edible Meat Market Segmentation
-
1. Type
- 1.1. Beef
- 1.2. Mutton
- 1.3. Pork
- 1.4. Poultry
- 1.5. Other Meat
-
2. Form
- 2.1. Canned
- 2.2. Fresh / Chilled
- 2.3. Frozen
- 2.4. Processed
-
3. Distribution Channel
-
3.1. Off-Trade
- 3.1.1. Convenience Stores
- 3.1.2. Online Channel
- 3.1.3. Supermarkets and Hypermarkets
- 3.1.4. Others
- 3.2. On-Trade
-
3.1. Off-Trade
APAC Edible Meat Market Segmentation By Geography
-
1. North America
- 1.1. United States
- 1.2. Canada
- 1.3. Mexico
-
2. South America
- 2.1. Brazil
- 2.2. Argentina
- 2.3. Rest of South America
-
3. Europe
- 3.1. United Kingdom
- 3.2. Germany
- 3.3. France
- 3.4. Italy
- 3.5. Spain
- 3.6. Russia
- 3.7. Benelux
- 3.8. Nordics
- 3.9. Rest of Europe
-
4. Middle East & Africa
- 4.1. Turkey
- 4.2. Israel
- 4.3. GCC
- 4.4. North Africa
- 4.5. South Africa
- 4.6. Rest of Middle East & Africa
-
5. Asia Pacific
- 5.1. China
- 5.2. India
- 5.3. Japan
- 5.4. South Korea
- 5.5. ASEAN
- 5.6. Oceania
- 5.7. Rest of Asia Pacific
APAC Edible Meat Market REPORT HIGHLIGHTS
| Aspects | Details |
|---|---|
| Study Period | 2019-2033 |
| Base Year | 2024 |
| Estimated Year | 2025 |
| Forecast Period | 2025-2033 |
| Historical Period | 2019-2024 |
| Growth Rate | CAGR of 11.45% from 2019-2033 |
| Segmentation |
|
Table of Contents
- 1. Introduction
- 1.1. Research Scope
- 1.2. Market Segmentation
- 1.3. Research Methodology
- 1.4. Definitions and Assumptions
- 2. Executive Summary
- 2.1. Introduction
- 3. Market Dynamics
- 3.1. Introduction
- 3.2. Market Drivers
- 3.2.1. Rising Trend of Ingestible Beauty Products; Growing demand for Nutrient-Enriched Cosmetic Products
- 3.3. Market Restrains
- 3.3.1. Availability of Counterfeit Beauty Supplements Products
- 3.4. Market Trends
- 3.4.1. OTHER KEY INDUSTRY TRENDS COVERED IN THE REPORT
- 4. Market Factor Analysis
- 4.1. Porters Five Forces
- 4.2. Supply/Value Chain
- 4.3. PESTEL analysis
- 4.4. Market Entropy
- 4.5. Patent/Trademark Analysis
- 5. Global APAC Edible Meat Market Analysis, Insights and Forecast, 2019-2031
- 5.1. Market Analysis, Insights and Forecast - by Type
- 5.1.1. Beef
- 5.1.2. Mutton
- 5.1.3. Pork
- 5.1.4. Poultry
- 5.1.5. Other Meat
- 5.2. Market Analysis, Insights and Forecast - by Form
- 5.2.1. Canned
- 5.2.2. Fresh / Chilled
- 5.2.3. Frozen
- 5.2.4. Processed
- 5.3. Market Analysis, Insights and Forecast - by Distribution Channel
- 5.3.1. Off-Trade
- 5.3.1.1. Convenience Stores
- 5.3.1.2. Online Channel
- 5.3.1.3. Supermarkets and Hypermarkets
- 5.3.1.4. Others
- 5.3.2. On-Trade
- 5.3.1. Off-Trade
- 5.4. Market Analysis, Insights and Forecast - by Region
- 5.4.1. North America
- 5.4.2. South America
- 5.4.3. Europe
- 5.4.4. Middle East & Africa
- 5.4.5. Asia Pacific
- 5.1. Market Analysis, Insights and Forecast - by Type
- 6. North America APAC Edible Meat Market Analysis, Insights and Forecast, 2019-2031
- 6.1. Market Analysis, Insights and Forecast - by Type
- 6.1.1. Beef
- 6.1.2. Mutton
- 6.1.3. Pork
- 6.1.4. Poultry
- 6.1.5. Other Meat
- 6.2. Market Analysis, Insights and Forecast - by Form
- 6.2.1. Canned
- 6.2.2. Fresh / Chilled
- 6.2.3. Frozen
- 6.2.4. Processed
- 6.3. Market Analysis, Insights and Forecast - by Distribution Channel
- 6.3.1. Off-Trade
- 6.3.1.1. Convenience Stores
- 6.3.1.2. Online Channel
- 6.3.1.3. Supermarkets and Hypermarkets
- 6.3.1.4. Others
- 6.3.2. On-Trade
- 6.3.1. Off-Trade
- 6.1. Market Analysis, Insights and Forecast - by Type
- 7. South America APAC Edible Meat Market Analysis, Insights and Forecast, 2019-2031
- 7.1. Market Analysis, Insights and Forecast - by Type
- 7.1.1. Beef
- 7.1.2. Mutton
- 7.1.3. Pork
- 7.1.4. Poultry
- 7.1.5. Other Meat
- 7.2. Market Analysis, Insights and Forecast - by Form
- 7.2.1. Canned
- 7.2.2. Fresh / Chilled
- 7.2.3. Frozen
- 7.2.4. Processed
- 7.3. Market Analysis, Insights and Forecast - by Distribution Channel
- 7.3.1. Off-Trade
- 7.3.1.1. Convenience Stores
- 7.3.1.2. Online Channel
- 7.3.1.3. Supermarkets and Hypermarkets
- 7.3.1.4. Others
- 7.3.2. On-Trade
- 7.3.1. Off-Trade
- 7.1. Market Analysis, Insights and Forecast - by Type
- 8. Europe APAC Edible Meat Market Analysis, Insights and Forecast, 2019-2031
- 8.1. Market Analysis, Insights and Forecast - by Type
- 8.1.1. Beef
- 8.1.2. Mutton
- 8.1.3. Pork
- 8.1.4. Poultry
- 8.1.5. Other Meat
- 8.2. Market Analysis, Insights and Forecast - by Form
- 8.2.1. Canned
- 8.2.2. Fresh / Chilled
- 8.2.3. Frozen
- 8.2.4. Processed
- 8.3. Market Analysis, Insights and Forecast - by Distribution Channel
- 8.3.1. Off-Trade
- 8.3.1.1. Convenience Stores
- 8.3.1.2. Online Channel
- 8.3.1.3. Supermarkets and Hypermarkets
- 8.3.1.4. Others
- 8.3.2. On-Trade
- 8.3.1. Off-Trade
- 8.1. Market Analysis, Insights and Forecast - by Type
- 9. Middle East & Africa APAC Edible Meat Market Analysis, Insights and Forecast, 2019-2031
- 9.1. Market Analysis, Insights and Forecast - by Type
- 9.1.1. Beef
- 9.1.2. Mutton
- 9.1.3. Pork
- 9.1.4. Poultry
- 9.1.5. Other Meat
- 9.2. Market Analysis, Insights and Forecast - by Form
- 9.2.1. Canned
- 9.2.2. Fresh / Chilled
- 9.2.3. Frozen
- 9.2.4. Processed
- 9.3. Market Analysis, Insights and Forecast - by Distribution Channel
- 9.3.1. Off-Trade
- 9.3.1.1. Convenience Stores
- 9.3.1.2. Online Channel
- 9.3.1.3. Supermarkets and Hypermarkets
- 9.3.1.4. Others
- 9.3.2. On-Trade
- 9.3.1. Off-Trade
- 9.1. Market Analysis, Insights and Forecast - by Type
- 10. Asia Pacific APAC Edible Meat Market Analysis, Insights and Forecast, 2019-2031
- 10.1. Market Analysis, Insights and Forecast - by Type
- 10.1.1. Beef
- 10.1.2. Mutton
- 10.1.3. Pork
- 10.1.4. Poultry
- 10.1.5. Other Meat
- 10.2. Market Analysis, Insights and Forecast - by Form
- 10.2.1. Canned
- 10.2.2. Fresh / Chilled
- 10.2.3. Frozen
- 10.2.4. Processed
- 10.3. Market Analysis, Insights and Forecast - by Distribution Channel
- 10.3.1. Off-Trade
- 10.3.1.1. Convenience Stores
- 10.3.1.2. Online Channel
- 10.3.1.3. Supermarkets and Hypermarkets
- 10.3.1.4. Others
- 10.3.2. On-Trade
- 10.3.1. Off-Trade
- 10.1. Market Analysis, Insights and Forecast - by Type
- 11. Brazil APAC Edible Meat Market Analysis, Insights and Forecast, 2019-2031
- 11.1. Market Analysis, Insights and Forecast - By Country/Sub-region
- 11.1.1.
- 12. Argentina APAC Edible Meat Market Analysis, Insights and Forecast, 2019-2031
- 12.1. Market Analysis, Insights and Forecast - By Country/Sub-region
- 12.1.1.
- 13. Rest of South America APAC Edible Meat Market Analysis, Insights and Forecast, 2019-2031
- 13.1. Market Analysis, Insights and Forecast - By Country/Sub-region
- 13.1.1.
- 14. Competitive Analysis
- 14.1. Global Market Share Analysis 2024
- 14.2. Company Profiles
- 14.2.1 WH Group Limite
- 14.2.1.1. Overview
- 14.2.1.2. Products
- 14.2.1.3. SWOT Analysis
- 14.2.1.4. Recent Developments
- 14.2.1.5. Financials (Based on Availability)
- 14.2.2 Tönnies Holding ApS & Co KG
- 14.2.2.1. Overview
- 14.2.2.2. Products
- 14.2.2.3. SWOT Analysis
- 14.2.2.4. Recent Developments
- 14.2.2.5. Financials (Based on Availability)
- 14.2.3 Linyi Xincheng Jinluo Meat Products Co Ltd
- 14.2.3.1. Overview
- 14.2.3.2. Products
- 14.2.3.3. SWOT Analysis
- 14.2.3.4. Recent Developments
- 14.2.3.5. Financials (Based on Availability)
- 14.2.4 NH Foods Ltd
- 14.2.4.1. Overview
- 14.2.4.2. Products
- 14.2.4.3. SWOT Analysis
- 14.2.4.4. Recent Developments
- 14.2.4.5. Financials (Based on Availability)
- 14.2.5 Vion Group
- 14.2.5.1. Overview
- 14.2.5.2. Products
- 14.2.5.3. SWOT Analysis
- 14.2.5.4. Recent Developments
- 14.2.5.5. Financials (Based on Availability)
- 14.2.6 Tyson Foods Inc
- 14.2.6.1. Overview
- 14.2.6.2. Products
- 14.2.6.3. SWOT Analysis
- 14.2.6.4. Recent Developments
- 14.2.6.5. Financials (Based on Availability)
- 14.2.7 Westfleisch SCE mbH
- 14.2.7.1. Overview
- 14.2.7.2. Products
- 14.2.7.3. SWOT Analysis
- 14.2.7.4. Recent Developments
- 14.2.7.5. Financials (Based on Availability)
- 14.2.8 Bid Corporation Limited
- 14.2.8.1. Overview
- 14.2.8.2. Products
- 14.2.8.3. SWOT Analysis
- 14.2.8.4. Recent Developments
- 14.2.8.5. Financials (Based on Availability)
- 14.2.9 China Yurun Food Group Ltd
- 14.2.9.1. Overview
- 14.2.9.2. Products
- 14.2.9.3. SWOT Analysis
- 14.2.9.4. Recent Developments
- 14.2.9.5. Financials (Based on Availability)
- 14.2.10 Danish Crown AmbA
- 14.2.10.1. Overview
- 14.2.10.2. Products
- 14.2.10.3. SWOT Analysis
- 14.2.10.4. Recent Developments
- 14.2.10.5. Financials (Based on Availability)
- 14.2.11 COFCO Corporation
- 14.2.11.1. Overview
- 14.2.11.2. Products
- 14.2.11.3. SWOT Analysis
- 14.2.11.4. Recent Developments
- 14.2.11.5. Financials (Based on Availability)
- 14.2.1 WH Group Limite
List of Figures
- Figure 1: Global APAC Edible Meat Market Revenue Breakdown (Million, %) by Region 2024 & 2032
- Figure 2: Brazil APAC Edible Meat Market Revenue (Million), by Country 2024 & 2032
- Figure 3: Brazil APAC Edible Meat Market Revenue Share (%), by Country 2024 & 2032
- Figure 4: Argentina APAC Edible Meat Market Revenue (Million), by Country 2024 & 2032
- Figure 5: Argentina APAC Edible Meat Market Revenue Share (%), by Country 2024 & 2032
- Figure 6: Rest of South America APAC Edible Meat Market Revenue (Million), by Country 2024 & 2032
- Figure 7: Rest of South America APAC Edible Meat Market Revenue Share (%), by Country 2024 & 2032
- Figure 8: North America APAC Edible Meat Market Revenue (Million), by Type 2024 & 2032
- Figure 9: North America APAC Edible Meat Market Revenue Share (%), by Type 2024 & 2032
- Figure 10: North America APAC Edible Meat Market Revenue (Million), by Form 2024 & 2032
- Figure 11: North America APAC Edible Meat Market Revenue Share (%), by Form 2024 & 2032
- Figure 12: North America APAC Edible Meat Market Revenue (Million), by Distribution Channel 2024 & 2032
- Figure 13: North America APAC Edible Meat Market Revenue Share (%), by Distribution Channel 2024 & 2032
- Figure 14: North America APAC Edible Meat Market Revenue (Million), by Country 2024 & 2032
- Figure 15: North America APAC Edible Meat Market Revenue Share (%), by Country 2024 & 2032
- Figure 16: South America APAC Edible Meat Market Revenue (Million), by Type 2024 & 2032
- Figure 17: South America APAC Edible Meat Market Revenue Share (%), by Type 2024 & 2032
- Figure 18: South America APAC Edible Meat Market Revenue (Million), by Form 2024 & 2032
- Figure 19: South America APAC Edible Meat Market Revenue Share (%), by Form 2024 & 2032
- Figure 20: South America APAC Edible Meat Market Revenue (Million), by Distribution Channel 2024 & 2032
- Figure 21: South America APAC Edible Meat Market Revenue Share (%), by Distribution Channel 2024 & 2032
- Figure 22: South America APAC Edible Meat Market Revenue (Million), by Country 2024 & 2032
- Figure 23: South America APAC Edible Meat Market Revenue Share (%), by Country 2024 & 2032
- Figure 24: Europe APAC Edible Meat Market Revenue (Million), by Type 2024 & 2032
- Figure 25: Europe APAC Edible Meat Market Revenue Share (%), by Type 2024 & 2032
- Figure 26: Europe APAC Edible Meat Market Revenue (Million), by Form 2024 & 2032
- Figure 27: Europe APAC Edible Meat Market Revenue Share (%), by Form 2024 & 2032
- Figure 28: Europe APAC Edible Meat Market Revenue (Million), by Distribution Channel 2024 & 2032
- Figure 29: Europe APAC Edible Meat Market Revenue Share (%), by Distribution Channel 2024 & 2032
- Figure 30: Europe APAC Edible Meat Market Revenue (Million), by Country 2024 & 2032
- Figure 31: Europe APAC Edible Meat Market Revenue Share (%), by Country 2024 & 2032
- Figure 32: Middle East & Africa APAC Edible Meat Market Revenue (Million), by Type 2024 & 2032
- Figure 33: Middle East & Africa APAC Edible Meat Market Revenue Share (%), by Type 2024 & 2032
- Figure 34: Middle East & Africa APAC Edible Meat Market Revenue (Million), by Form 2024 & 2032
- Figure 35: Middle East & Africa APAC Edible Meat Market Revenue Share (%), by Form 2024 & 2032
- Figure 36: Middle East & Africa APAC Edible Meat Market Revenue (Million), by Distribution Channel 2024 & 2032
- Figure 37: Middle East & Africa APAC Edible Meat Market Revenue Share (%), by Distribution Channel 2024 & 2032
- Figure 38: Middle East & Africa APAC Edible Meat Market Revenue (Million), by Country 2024 & 2032
- Figure 39: Middle East & Africa APAC Edible Meat Market Revenue Share (%), by Country 2024 & 2032
- Figure 40: Asia Pacific APAC Edible Meat Market Revenue (Million), by Type 2024 & 2032
- Figure 41: Asia Pacific APAC Edible Meat Market Revenue Share (%), by Type 2024 & 2032
- Figure 42: Asia Pacific APAC Edible Meat Market Revenue (Million), by Form 2024 & 2032
- Figure 43: Asia Pacific APAC Edible Meat Market Revenue Share (%), by Form 2024 & 2032
- Figure 44: Asia Pacific APAC Edible Meat Market Revenue (Million), by Distribution Channel 2024 & 2032
- Figure 45: Asia Pacific APAC Edible Meat Market Revenue Share (%), by Distribution Channel 2024 & 2032
- Figure 46: Asia Pacific APAC Edible Meat Market Revenue (Million), by Country 2024 & 2032
- Figure 47: Asia Pacific APAC Edible Meat Market Revenue Share (%), by Country 2024 & 2032
List of Tables
- Table 1: Global APAC Edible Meat Market Revenue Million Forecast, by Region 2019 & 2032
- Table 2: Global APAC Edible Meat Market Revenue Million Forecast, by Type 2019 & 2032
- Table 3: Global APAC Edible Meat Market Revenue Million Forecast, by Form 2019 & 2032
- Table 4: Global APAC Edible Meat Market Revenue Million Forecast, by Distribution Channel 2019 & 2032
- Table 5: Global APAC Edible Meat Market Revenue Million Forecast, by Region 2019 & 2032
- Table 6: Global APAC Edible Meat Market Revenue Million Forecast, by Country 2019 & 2032
- Table 7: APAC Edible Meat Market Revenue (Million) Forecast, by Application 2019 & 2032
- Table 8: Global APAC Edible Meat Market Revenue Million Forecast, by Country 2019 & 2032
- Table 9: APAC Edible Meat Market Revenue (Million) Forecast, by Application 2019 & 2032
- Table 10: Global APAC Edible Meat Market Revenue Million Forecast, by Country 2019 & 2032
- Table 11: APAC Edible Meat Market Revenue (Million) Forecast, by Application 2019 & 2032
- Table 12: Global APAC Edible Meat Market Revenue Million Forecast, by Type 2019 & 2032
- Table 13: Global APAC Edible Meat Market Revenue Million Forecast, by Form 2019 & 2032
- Table 14: Global APAC Edible Meat Market Revenue Million Forecast, by Distribution Channel 2019 & 2032
- Table 15: Global APAC Edible Meat Market Revenue Million Forecast, by Country 2019 & 2032
- Table 16: United States APAC Edible Meat Market Revenue (Million) Forecast, by Application 2019 & 2032
- Table 17: Canada APAC Edible Meat Market Revenue (Million) Forecast, by Application 2019 & 2032
- Table 18: Mexico APAC Edible Meat Market Revenue (Million) Forecast, by Application 2019 & 2032
- Table 19: Global APAC Edible Meat Market Revenue Million Forecast, by Type 2019 & 2032
- Table 20: Global APAC Edible Meat Market Revenue Million Forecast, by Form 2019 & 2032
- Table 21: Global APAC Edible Meat Market Revenue Million Forecast, by Distribution Channel 2019 & 2032
- Table 22: Global APAC Edible Meat Market Revenue Million Forecast, by Country 2019 & 2032
- Table 23: Brazil APAC Edible Meat Market Revenue (Million) Forecast, by Application 2019 & 2032
- Table 24: Argentina APAC Edible Meat Market Revenue (Million) Forecast, by Application 2019 & 2032
- Table 25: Rest of South America APAC Edible Meat Market Revenue (Million) Forecast, by Application 2019 & 2032
- Table 26: Global APAC Edible Meat Market Revenue Million Forecast, by Type 2019 & 2032
- Table 27: Global APAC Edible Meat Market Revenue Million Forecast, by Form 2019 & 2032
- Table 28: Global APAC Edible Meat Market Revenue Million Forecast, by Distribution Channel 2019 & 2032
- Table 29: Global APAC Edible Meat Market Revenue Million Forecast, by Country 2019 & 2032
- Table 30: United Kingdom APAC Edible Meat Market Revenue (Million) Forecast, by Application 2019 & 2032
- Table 31: Germany APAC Edible Meat Market Revenue (Million) Forecast, by Application 2019 & 2032
- Table 32: France APAC Edible Meat Market Revenue (Million) Forecast, by Application 2019 & 2032
- Table 33: Italy APAC Edible Meat Market Revenue (Million) Forecast, by Application 2019 & 2032
- Table 34: Spain APAC Edible Meat Market Revenue (Million) Forecast, by Application 2019 & 2032
- Table 35: Russia APAC Edible Meat Market Revenue (Million) Forecast, by Application 2019 & 2032
- Table 36: Benelux APAC Edible Meat Market Revenue (Million) Forecast, by Application 2019 & 2032
- Table 37: Nordics APAC Edible Meat Market Revenue (Million) Forecast, by Application 2019 & 2032
- Table 38: Rest of Europe APAC Edible Meat Market Revenue (Million) Forecast, by Application 2019 & 2032
- Table 39: Global APAC Edible Meat Market Revenue Million Forecast, by Type 2019 & 2032
- Table 40: Global APAC Edible Meat Market Revenue Million Forecast, by Form 2019 & 2032
- Table 41: Global APAC Edible Meat Market Revenue Million Forecast, by Distribution Channel 2019 & 2032
- Table 42: Global APAC Edible Meat Market Revenue Million Forecast, by Country 2019 & 2032
- Table 43: Turkey APAC Edible Meat Market Revenue (Million) Forecast, by Application 2019 & 2032
- Table 44: Israel APAC Edible Meat Market Revenue (Million) Forecast, by Application 2019 & 2032
- Table 45: GCC APAC Edible Meat Market Revenue (Million) Forecast, by Application 2019 & 2032
- Table 46: North Africa APAC Edible Meat Market Revenue (Million) Forecast, by Application 2019 & 2032
- Table 47: South Africa APAC Edible Meat Market Revenue (Million) Forecast, by Application 2019 & 2032
- Table 48: Rest of Middle East & Africa APAC Edible Meat Market Revenue (Million) Forecast, by Application 2019 & 2032
- Table 49: Global APAC Edible Meat Market Revenue Million Forecast, by Type 2019 & 2032
- Table 50: Global APAC Edible Meat Market Revenue Million Forecast, by Form 2019 & 2032
- Table 51: Global APAC Edible Meat Market Revenue Million Forecast, by Distribution Channel 2019 & 2032
- Table 52: Global APAC Edible Meat Market Revenue Million Forecast, by Country 2019 & 2032
- Table 53: China APAC Edible Meat Market Revenue (Million) Forecast, by Application 2019 & 2032
- Table 54: India APAC Edible Meat Market Revenue (Million) Forecast, by Application 2019 & 2032
- Table 55: Japan APAC Edible Meat Market Revenue (Million) Forecast, by Application 2019 & 2032
- Table 56: South Korea APAC Edible Meat Market Revenue (Million) Forecast, by Application 2019 & 2032
- Table 57: ASEAN APAC Edible Meat Market Revenue (Million) Forecast, by Application 2019 & 2032
- Table 58: Oceania APAC Edible Meat Market Revenue (Million) Forecast, by Application 2019 & 2032
- Table 59: Rest of Asia Pacific APAC Edible Meat Market Revenue (Million) Forecast, by Application 2019 & 2032
Frequently Asked Questions
1. What is the projected Compound Annual Growth Rate (CAGR) of the APAC Edible Meat Market?
The projected CAGR is approximately 11.45%.
2. Which companies are prominent players in the APAC Edible Meat Market?
Key companies in the market include WH Group Limite, Tönnies Holding ApS & Co KG, Linyi Xincheng Jinluo Meat Products Co Ltd, NH Foods Ltd, Vion Group, Tyson Foods Inc, Westfleisch SCE mbH, Bid Corporation Limited, China Yurun Food Group Ltd, Danish Crown AmbA, COFCO Corporation.
3. What are the main segments of the APAC Edible Meat Market?
The market segments include Type, Form, Distribution Channel.
4. Can you provide details about the market size?
The market size is estimated to be USD XX Million as of 2022.
5. What are some drivers contributing to market growth?
Rising Trend of Ingestible Beauty Products; Growing demand for Nutrient-Enriched Cosmetic Products.
6. What are the notable trends driving market growth?
OTHER KEY INDUSTRY TRENDS COVERED IN THE REPORT.
7. Are there any restraints impacting market growth?
Availability of Counterfeit Beauty Supplements Products.
8. Can you provide examples of recent developments in the market?
November 2023: Tyson Foods announced plans to build new production facilities in China and Thailand, and expand its facility in the Netherlands. The latest expansions, adds over 100,000 tonnes of fully cooked poultry capacity. The new plant in China and Thailand is expected to create more than 700, 1000 jobs respectively and the European expansion will add more than 150 jobs.October 2023: Tonnies Holding announced it had signed a Joint Venture Agreement with the Dekon Group to set up slaughterhouse and butchery facilities in Sichuan, China. The total investment amounts to USD 530 million, of which around USD 158 million is accounted for by the slaughter and cutting centre.February 2021: Tyson Foods has bought a 49% stake in a Malaysia-based company’s vertically integrated poultry business (Malysian Flour Mills Berhad) which operates poultry business that includes feed mills, hatcheries, farms and processing facilities.
9. What pricing options are available for accessing the report?
Pricing options include single-user, multi-user, and enterprise licenses priced at USD 3800, USD 4500, and USD 5800 respectively.
10. Is the market size provided in terms of value or volume?
The market size is provided in terms of value, measured in Million.
11. Are there any specific market keywords associated with the report?
Yes, the market keyword associated with the report is "APAC Edible Meat Market," which aids in identifying and referencing the specific market segment covered.
12. How do I determine which pricing option suits my needs best?
The pricing options vary based on user requirements and access needs. Individual users may opt for single-user licenses, while businesses requiring broader access may choose multi-user or enterprise licenses for cost-effective access to the report.
13. Are there any additional resources or data provided in the APAC Edible Meat Market report?
While the report offers comprehensive insights, it's advisable to review the specific contents or supplementary materials provided to ascertain if additional resources or data are available.
14. How can I stay updated on further developments or reports in the APAC Edible Meat Market?
To stay informed about further developments, trends, and reports in the APAC Edible Meat Market, consider subscribing to industry newsletters, following relevant companies and organizations, or regularly checking reputable industry news sources and publications.
Methodology
Step 1 - Identification of Relevant Samples Size from Population Database


Step 2 - Approaches for Defining Global Market Size (Value, Volume* & Price*)

Note*: In applicable scenarios
Step 3 - Data Sources
Primary Research
- Web Analytics
- Survey Reports
- Research Institute
- Latest Research Reports
- Opinion Leaders
Secondary Research
- Annual Reports
- White Paper
- Latest Press Release
- Industry Association
- Paid Database
- Investor Presentations

Step 4 - Data Triangulation
Involves using different sources of information in order to increase the validity of a study
These sources are likely to be stakeholders in a program - participants, other researchers, program staff, other community members, and so on.
Then we put all data in single framework & apply various statistical tools to find out the dynamic on the market.
During the analysis stage, feedback from the stakeholder groups would be compared to determine areas of agreement as well as areas of divergence
