

Key Insights
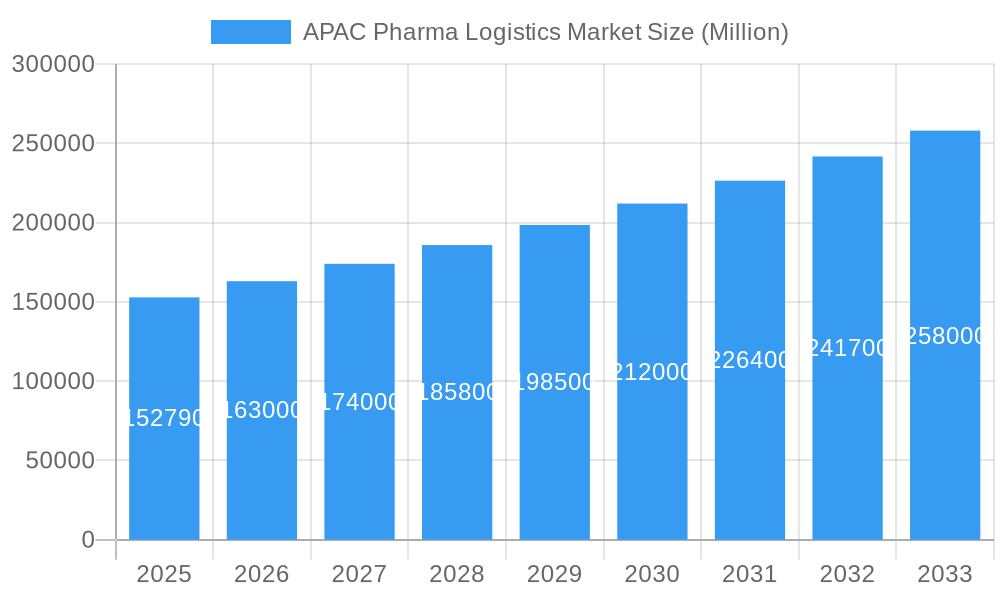
The Asia-Pacific (APAC) pharmaceutical logistics market, valued at $152.79 billion in 2025, is projected to experience robust growth, driven by a compound annual growth rate (CAGR) of 6.68% from 2025 to 2033. This expansion is fueled by several key factors. The rising prevalence of chronic diseases across the region necessitates efficient and reliable pharmaceutical supply chains. Increased government investments in healthcare infrastructure and a growing focus on pharmaceutical research and development further stimulate market growth. The increasing adoption of advanced technologies such as cold chain solutions and sophisticated logistics management systems enhances the efficiency and safety of pharmaceutical transportation. Furthermore, the growth of e-commerce and online pharmacies creates new opportunities for pharmaceutical logistics providers. The market segmentation reveals significant opportunities across various product types (generic and branded drugs), modes of operation (cold chain and non-cold chain), applications (biopharma, chemical pharma, and specialized pharma), and transportation methods (air, rail, road, and sea). China, India, and Japan are expected to be the major contributors to this market growth due to their large populations, expanding healthcare sectors, and increasing demand for pharmaceutical products.
APAC Pharma Logistics Market Market Size (In Billion)
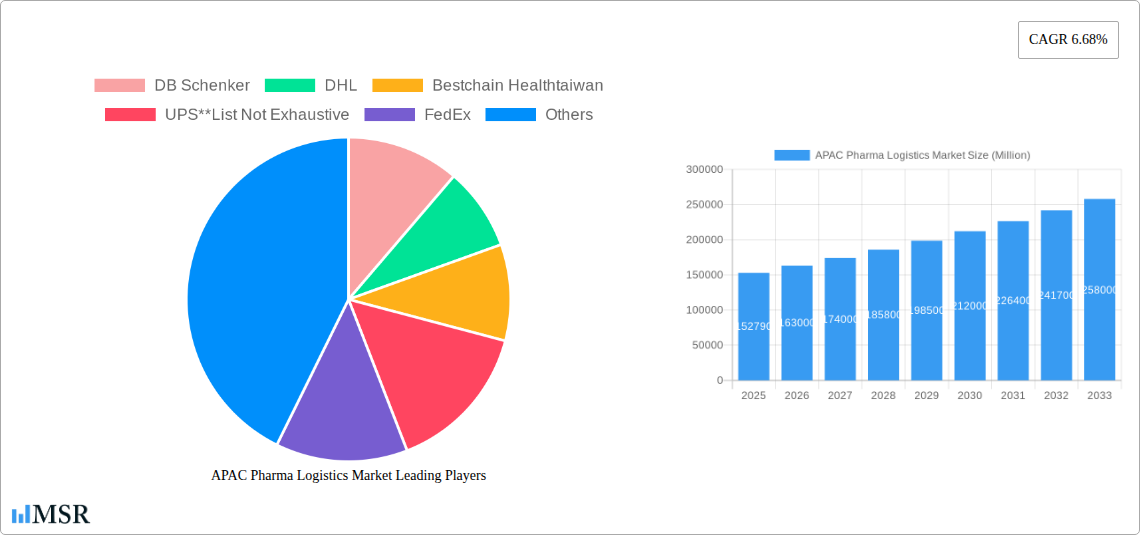
The competitive landscape is characterized by a mix of large multinational logistics companies and regional players. Companies like DHL, FedEx, UPS, and DB Schenker dominate the market with their established global networks and advanced capabilities. However, the market also presents opportunities for smaller, specialized players focusing on niche segments such as cold chain transportation for biopharmaceuticals. The market faces challenges including stringent regulatory requirements, the need for specialized infrastructure to handle temperature-sensitive pharmaceutical products, and the potential for supply chain disruptions due to geopolitical factors and natural disasters. Despite these challenges, the long-term outlook for the APAC pharmaceutical logistics market remains highly positive, driven by ongoing growth in the pharmaceutical industry and evolving logistics technologies. Strategic partnerships and investments in infrastructure are expected to further shape the industry’s trajectory.
APAC Pharma Logistics Market Company Market Share
APAC Pharma Logistics Market: A Comprehensive Report (2019-2033)
This comprehensive report provides an in-depth analysis of the Asia-Pacific Pharma Logistics market, offering invaluable insights for industry stakeholders, investors, and strategic decision-makers. Covering the period from 2019 to 2033, with a base year of 2025 and a forecast period of 2025-2033, this report meticulously examines market dynamics, key segments, leading players, and emerging opportunities. The report leverages extensive primary and secondary research to deliver actionable intelligence on market size (valued in Millions), CAGR, and future growth potential. Key players analyzed include DB Schenker, DHL, Bestchain Healthtaiwan, UPS, FedEx, CEVA Logistics, Genco, Kuehne + Nagel, Mainfreight Ltd, Bio Pharma Logistics, Kerry Logistics, Thermotraffic, DSV Panalpina, and Arich Enterprise Co Ltd. This list is not exhaustive.
APAC Pharma Logistics Market Market Concentration & Dynamics
The APAC pharma logistics market exhibits a moderately consolidated structure, with a few large multinational players holding significant market share. However, regional players and specialized logistics providers are also gaining traction. Innovation in cold chain technology, particularly temperature-controlled containers and real-time monitoring systems, is a key driver. Stringent regulatory frameworks, varying across countries, pose challenges, demanding compliance and necessitating specialized expertise. Substitute products are limited, with the focus primarily on enhancing existing services and efficiency. End-user trends indicate a growing preference for integrated logistics solutions that streamline the entire pharmaceutical supply chain. M&A activities have been moderate, with a focus on expanding geographic reach and service capabilities. In the past five years, approximately xx M&A deals were recorded, leading to a market share consolidation of approximately xx%.
APAC Pharma Logistics Market Industry Insights & Trends
The APAC pharma logistics market is experiencing robust growth, driven by factors such as rising healthcare expenditure, increasing prevalence of chronic diseases, and growing demand for temperature-sensitive pharmaceutical products. The market size in 2025 is estimated at USD xx Million, with a projected CAGR of xx% from 2025 to 2033. Technological advancements, such as the adoption of blockchain technology for enhanced traceability and AI-powered predictive analytics for optimized inventory management, are significantly impacting the industry. Evolving consumer behaviors, including increased online pharmacy utilization, are also shaping market dynamics. The surge in demand for specialized logistics solutions, including cold chain transportation for vaccines and biologics, further contributes to market expansion.
Key Markets & Segments Leading APAC Pharma Logistics Market
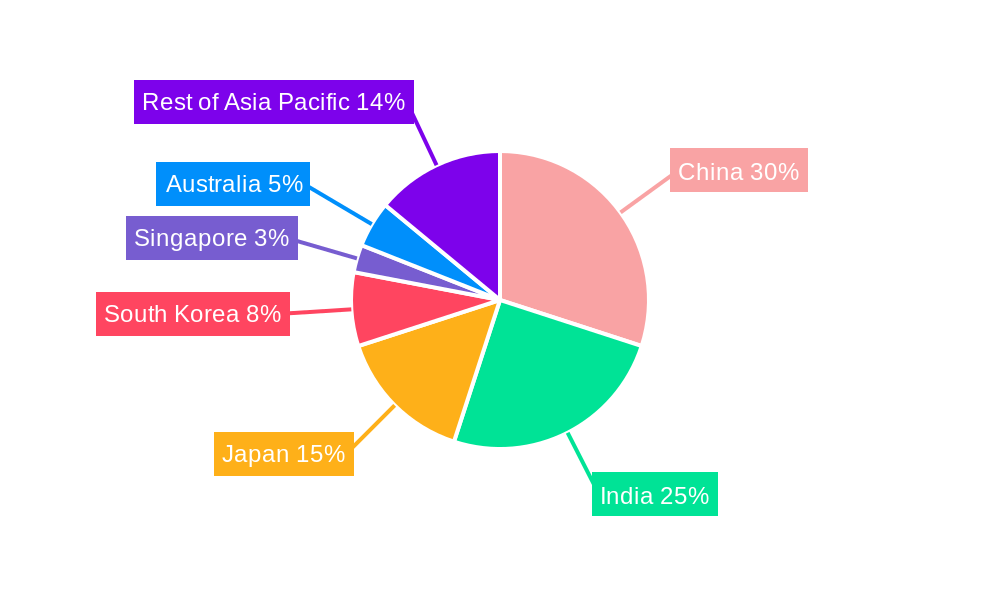
- Dominant Region: China and India represent the largest markets due to their significant pharmaceutical manufacturing and consumption bases. Other key markets include Japan, South Korea, and Australia.
- Dominant Segment (By Product): Branded drugs currently hold a larger market share than generic drugs due to higher value and stringent logistical requirements.
- Dominant Segment (By Mode of Operation): Cold chain transport is a rapidly growing segment, driven by the increasing demand for temperature-sensitive pharmaceutical products.
- Dominant Segment (By Application): Biopharmaceuticals are driving growth due to their high value and specialized handling needs.
- Dominant Segment (By Mode of Transport): Air freight dominates for time-sensitive deliveries, while road transport is prevalent for shorter distances.
Drivers for growth:
- Strong economic growth in several APAC countries.
- Improving infrastructure, particularly transportation networks.
- Growing pharmaceutical manufacturing capacity.
- Increasing investment in cold chain infrastructure.
China's robust pharmaceutical market and its rapidly developing infrastructure contribute significantly to its dominance. India's large generic drug manufacturing base and cost advantages also make it a key player. Japan’s advanced healthcare system and regulatory framework attracts significant investment in specialized logistics.
APAC Pharma Logistics Market Product Developments
Significant advancements are witnessed in cold chain technology, including the use of IoT sensors for real-time monitoring, automated temperature control systems, and improved packaging solutions. These innovations improve product safety and enhance supply chain efficiency. The integration of advanced analytics and AI is also gaining prominence, leading to optimized route planning, predictive maintenance, and improved inventory management. These product developments offer enhanced visibility, reduced waste, and improved compliance.
Challenges in the APAC Pharma Logistics Market Market
The APAC pharma logistics market faces challenges including stringent regulatory compliance requirements, varying across countries, which increase operational complexity and cost. Supply chain disruptions, exacerbated by geopolitical uncertainties and natural disasters, pose significant risks. Intense competition among established and emerging players puts downward pressure on margins. These challenges negatively impact profitability and necessitate strategic adaptation. For example, regulatory hurdles cost the industry approximately USD xx Million annually.
Forces Driving APAC Pharma Logistics Market Growth
The APAC pharma logistics market is experiencing robust growth, significantly propelled by rapid technological advancements. Innovations such as AI-driven route optimization, predictive analytics for demand forecasting, and blockchain-enabled traceability solutions are revolutionizing operational efficiency, enhancing supply chain visibility, and bolstering product integrity. Concurrently, the burgeoning pharmaceutical industry across key APAC nations, driven by an expanding middle class and rising healthcare expenditure, is creating an ever-increasing demand for sophisticated and reliable logistics services. Government initiatives, including strategic investments in modernizing transportation infrastructure, digitizing customs processes, and streamlining regulatory frameworks, are further cultivating a more favorable and conducive market environment for pharmaceutical logistics providers.
Challenges in the APAC Pharma Logistics Market Market (Long-Term Growth Catalysts)
Sustained long-term growth in the APAC pharma logistics market will be predominantly driven by strategic investments in cutting-edge technologies such as IoT for real-time monitoring, advanced data analytics for predictive insights, and automation in warehousing and distribution. The formation of deep, collaborative partnerships between specialized logistics providers and pharmaceutical manufacturers will be instrumental in co-creating resilient and efficient supply chain solutions. Expansion into underserved and emerging markets within the vast APAC region, requiring localized expertise and tailored service offerings, presents a significant opportunity. Moreover, the development and widespread adoption of innovations in sustainable and hyper-efficient cold chain solutions, capable of maintaining stringent temperature controls for sensitive biologics and vaccines across diverse climatic conditions, will be paramount to capturing future market share and ensuring patient access to critical medicines.
Emerging Opportunities in APAC Pharma Logistics Market
Growing demand for specialized logistics solutions for biologics and personalized medicines presents significant opportunities. Expansion into emerging markets with high growth potential, such as Southeast Asia, offers further expansion prospects. The increasing adoption of e-commerce for pharmaceuticals creates opportunities for last-mile delivery optimization.
Leading Players in the APAC Pharma Logistics Market Sector
- DB Schenker
- DHL
- Bestchain Healthtaiwan
- UPS
- FedEx
- CEVA Logistics
- Genco
- Kuehne + Nagel
- Mainfreight Ltd
- Bio Pharma Logistics
- Kerry Logistics
- Thermotraffic
- DSV Panalpina
- Arich Enterprise Co Ltd
Key Milestones in APAC Pharma Logistics Market Industry
- December 2022: DHL Supply Chain announced a significant EUR 10 Million (approximately USD 10,515,247.11) investment in the expansion of its Northern Taiwan plant. This strategic move is designed to substantially boost its capacity and capabilities in serving the critical Life Sciences, Healthcare, and Consumer (LSHC) sectors, as well as the rapidly growing semiconductor industry in the region, enhancing its ability to handle specialized and temperature-sensitive products.
- August 2022: Nippon Express established a dedicated Healthcare Branch in Shanghai, China. This strategic initiative underscores their commitment to strengthening their footprint and service offerings within China's dynamic and rapidly expanding pharmaceutical sector, aiming to provide specialized logistics solutions for a wide range of pharmaceutical products.
- Early 2023: Several regional players, including Kerry Logistics and Schenker (DB Schenker), announced significant expansions of their cold chain capabilities and digital integration platforms across Southeast Asia, signaling a growing emphasis on advanced temperature-controlled logistics and end-to-end supply chain visibility.
Strategic Outlook for APAC Pharma Logistics Market Market
The APAC pharma logistics market presents a landscape of immense growth potential, fueled by escalating healthcare expenditure across the region, a robust expansion of pharmaceutical manufacturing hubs, and the accelerating adoption of advanced digital technologies. To successfully navigate this dynamic environment and capture market share, key strategic imperatives include fostering deeper collaborations through strategic partnerships, making substantial investments in expanding and modernizing cold chain infrastructure, and maintaining unwavering commitment to regulatory compliance across all operational facets. A relentless focus on innovation in service delivery, the integration of sustainable practices throughout the supply chain, and a comprehensive embrace of digital transformation will be indispensable for achieving sustainable long-term growth and establishing market leadership in this highly competitive and evolving sector.
APAC Pharma Logistics Market Segmentation
-
1. Product
- 1.1. Generic Drugs
- 1.2. Branded Drugs
-
2. Mode of Operation
- 2.1. Cold Chain Transport
- 2.2. Non-Cold Chain Transport
-
3. Application
- 3.1. Bio Pharma
- 3.2. Chemical Pharma
- 3.3. Specialized Pharma
-
4. Mode of Transport
- 4.1. Air
- 4.2. Rail
- 4.3. Road
- 4.4. Sea
-
5. Geography
- 5.1. China
- 5.2. India
- 5.3. Japan
- 5.4. South Korea
- 5.5. Singapore
- 5.6. Australia
- 5.7. Rest of Asia Pacific
APAC Pharma Logistics Market Segmentation By Geography
- 1. China
- 2. India
- 3. Japan
- 4. South Korea
- 5. Singapore
- 6. Australia
- 7. Rest of Asia Pacific
APAC Pharma Logistics Market Regional Market Share
Geographic Coverage of APAC Pharma Logistics Market
APAC Pharma Logistics Market REPORT HIGHLIGHTS
| Aspects | Details |
|---|---|
| Study Period | 2020-2034 |
| Base Year | 2025 |
| Estimated Year | 2026 |
| Forecast Period | 2026-2034 |
| Historical Period | 2020-2025 |
| Growth Rate | CAGR of 6.68% from 2020-2034 |
| Segmentation |
|
Table of Contents
- 1. Introduction
- 1.1. Research Scope
- 1.2. Market Segmentation
- 1.3. Research Objective
- 1.4. Definitions and Assumptions
- 2. Executive Summary
- 2.1. Market Snapshot
- 3. Market Dynamics
- 3.1. Market Drivers
- 3.2. Market Restrains
- 3.3. Market Trends
- 3.4. Market Opportunities
- 4. Market Factor Analysis
- 4.1. Porters Five Forces
- 4.1.1. Bargaining Power of Suppliers
- 4.1.2. Bargaining Power of Buyers
- 4.1.3. Threat of New Entrants
- 4.1.4. Threat of Substitutes
- 4.1.5. Competitive Rivalry
- 4.2. PESTEL analysis
- 4.3. BCG Analysis
- 4.3.1. Stars (High Growth, High Market Share)
- 4.3.2. Cash Cows (Low Growth, High Market Share)
- 4.3.3. Question Mark (High Growth, Low Market Share)
- 4.3.4. Dogs (Low Growth, Low Market Share)
- 4.4. Ansoff Matrix Analysis
- 4.5. Supply Chain Analysis
- 4.6. Regulatory Landscape
- 4.7. Current Market Potential and Opportunity Assessment (TAM–SAM–SOM Framework)
- 4.8. MSR Analyst Note
- 4.1. Porters Five Forces
- 5. Market Analysis, Insights and Forecast 2021-2033
- 5.1. Market Analysis, Insights and Forecast - by Product
- 5.1.1. Generic Drugs
- 5.1.2. Branded Drugs
- 5.2. Market Analysis, Insights and Forecast - by Mode of Operation
- 5.2.1. Cold Chain Transport
- 5.2.2. Non-Cold Chain Transport
- 5.3. Market Analysis, Insights and Forecast - by Application
- 5.3.1. Bio Pharma
- 5.3.2. Chemical Pharma
- 5.3.3. Specialized Pharma
- 5.4. Market Analysis, Insights and Forecast - by Mode of Transport
- 5.4.1. Air
- 5.4.2. Rail
- 5.4.3. Road
- 5.4.4. Sea
- 5.5. Market Analysis, Insights and Forecast - by Geography
- 5.5.1. China
- 5.5.2. India
- 5.5.3. Japan
- 5.5.4. South Korea
- 5.5.5. Singapore
- 5.5.6. Australia
- 5.5.7. Rest of Asia Pacific
- 5.6. Market Analysis, Insights and Forecast - by Region
- 5.6.1. China
- 5.6.2. India
- 5.6.3. Japan
- 5.6.4. South Korea
- 5.6.5. Singapore
- 5.6.6. Australia
- 5.6.7. Rest of Asia Pacific
- 5.1. Market Analysis, Insights and Forecast - by Product
- 6. Global APAC Pharma Logistics Market Analysis, Insights and Forecast, 2021-2033
- 6.1. Market Analysis, Insights and Forecast - by Product
- 6.1.1. Generic Drugs
- 6.1.2. Branded Drugs
- 6.2. Market Analysis, Insights and Forecast - by Mode of Operation
- 6.2.1. Cold Chain Transport
- 6.2.2. Non-Cold Chain Transport
- 6.3. Market Analysis, Insights and Forecast - by Application
- 6.3.1. Bio Pharma
- 6.3.2. Chemical Pharma
- 6.3.3. Specialized Pharma
- 6.4. Market Analysis, Insights and Forecast - by Mode of Transport
- 6.4.1. Air
- 6.4.2. Rail
- 6.4.3. Road
- 6.4.4. Sea
- 6.5. Market Analysis, Insights and Forecast - by Geography
- 6.5.1. China
- 6.5.2. India
- 6.5.3. Japan
- 6.5.4. South Korea
- 6.5.5. Singapore
- 6.5.6. Australia
- 6.5.7. Rest of Asia Pacific
- 6.1. Market Analysis, Insights and Forecast - by Product
- 7. China APAC Pharma Logistics Market Analysis, Insights and Forecast, 2020-2032
- 7.1. Market Analysis, Insights and Forecast - by Product
- 7.1.1. Generic Drugs
- 7.1.2. Branded Drugs
- 7.2. Market Analysis, Insights and Forecast - by Mode of Operation
- 7.2.1. Cold Chain Transport
- 7.2.2. Non-Cold Chain Transport
- 7.3. Market Analysis, Insights and Forecast - by Application
- 7.3.1. Bio Pharma
- 7.3.2. Chemical Pharma
- 7.3.3. Specialized Pharma
- 7.4. Market Analysis, Insights and Forecast - by Mode of Transport
- 7.4.1. Air
- 7.4.2. Rail
- 7.4.3. Road
- 7.4.4. Sea
- 7.5. Market Analysis, Insights and Forecast - by Geography
- 7.5.1. China
- 7.5.2. India
- 7.5.3. Japan
- 7.5.4. South Korea
- 7.5.5. Singapore
- 7.5.6. Australia
- 7.5.7. Rest of Asia Pacific
- 7.1. Market Analysis, Insights and Forecast - by Product
- 8. India APAC Pharma Logistics Market Analysis, Insights and Forecast, 2020-2032
- 8.1. Market Analysis, Insights and Forecast - by Product
- 8.1.1. Generic Drugs
- 8.1.2. Branded Drugs
- 8.2. Market Analysis, Insights and Forecast - by Mode of Operation
- 8.2.1. Cold Chain Transport
- 8.2.2. Non-Cold Chain Transport
- 8.3. Market Analysis, Insights and Forecast - by Application
- 8.3.1. Bio Pharma
- 8.3.2. Chemical Pharma
- 8.3.3. Specialized Pharma
- 8.4. Market Analysis, Insights and Forecast - by Mode of Transport
- 8.4.1. Air
- 8.4.2. Rail
- 8.4.3. Road
- 8.4.4. Sea
- 8.5. Market Analysis, Insights and Forecast - by Geography
- 8.5.1. China
- 8.5.2. India
- 8.5.3. Japan
- 8.5.4. South Korea
- 8.5.5. Singapore
- 8.5.6. Australia
- 8.5.7. Rest of Asia Pacific
- 8.1. Market Analysis, Insights and Forecast - by Product
- 9. Japan APAC Pharma Logistics Market Analysis, Insights and Forecast, 2020-2032
- 9.1. Market Analysis, Insights and Forecast - by Product
- 9.1.1. Generic Drugs
- 9.1.2. Branded Drugs
- 9.2. Market Analysis, Insights and Forecast - by Mode of Operation
- 9.2.1. Cold Chain Transport
- 9.2.2. Non-Cold Chain Transport
- 9.3. Market Analysis, Insights and Forecast - by Application
- 9.3.1. Bio Pharma
- 9.3.2. Chemical Pharma
- 9.3.3. Specialized Pharma
- 9.4. Market Analysis, Insights and Forecast - by Mode of Transport
- 9.4.1. Air
- 9.4.2. Rail
- 9.4.3. Road
- 9.4.4. Sea
- 9.5. Market Analysis, Insights and Forecast - by Geography
- 9.5.1. China
- 9.5.2. India
- 9.5.3. Japan
- 9.5.4. South Korea
- 9.5.5. Singapore
- 9.5.6. Australia
- 9.5.7. Rest of Asia Pacific
- 9.1. Market Analysis, Insights and Forecast - by Product
- 10. South Korea APAC Pharma Logistics Market Analysis, Insights and Forecast, 2020-2032
- 10.1. Market Analysis, Insights and Forecast - by Product
- 10.1.1. Generic Drugs
- 10.1.2. Branded Drugs
- 10.2. Market Analysis, Insights and Forecast - by Mode of Operation
- 10.2.1. Cold Chain Transport
- 10.2.2. Non-Cold Chain Transport
- 10.3. Market Analysis, Insights and Forecast - by Application
- 10.3.1. Bio Pharma
- 10.3.2. Chemical Pharma
- 10.3.3. Specialized Pharma
- 10.4. Market Analysis, Insights and Forecast - by Mode of Transport
- 10.4.1. Air
- 10.4.2. Rail
- 10.4.3. Road
- 10.4.4. Sea
- 10.5. Market Analysis, Insights and Forecast - by Geography
- 10.5.1. China
- 10.5.2. India
- 10.5.3. Japan
- 10.5.4. South Korea
- 10.5.5. Singapore
- 10.5.6. Australia
- 10.5.7. Rest of Asia Pacific
- 10.1. Market Analysis, Insights and Forecast - by Product
- 11. Singapore APAC Pharma Logistics Market Analysis, Insights and Forecast, 2020-2032
- 11.1. Market Analysis, Insights and Forecast - by Product
- 11.1.1. Generic Drugs
- 11.1.2. Branded Drugs
- 11.2. Market Analysis, Insights and Forecast - by Mode of Operation
- 11.2.1. Cold Chain Transport
- 11.2.2. Non-Cold Chain Transport
- 11.3. Market Analysis, Insights and Forecast - by Application
- 11.3.1. Bio Pharma
- 11.3.2. Chemical Pharma
- 11.3.3. Specialized Pharma
- 11.4. Market Analysis, Insights and Forecast - by Mode of Transport
- 11.4.1. Air
- 11.4.2. Rail
- 11.4.3. Road
- 11.4.4. Sea
- 11.5. Market Analysis, Insights and Forecast - by Geography
- 11.5.1. China
- 11.5.2. India
- 11.5.3. Japan
- 11.5.4. South Korea
- 11.5.5. Singapore
- 11.5.6. Australia
- 11.5.7. Rest of Asia Pacific
- 11.1. Market Analysis, Insights and Forecast - by Product
- 12. Australia APAC Pharma Logistics Market Analysis, Insights and Forecast, 2020-2032
- 12.1. Market Analysis, Insights and Forecast - by Product
- 12.1.1. Generic Drugs
- 12.1.2. Branded Drugs
- 12.2. Market Analysis, Insights and Forecast - by Mode of Operation
- 12.2.1. Cold Chain Transport
- 12.2.2. Non-Cold Chain Transport
- 12.3. Market Analysis, Insights and Forecast - by Application
- 12.3.1. Bio Pharma
- 12.3.2. Chemical Pharma
- 12.3.3. Specialized Pharma
- 12.4. Market Analysis, Insights and Forecast - by Mode of Transport
- 12.4.1. Air
- 12.4.2. Rail
- 12.4.3. Road
- 12.4.4. Sea
- 12.5. Market Analysis, Insights and Forecast - by Geography
- 12.5.1. China
- 12.5.2. India
- 12.5.3. Japan
- 12.5.4. South Korea
- 12.5.5. Singapore
- 12.5.6. Australia
- 12.5.7. Rest of Asia Pacific
- 12.1. Market Analysis, Insights and Forecast - by Product
- 13. Rest of Asia Pacific APAC Pharma Logistics Market Analysis, Insights and Forecast, 2020-2032
- 13.1. Market Analysis, Insights and Forecast - by Product
- 13.1.1. Generic Drugs
- 13.1.2. Branded Drugs
- 13.2. Market Analysis, Insights and Forecast - by Mode of Operation
- 13.2.1. Cold Chain Transport
- 13.2.2. Non-Cold Chain Transport
- 13.3. Market Analysis, Insights and Forecast - by Application
- 13.3.1. Bio Pharma
- 13.3.2. Chemical Pharma
- 13.3.3. Specialized Pharma
- 13.4. Market Analysis, Insights and Forecast - by Mode of Transport
- 13.4.1. Air
- 13.4.2. Rail
- 13.4.3. Road
- 13.4.4. Sea
- 13.5. Market Analysis, Insights and Forecast - by Geography
- 13.5.1. China
- 13.5.2. India
- 13.5.3. Japan
- 13.5.4. South Korea
- 13.5.5. Singapore
- 13.5.6. Australia
- 13.5.7. Rest of Asia Pacific
- 13.1. Market Analysis, Insights and Forecast - by Product
- 14. Competitive Analysis
- 14.1. Company Profiles
- 14.1.1 DB Schenker
- 14.1.1.1. Company Overview
- 14.1.1.2. Products
- 14.1.1.3. Company Financials
- 14.1.1.4. SWOT Analysis
- 14.1.2 DHL
- 14.1.2.1. Company Overview
- 14.1.2.2. Products
- 14.1.2.3. Company Financials
- 14.1.2.4. SWOT Analysis
- 14.1.3 Bestchain Healthtaiwan
- 14.1.3.1. Company Overview
- 14.1.3.2. Products
- 14.1.3.3. Company Financials
- 14.1.3.4. SWOT Analysis
- 14.1.4 UPS**List Not Exhaustive
- 14.1.4.1. Company Overview
- 14.1.4.2. Products
- 14.1.4.3. Company Financials
- 14.1.4.4. SWOT Analysis
- 14.1.5 FedEx
- 14.1.5.1. Company Overview
- 14.1.5.2. Products
- 14.1.5.3. Company Financials
- 14.1.5.4. SWOT Analysis
- 14.1.6 CEVA Logistics
- 14.1.6.1. Company Overview
- 14.1.6.2. Products
- 14.1.6.3. Company Financials
- 14.1.6.4. SWOT Analysis
- 14.1.7 Genco
- 14.1.7.1. Company Overview
- 14.1.7.2. Products
- 14.1.7.3. Company Financials
- 14.1.7.4. SWOT Analysis
- 14.1.8 Kuehne + Nagel
- 14.1.8.1. Company Overview
- 14.1.8.2. Products
- 14.1.8.3. Company Financials
- 14.1.8.4. SWOT Analysis
- 14.1.9 Mainfreight Ltd
- 14.1.9.1. Company Overview
- 14.1.9.2. Products
- 14.1.9.3. Company Financials
- 14.1.9.4. SWOT Analysis
- 14.1.10 Bio Pharma Logistics
- 14.1.10.1. Company Overview
- 14.1.10.2. Products
- 14.1.10.3. Company Financials
- 14.1.10.4. SWOT Analysis
- 14.1.11 Kerry Logistics
- 14.1.11.1. Company Overview
- 14.1.11.2. Products
- 14.1.11.3. Company Financials
- 14.1.11.4. SWOT Analysis
- 14.1.12 Thermotraffic
- 14.1.12.1. Company Overview
- 14.1.12.2. Products
- 14.1.12.3. Company Financials
- 14.1.12.4. SWOT Analysis
- 14.1.13 DSV Panalpina
- 14.1.13.1. Company Overview
- 14.1.13.2. Products
- 14.1.13.3. Company Financials
- 14.1.13.4. SWOT Analysis
- 14.1.14 Arich Enterprise Co Ltd
- 14.1.14.1. Company Overview
- 14.1.14.2. Products
- 14.1.14.3. Company Financials
- 14.1.14.4. SWOT Analysis
- 14.1.1 DB Schenker
- 14.2. Market Entropy
- 14.2.1 Company's Key Areas Served
- 14.2.2 Recent Developments
- 14.3. Company Market Share Analysis 2025
- 14.3.1 Top 5 Companies Market Share Analysis
- 14.3.2 Top 3 Companies Market Share Analysis
- 14.4. List of Potential Customers
- 15. Research Methodology
List of Figures
- Figure 1: Global APAC Pharma Logistics Market Revenue Breakdown (Million, %) by Region 2025 & 2033
- Figure 2: China APAC Pharma Logistics Market Revenue (Million), by Product 2025 & 2033
- Figure 3: China APAC Pharma Logistics Market Revenue Share (%), by Product 2025 & 2033
- Figure 4: China APAC Pharma Logistics Market Revenue (Million), by Mode of Operation 2025 & 2033
- Figure 5: China APAC Pharma Logistics Market Revenue Share (%), by Mode of Operation 2025 & 2033
- Figure 6: China APAC Pharma Logistics Market Revenue (Million), by Application 2025 & 2033
- Figure 7: China APAC Pharma Logistics Market Revenue Share (%), by Application 2025 & 2033
- Figure 8: China APAC Pharma Logistics Market Revenue (Million), by Mode of Transport 2025 & 2033
- Figure 9: China APAC Pharma Logistics Market Revenue Share (%), by Mode of Transport 2025 & 2033
- Figure 10: China APAC Pharma Logistics Market Revenue (Million), by Geography 2025 & 2033
- Figure 11: China APAC Pharma Logistics Market Revenue Share (%), by Geography 2025 & 2033
- Figure 12: China APAC Pharma Logistics Market Revenue (Million), by Country 2025 & 2033
- Figure 13: China APAC Pharma Logistics Market Revenue Share (%), by Country 2025 & 2033
- Figure 14: India APAC Pharma Logistics Market Revenue (Million), by Product 2025 & 2033
- Figure 15: India APAC Pharma Logistics Market Revenue Share (%), by Product 2025 & 2033
- Figure 16: India APAC Pharma Logistics Market Revenue (Million), by Mode of Operation 2025 & 2033
- Figure 17: India APAC Pharma Logistics Market Revenue Share (%), by Mode of Operation 2025 & 2033
- Figure 18: India APAC Pharma Logistics Market Revenue (Million), by Application 2025 & 2033
- Figure 19: India APAC Pharma Logistics Market Revenue Share (%), by Application 2025 & 2033
- Figure 20: India APAC Pharma Logistics Market Revenue (Million), by Mode of Transport 2025 & 2033
- Figure 21: India APAC Pharma Logistics Market Revenue Share (%), by Mode of Transport 2025 & 2033
- Figure 22: India APAC Pharma Logistics Market Revenue (Million), by Geography 2025 & 2033
- Figure 23: India APAC Pharma Logistics Market Revenue Share (%), by Geography 2025 & 2033
- Figure 24: India APAC Pharma Logistics Market Revenue (Million), by Country 2025 & 2033
- Figure 25: India APAC Pharma Logistics Market Revenue Share (%), by Country 2025 & 2033
- Figure 26: Japan APAC Pharma Logistics Market Revenue (Million), by Product 2025 & 2033
- Figure 27: Japan APAC Pharma Logistics Market Revenue Share (%), by Product 2025 & 2033
- Figure 28: Japan APAC Pharma Logistics Market Revenue (Million), by Mode of Operation 2025 & 2033
- Figure 29: Japan APAC Pharma Logistics Market Revenue Share (%), by Mode of Operation 2025 & 2033
- Figure 30: Japan APAC Pharma Logistics Market Revenue (Million), by Application 2025 & 2033
- Figure 31: Japan APAC Pharma Logistics Market Revenue Share (%), by Application 2025 & 2033
- Figure 32: Japan APAC Pharma Logistics Market Revenue (Million), by Mode of Transport 2025 & 2033
- Figure 33: Japan APAC Pharma Logistics Market Revenue Share (%), by Mode of Transport 2025 & 2033
- Figure 34: Japan APAC Pharma Logistics Market Revenue (Million), by Geography 2025 & 2033
- Figure 35: Japan APAC Pharma Logistics Market Revenue Share (%), by Geography 2025 & 2033
- Figure 36: Japan APAC Pharma Logistics Market Revenue (Million), by Country 2025 & 2033
- Figure 37: Japan APAC Pharma Logistics Market Revenue Share (%), by Country 2025 & 2033
- Figure 38: South Korea APAC Pharma Logistics Market Revenue (Million), by Product 2025 & 2033
- Figure 39: South Korea APAC Pharma Logistics Market Revenue Share (%), by Product 2025 & 2033
- Figure 40: South Korea APAC Pharma Logistics Market Revenue (Million), by Mode of Operation 2025 & 2033
- Figure 41: South Korea APAC Pharma Logistics Market Revenue Share (%), by Mode of Operation 2025 & 2033
- Figure 42: South Korea APAC Pharma Logistics Market Revenue (Million), by Application 2025 & 2033
- Figure 43: South Korea APAC Pharma Logistics Market Revenue Share (%), by Application 2025 & 2033
- Figure 44: South Korea APAC Pharma Logistics Market Revenue (Million), by Mode of Transport 2025 & 2033
- Figure 45: South Korea APAC Pharma Logistics Market Revenue Share (%), by Mode of Transport 2025 & 2033
- Figure 46: South Korea APAC Pharma Logistics Market Revenue (Million), by Geography 2025 & 2033
- Figure 47: South Korea APAC Pharma Logistics Market Revenue Share (%), by Geography 2025 & 2033
- Figure 48: South Korea APAC Pharma Logistics Market Revenue (Million), by Country 2025 & 2033
- Figure 49: South Korea APAC Pharma Logistics Market Revenue Share (%), by Country 2025 & 2033
- Figure 50: Singapore APAC Pharma Logistics Market Revenue (Million), by Product 2025 & 2033
- Figure 51: Singapore APAC Pharma Logistics Market Revenue Share (%), by Product 2025 & 2033
- Figure 52: Singapore APAC Pharma Logistics Market Revenue (Million), by Mode of Operation 2025 & 2033
- Figure 53: Singapore APAC Pharma Logistics Market Revenue Share (%), by Mode of Operation 2025 & 2033
- Figure 54: Singapore APAC Pharma Logistics Market Revenue (Million), by Application 2025 & 2033
- Figure 55: Singapore APAC Pharma Logistics Market Revenue Share (%), by Application 2025 & 2033
- Figure 56: Singapore APAC Pharma Logistics Market Revenue (Million), by Mode of Transport 2025 & 2033
- Figure 57: Singapore APAC Pharma Logistics Market Revenue Share (%), by Mode of Transport 2025 & 2033
- Figure 58: Singapore APAC Pharma Logistics Market Revenue (Million), by Geography 2025 & 2033
- Figure 59: Singapore APAC Pharma Logistics Market Revenue Share (%), by Geography 2025 & 2033
- Figure 60: Singapore APAC Pharma Logistics Market Revenue (Million), by Country 2025 & 2033
- Figure 61: Singapore APAC Pharma Logistics Market Revenue Share (%), by Country 2025 & 2033
- Figure 62: Australia APAC Pharma Logistics Market Revenue (Million), by Product 2025 & 2033
- Figure 63: Australia APAC Pharma Logistics Market Revenue Share (%), by Product 2025 & 2033
- Figure 64: Australia APAC Pharma Logistics Market Revenue (Million), by Mode of Operation 2025 & 2033
- Figure 65: Australia APAC Pharma Logistics Market Revenue Share (%), by Mode of Operation 2025 & 2033
- Figure 66: Australia APAC Pharma Logistics Market Revenue (Million), by Application 2025 & 2033
- Figure 67: Australia APAC Pharma Logistics Market Revenue Share (%), by Application 2025 & 2033
- Figure 68: Australia APAC Pharma Logistics Market Revenue (Million), by Mode of Transport 2025 & 2033
- Figure 69: Australia APAC Pharma Logistics Market Revenue Share (%), by Mode of Transport 2025 & 2033
- Figure 70: Australia APAC Pharma Logistics Market Revenue (Million), by Geography 2025 & 2033
- Figure 71: Australia APAC Pharma Logistics Market Revenue Share (%), by Geography 2025 & 2033
- Figure 72: Australia APAC Pharma Logistics Market Revenue (Million), by Country 2025 & 2033
- Figure 73: Australia APAC Pharma Logistics Market Revenue Share (%), by Country 2025 & 2033
- Figure 74: Rest of Asia Pacific APAC Pharma Logistics Market Revenue (Million), by Product 2025 & 2033
- Figure 75: Rest of Asia Pacific APAC Pharma Logistics Market Revenue Share (%), by Product 2025 & 2033
- Figure 76: Rest of Asia Pacific APAC Pharma Logistics Market Revenue (Million), by Mode of Operation 2025 & 2033
- Figure 77: Rest of Asia Pacific APAC Pharma Logistics Market Revenue Share (%), by Mode of Operation 2025 & 2033
- Figure 78: Rest of Asia Pacific APAC Pharma Logistics Market Revenue (Million), by Application 2025 & 2033
- Figure 79: Rest of Asia Pacific APAC Pharma Logistics Market Revenue Share (%), by Application 2025 & 2033
- Figure 80: Rest of Asia Pacific APAC Pharma Logistics Market Revenue (Million), by Mode of Transport 2025 & 2033
- Figure 81: Rest of Asia Pacific APAC Pharma Logistics Market Revenue Share (%), by Mode of Transport 2025 & 2033
- Figure 82: Rest of Asia Pacific APAC Pharma Logistics Market Revenue (Million), by Geography 2025 & 2033
- Figure 83: Rest of Asia Pacific APAC Pharma Logistics Market Revenue Share (%), by Geography 2025 & 2033
- Figure 84: Rest of Asia Pacific APAC Pharma Logistics Market Revenue (Million), by Country 2025 & 2033
- Figure 85: Rest of Asia Pacific APAC Pharma Logistics Market Revenue Share (%), by Country 2025 & 2033
List of Tables
- Table 1: Global APAC Pharma Logistics Market Revenue Million Forecast, by Product 2020 & 2033
- Table 2: Global APAC Pharma Logistics Market Revenue Million Forecast, by Mode of Operation 2020 & 2033
- Table 3: Global APAC Pharma Logistics Market Revenue Million Forecast, by Application 2020 & 2033
- Table 4: Global APAC Pharma Logistics Market Revenue Million Forecast, by Mode of Transport 2020 & 2033
- Table 5: Global APAC Pharma Logistics Market Revenue Million Forecast, by Geography 2020 & 2033
- Table 6: Global APAC Pharma Logistics Market Revenue Million Forecast, by Region 2020 & 2033
- Table 7: Global APAC Pharma Logistics Market Revenue Million Forecast, by Product 2020 & 2033
- Table 8: Global APAC Pharma Logistics Market Revenue Million Forecast, by Mode of Operation 2020 & 2033
- Table 9: Global APAC Pharma Logistics Market Revenue Million Forecast, by Application 2020 & 2033
- Table 10: Global APAC Pharma Logistics Market Revenue Million Forecast, by Mode of Transport 2020 & 2033
- Table 11: Global APAC Pharma Logistics Market Revenue Million Forecast, by Geography 2020 & 2033
- Table 12: Global APAC Pharma Logistics Market Revenue Million Forecast, by Country 2020 & 2033
- Table 13: Global APAC Pharma Logistics Market Revenue Million Forecast, by Product 2020 & 2033
- Table 14: Global APAC Pharma Logistics Market Revenue Million Forecast, by Mode of Operation 2020 & 2033
- Table 15: Global APAC Pharma Logistics Market Revenue Million Forecast, by Application 2020 & 2033
- Table 16: Global APAC Pharma Logistics Market Revenue Million Forecast, by Mode of Transport 2020 & 2033
- Table 17: Global APAC Pharma Logistics Market Revenue Million Forecast, by Geography 2020 & 2033
- Table 18: Global APAC Pharma Logistics Market Revenue Million Forecast, by Country 2020 & 2033
- Table 19: Global APAC Pharma Logistics Market Revenue Million Forecast, by Product 2020 & 2033
- Table 20: Global APAC Pharma Logistics Market Revenue Million Forecast, by Mode of Operation 2020 & 2033
- Table 21: Global APAC Pharma Logistics Market Revenue Million Forecast, by Application 2020 & 2033
- Table 22: Global APAC Pharma Logistics Market Revenue Million Forecast, by Mode of Transport 2020 & 2033
- Table 23: Global APAC Pharma Logistics Market Revenue Million Forecast, by Geography 2020 & 2033
- Table 24: Global APAC Pharma Logistics Market Revenue Million Forecast, by Country 2020 & 2033
- Table 25: Global APAC Pharma Logistics Market Revenue Million Forecast, by Product 2020 & 2033
- Table 26: Global APAC Pharma Logistics Market Revenue Million Forecast, by Mode of Operation 2020 & 2033
- Table 27: Global APAC Pharma Logistics Market Revenue Million Forecast, by Application 2020 & 2033
- Table 28: Global APAC Pharma Logistics Market Revenue Million Forecast, by Mode of Transport 2020 & 2033
- Table 29: Global APAC Pharma Logistics Market Revenue Million Forecast, by Geography 2020 & 2033
- Table 30: Global APAC Pharma Logistics Market Revenue Million Forecast, by Country 2020 & 2033
- Table 31: Global APAC Pharma Logistics Market Revenue Million Forecast, by Product 2020 & 2033
- Table 32: Global APAC Pharma Logistics Market Revenue Million Forecast, by Mode of Operation 2020 & 2033
- Table 33: Global APAC Pharma Logistics Market Revenue Million Forecast, by Application 2020 & 2033
- Table 34: Global APAC Pharma Logistics Market Revenue Million Forecast, by Mode of Transport 2020 & 2033
- Table 35: Global APAC Pharma Logistics Market Revenue Million Forecast, by Geography 2020 & 2033
- Table 36: Global APAC Pharma Logistics Market Revenue Million Forecast, by Country 2020 & 2033
- Table 37: Global APAC Pharma Logistics Market Revenue Million Forecast, by Product 2020 & 2033
- Table 38: Global APAC Pharma Logistics Market Revenue Million Forecast, by Mode of Operation 2020 & 2033
- Table 39: Global APAC Pharma Logistics Market Revenue Million Forecast, by Application 2020 & 2033
- Table 40: Global APAC Pharma Logistics Market Revenue Million Forecast, by Mode of Transport 2020 & 2033
- Table 41: Global APAC Pharma Logistics Market Revenue Million Forecast, by Geography 2020 & 2033
- Table 42: Global APAC Pharma Logistics Market Revenue Million Forecast, by Country 2020 & 2033
- Table 43: Global APAC Pharma Logistics Market Revenue Million Forecast, by Product 2020 & 2033
- Table 44: Global APAC Pharma Logistics Market Revenue Million Forecast, by Mode of Operation 2020 & 2033
- Table 45: Global APAC Pharma Logistics Market Revenue Million Forecast, by Application 2020 & 2033
- Table 46: Global APAC Pharma Logistics Market Revenue Million Forecast, by Mode of Transport 2020 & 2033
- Table 47: Global APAC Pharma Logistics Market Revenue Million Forecast, by Geography 2020 & 2033
- Table 48: Global APAC Pharma Logistics Market Revenue Million Forecast, by Country 2020 & 2033
Frequently Asked Questions
1. What is the projected Compound Annual Growth Rate (CAGR) of the APAC Pharma Logistics Market?
The projected CAGR is approximately 6.68%.
2. Which companies are prominent players in the APAC Pharma Logistics Market?
Key companies in the market include DB Schenker, DHL, Bestchain Healthtaiwan, UPS**List Not Exhaustive, FedEx, CEVA Logistics, Genco, Kuehne + Nagel, Mainfreight Ltd, Bio Pharma Logistics, Kerry Logistics, Thermotraffic, DSV Panalpina, Arich Enterprise Co Ltd.
3. What are the main segments of the APAC Pharma Logistics Market?
The market segments include Product, Mode of Operation, Application, Mode of Transport, Geography.
4. Can you provide details about the market size?
The market size is estimated to be USD 152.79 Million as of 2022.
5. What are some drivers contributing to market growth?
Growing Events in E-commerce Sector; Increasing Demand for Qualified Event Logistics Services.
6. What are the notable trends driving market growth?
Cold chain Logistics is driving the market.
7. Are there any restraints impacting market growth?
High Labour Cost; High Pricing.
8. Can you provide examples of recent developments in the market?
December 2022: DHL Supply Chain has disclosed its Northern Taiwan plant growth plans for five years. The investment of EUR 10 million (USD 10515247.1083) would expand DHL Supply Chain's market reach and meet the logistics needs of the LSHC and semiconductor industries. The newly inaugurated Taoyuan Distribution Center-Jian Guo, DHL Supply Chain's second location in Taoyuan, is a part of the development.
9. What pricing options are available for accessing the report?
Pricing options include single-user, multi-user, and enterprise licenses priced at USD 4750, USD 5250, and USD 8750 respectively.
10. Is the market size provided in terms of value or volume?
The market size is provided in terms of value, measured in Million.
11. Are there any specific market keywords associated with the report?
Yes, the market keyword associated with the report is "APAC Pharma Logistics Market," which aids in identifying and referencing the specific market segment covered.
12. How do I determine which pricing option suits my needs best?
The pricing options vary based on user requirements and access needs. Individual users may opt for single-user licenses, while businesses requiring broader access may choose multi-user or enterprise licenses for cost-effective access to the report.
13. Are there any additional resources or data provided in the APAC Pharma Logistics Market report?
While the report offers comprehensive insights, it's advisable to review the specific contents or supplementary materials provided to ascertain if additional resources or data are available.
14. How can I stay updated on further developments or reports in the APAC Pharma Logistics Market?
To stay informed about further developments, trends, and reports in the APAC Pharma Logistics Market, consider subscribing to industry newsletters, following relevant companies and organizations, or regularly checking reputable industry news sources and publications.
Methodology
Step 1 - Identification of Relevant Samples Size from Population Database


Step 2 - Approaches for Defining Global Market Size (Value, Volume* & Price*)

Note*: In applicable scenarios
Step 3 - Data Sources
Primary Research
- Web Analytics
- Survey Reports
- Research Institute
- Latest Research Reports
- Opinion Leaders
Secondary Research
- Annual Reports
- White Paper
- Latest Press Release
- Industry Association
- Paid Database
- Investor Presentations

Step 4 - Data Triangulation
Involves using different sources of information in order to increase the validity of a study
These sources are likely to be stakeholders in a program - participants, other researchers, program staff, other community members, and so on.
Then we put all data in single framework & apply various statistical tools to find out the dynamic on the market.
During the analysis stage, feedback from the stakeholder groups would be compared to determine areas of agreement as well as areas of divergence