

Key Insights
The global Deionization Service market is poised for substantial growth, projected to reach a market size of $7.9 billion by 2025, with a robust CAGR of 11.7% expected throughout the forecast period of 2025-2033. This upward trajectory is fueled by the increasing demand for ultra-pure water across a diverse range of industries, driven by stringent quality regulations and the need for enhanced product performance and process efficiency. Key sectors like Mechanical Engineering, Automotive, and Aeronautics are significant contributors, relying on deionized water for critical applications such as cleaning, cooling, and as a vital component in manufacturing processes. The Medical and Electrical industries also represent burgeoning segments, with their expanding requirements for highly purified water in diagnostics, pharmaceuticals, and microelectronics fabrication. Emerging economies in the Asia Pacific region, particularly China and India, are anticipated to be significant growth engines due to rapid industrialization and increasing investments in advanced manufacturing capabilities.
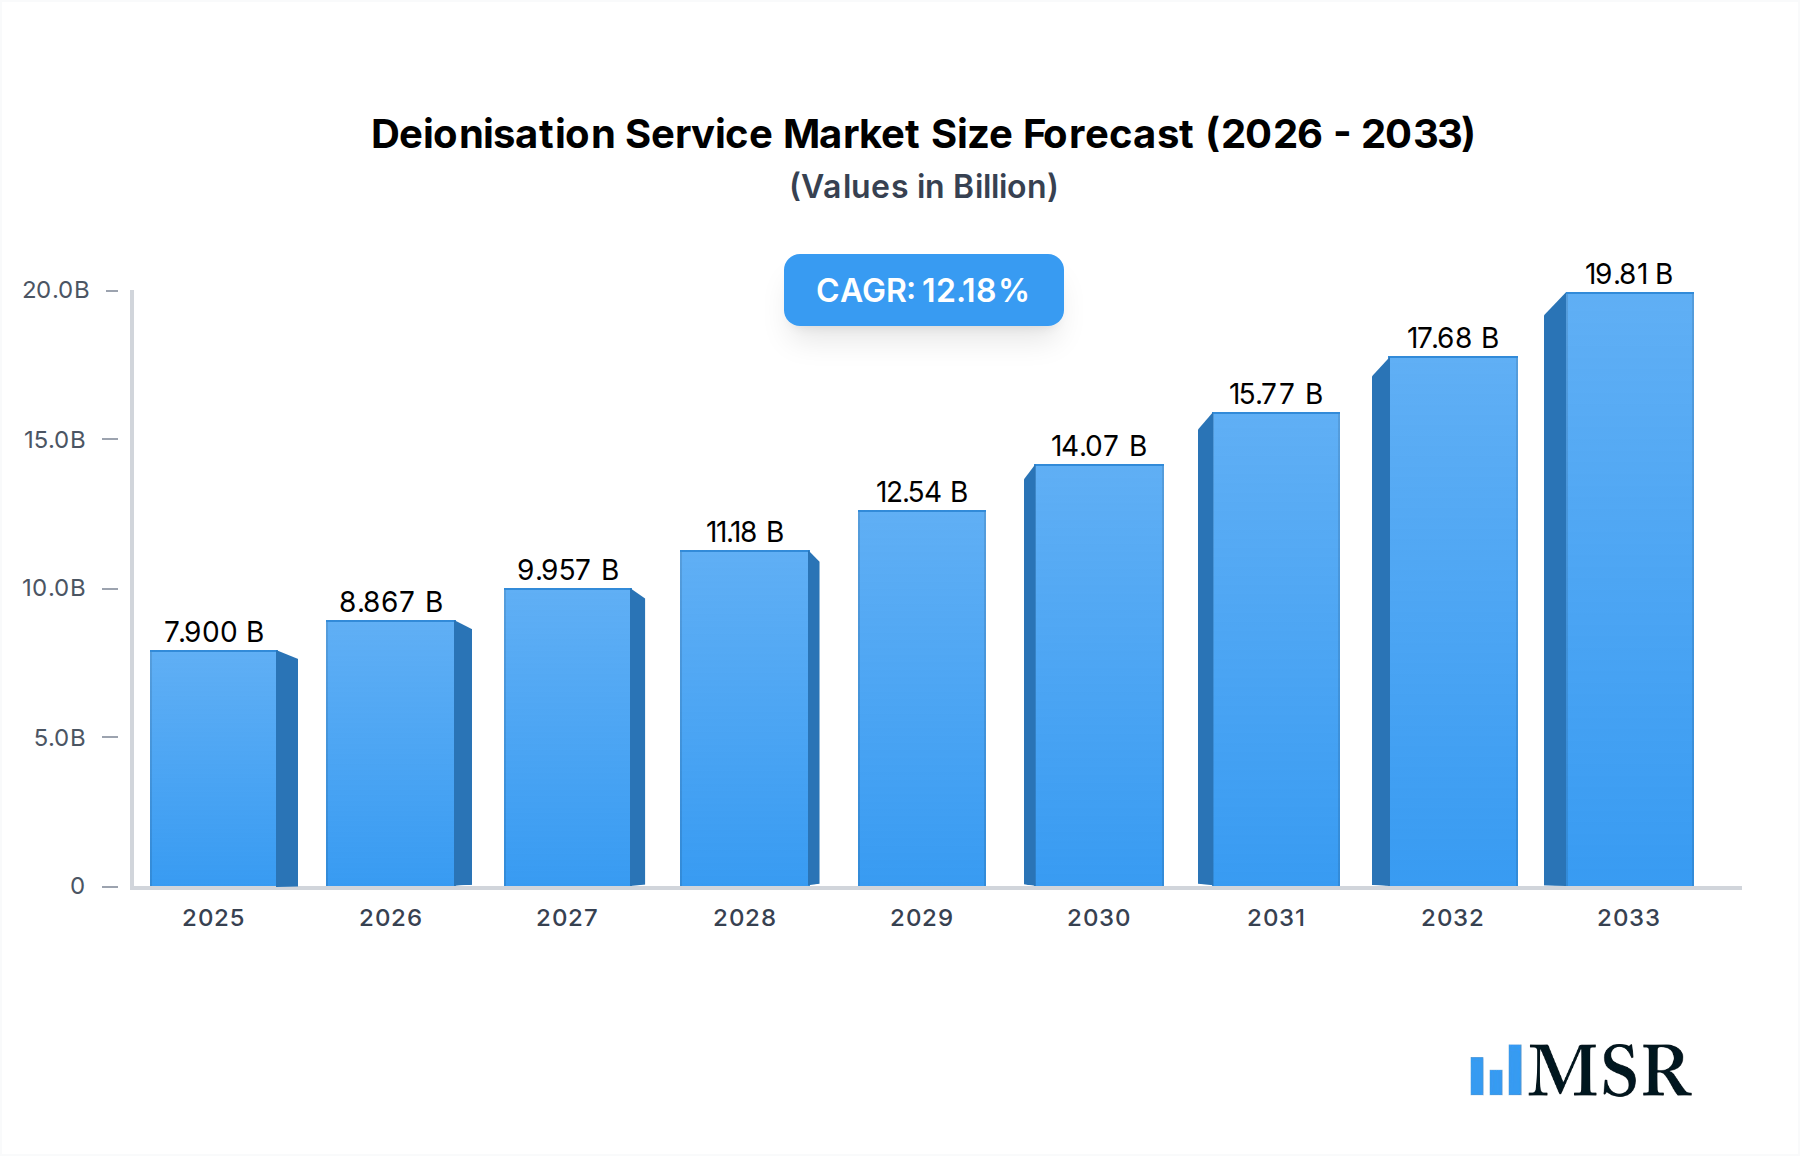
Deionisation Service Market Size (In Billion)
The market is strategically segmented by type, with "Service Deionization" and "Electrode Ionization Service" forming the primary categories. The growing emphasis on sustainable and efficient water treatment solutions is a notable trend, propelling the adoption of advanced deionization technologies. While the market exhibits strong growth potential, certain restraints such as the high initial capital investment for sophisticated deionization systems and the operational costs associated with regeneration and maintenance might pose challenges. However, the continuous innovation in water treatment technologies, coupled with a growing awareness of the environmental and economic benefits of efficient water management, is expected to outweigh these limitations. Leading companies such as Veolia, Evoqua Water Technologies, and Culligan Water are actively investing in research and development to offer more efficient and cost-effective deionization services, further stimulating market expansion.

Deionisation Service Company Market Share
Deionisation Service Market Research Report 2024-2033: Driving Purity Across Industries
Unlock the future of high-purity water solutions with our comprehensive Deionisation Service Market Research Report. This in-depth analysis, spanning the study period of 2019–2033 with a base year of 2025, provides critical insights into market dynamics, technological advancements, and growth opportunities within the deionisation service sector. Driven by increasing demand from Mechanical Engineering, Automotive, Aeronautics, Marine, Oil And Gas, Chemical Industry, Medical, and Electrical applications, this report is an indispensable resource for industry stakeholders, investors, and decision-makers seeking to capitalize on a market projected to reach billions in value.
Deionisation Service Market Concentration & Dynamics
The global Deionisation Service market exhibits moderate to high concentration, characterized by the presence of a few dominant players alongside a growing number of specialized providers. Innovation ecosystems are flourishing, driven by intense R&D in advanced ion exchange resins, membrane technologies, and process optimization. Regulatory frameworks are becoming increasingly stringent, particularly in the Medical and Chemical Industry sectors, pushing for higher purity standards and sustainable practices. Substitute products, such as reverse osmosis and distillation, continue to offer competition, but deionisation services maintain a competitive edge in specific applications requiring ultra-high purity. End-user trends are shifting towards a greater emphasis on operational efficiency, cost-effectiveness, and environmental compliance. Mergers and acquisitions (M&A) activities are a significant factor in shaping market dynamics, with an estimated 15 billion worth of M&A deals anticipated within the forecast period. Market share distribution sees companies like Veolia and Evoqua Water Technologies holding substantial portions, while emerging players are carving out niches through specialized service offerings. The ongoing consolidation and strategic partnerships are key indicators of the market's maturity and future growth trajectory.
- Market Concentration: Moderate to High, with key players like Veolia and Evoqua Water Technologies.
- Innovation Ecosystems: Driven by R&D in advanced resins and membrane technologies.
- Regulatory Frameworks: Increasingly stringent, especially in Medical and Chemical industries.
- Substitute Products: Reverse Osmosis, Distillation; deionisation remains competitive for ultra-high purity.
- End-User Trends: Focus on efficiency, cost-effectiveness, and sustainability.
- M&A Activities: Significant, with an estimated 15 billion in deals anticipated.
Deionisation Service Industry Insights & Trends
The Deionisation Service industry is poised for robust growth, projected to expand from a market size of approximately 40 billion in the historical period to an estimated 60 billion by the end of the forecast period. This growth is fueled by a confluence of technological advancements, increasing industrialization across developing economies, and the unwavering need for ultrapure water in critical sectors. The Compound Annual Growth Rate (CAGR) is estimated to be a healthy 4.5% over the forecast period (2025–2033). Technological disruptions are at the forefront, with continuous improvements in ion exchange resins offering higher capacity, longer lifespan, and enhanced regeneration efficiency. Electrodeionization (EDI) is gaining traction as a more sustainable and cost-effective alternative to traditional methods, particularly in applications demanding consistent ultra-high purity with minimal chemical usage. Evolving consumer behaviors, particularly in industries like Medical and Electrical, are driving demand for stringent quality control and traceability, making reliable deionisation services indispensable. Furthermore, the growing emphasis on water conservation and the circular economy is prompting industries to invest in advanced water treatment solutions that minimize waste and maximize resource utilization, directly benefiting the deionisation service market. The increasing complexity of manufacturing processes in sectors such as semiconductors and pharmaceuticals necessitates water of exceptional purity, creating a sustained demand for specialized deionisation services. The adoption of smart technologies and IoT in water treatment systems is also enabling better monitoring, control, and predictive maintenance, further enhancing the value proposition of deionisation service providers.
Key Markets & Segments Leading Deionisation Service
The Chemical Industry stands out as a dominant force in the Deionisation Service market, driven by its inherent need for high-purity water in a myriad of chemical synthesis, purification, and formulation processes. This segment alone is estimated to contribute over 25 billion to the global market value by 2025. The Medical sector is another critical driver, with stringent requirements for ultrapure water in pharmaceuticals manufacturing, dialysis, and laboratory applications, projecting a segment value of approximately 15 billion. The Electrical industry, particularly semiconductor manufacturing, relies heavily on deionised water for cleaning and rinsing processes, contributing an estimated 10 billion.
Dominant Region/Country: North America and Europe currently lead, driven by established industrial bases and advanced technological adoption. However, Asia Pacific is exhibiting the fastest growth due to rapid industrialization and increasing investments in high-tech manufacturing.
Dominant Application Segment:
- Chemical Industry: Essential for chemical synthesis, purification, and formulation.
- Drivers: Growing demand for specialty chemicals, stringent quality standards in manufacturing.
- Dominance Analysis: Processes like catalyst production, drug synthesis, and high-purity solvent manufacturing are entirely dependent on deionised water, making this segment a cornerstone of the market.
- Medical: Critical for pharmaceuticals, medical devices, and healthcare facilities.
- Drivers: Increasing healthcare spending, rising demand for biologics and sterile products.
- Dominance Analysis: The stringent regulations governing the medical field necessitate deionised water for everything from injectable drug formulation to equipment sterilization, ensuring absolute purity and safety.
- Electrical: Crucial for semiconductor fabrication and electronics manufacturing.
- Drivers: Exponential growth in the electronics industry, demand for miniaturization requiring finer manufacturing tolerances.
- Dominance Analysis: The manufacturing of microchips and other electronic components involves intricate cleaning and etching steps where even trace impurities in water can render products unusable, underscoring the indispensability of deionised water.
- Chemical Industry: Essential for chemical synthesis, purification, and formulation.
Dominant Type:
- Service Deionization: This segment, encompassing the provision and maintenance of deionisation systems, holds the largest market share, estimated at 45 billion.
- Drivers: Ease of operation for end-users, access to specialized expertise, and predictable operational costs.
- Dominance Analysis: Many industries prefer outsourcing their deionisation needs to specialized service providers who can ensure optimal performance, regular maintenance, and adherence to regulatory standards, reducing their in-house operational burden.
- Electrode Ionization Service: This type is experiencing rapid growth due to its efficiency and environmental benefits, projected to reach 15 billion.
- Drivers: Growing preference for chemical-free regeneration, lower operating costs in the long run, and consistent high-purity output.
- Dominance Analysis: As industries become more environmentally conscious and cost-aware, EDI systems are becoming increasingly attractive, especially for continuous high-volume deionisation requirements, offering a more sustainable and often more economical solution over time.
- Service Deionization: This segment, encompassing the provision and maintenance of deionisation systems, holds the largest market share, estimated at 45 billion.
Deionisation Service Product Developments
Recent product developments in deionisation services are focused on enhancing efficiency, sustainability, and intelligence. Innovations include advanced ion exchange resins with higher capacity and improved regeneration capabilities, leading to reduced chemical consumption and waste. Membrane technologies are also evolving, offering greater selectivity and energy efficiency. The integration of IoT and AI in deionisation systems enables real-time monitoring, predictive maintenance, and automated process optimization, ensuring consistent ultra-high purity water delivery and minimizing downtime. Mobile deionisation units and on-demand services are also gaining traction, offering flexibility and cost-effectiveness for intermittent needs.
Challenges in the Deionisation Service Market
The Deionisation Service market faces several challenges, including the high initial capital investment for advanced systems, which can be a barrier for smaller enterprises. Fluctuations in the cost of raw materials for ion exchange resins and membranes can impact operational expenses. Stringent regulatory compliance, especially in sectors like pharmaceuticals, requires continuous investment in quality control and validation. Furthermore, the availability of skilled technicians for installation, maintenance, and operation of sophisticated deionisation equipment can be a constraint. Competition from alternative water purification technologies also remains a persistent challenge, demanding continuous innovation and service differentiation.
- High Capital Investment: Initial setup costs for advanced deionisation systems.
- Raw Material Price Volatility: Fluctuations in resin and membrane costs.
- Stringent Regulatory Compliance: Continuous investment in quality assurance and validation.
- Skilled Workforce Availability: Shortage of trained technicians.
- Competition from Alternatives: Ongoing pressure from RO, distillation, and other technologies.
Forces Driving Deionisation Service Growth
Several forces are propelling the growth of the Deionisation Service market. The increasing industrialization and manufacturing output globally, particularly in emerging economies, is a primary driver. The escalating demand for high-purity water in critical sectors like semiconductors, pharmaceuticals, and healthcare due to evolving product standards and technological advancements is paramount. Furthermore, a growing emphasis on environmental sustainability and water conservation is pushing industries to adopt more efficient and less chemically intensive water treatment methods like deionisation. Government initiatives promoting clean water and industrial compliance also play a significant role in market expansion.
Challenges in the Deionisation Service Market
While growth is evident, the Deionisation Service market faces long-term growth catalysts that need careful navigation. Overcoming the perception of deionisation as a commodity service and highlighting its value in enabling critical industrial processes is crucial. Continued investment in R&D for more sustainable and cost-effective resin regeneration and membrane technologies will be vital. Expanding service offerings to include comprehensive water management solutions, encompassing pre-treatment and post-treatment, can create new revenue streams and customer loyalty. Strategic partnerships with equipment manufacturers and end-user industries will be key to fostering innovation and market penetration.
Emerging Opportunities in Deionisation Service
Emerging opportunities in the Deionisation Service market are diverse and promising. The increasing focus on water reuse and the circular economy presents a significant avenue for deionisation services to play a pivotal role in treating wastewater for industrial reuse. The burgeoning biotechnology sector and the growing demand for advanced therapies requiring ultra-pure water offer substantial growth potential. Development of portable and modular deionisation systems for remote locations or emergency response situations is another untapped opportunity. Furthermore, leveraging big data analytics and AI to optimize deionisation processes and provide predictive insights to clients can create a significant competitive advantage and new service models.
Leading Players in the Deionisation Service Sector
- Veolia
- WaterProfessionals
- Culligan Water
- FCT Water Treatment
- High Purity Water Services
- Filterco Water Treatment Ltd
- Wychwood Water Systems
- W2 Systems
- Complete Water Solutions
- Lubron Water Technologies
- Evoqua Water Technologies
- AWC
- Gem Scientific
Key Milestones in Deionisation Service Industry
- 2019: Introduction of advanced ion exchange resins with extended lifespan and higher capacity, improving efficiency by approximately 15%.
- 2020: Significant increase in M&A activity as larger players acquire smaller, specialized deionisation service providers to expand their market reach and service portfolios.
- 2021: Development of smart deionisation systems with IoT integration for real-time monitoring and predictive maintenance, enhancing operational reliability.
- 2022: Growing adoption of Electrodeionization (EDI) technology in the semiconductor industry due to its chemical-free operation and consistent high purity output, driving segment growth.
- 2023: Increased focus on sustainable deionisation practices, with a rise in service providers offering energy-efficient regeneration methods and waste reduction solutions.
- 2024 (Estimated): Launch of next-generation membrane technologies offering superior ion removal and reduced fouling, further improving deionisation efficiency.
- 2025 (Base Year): Global Deionisation Service market valued at approximately 50 billion.
- 2026-2030: Expected period of accelerated market growth driven by increasing demand from the Medical and Electrical sectors and technological advancements.
- 2031-2033: Continued expansion of Electrode Ionization Service and integrated water treatment solutions, with a strong emphasis on sustainability and digital integration.
Strategic Outlook for Deionisation Service Market
The strategic outlook for the Deionisation Service market is one of sustained and significant growth, driven by technological innovation, expanding industrial needs, and a growing commitment to environmental responsibility. Companies that focus on developing highly efficient, cost-effective, and sustainable deionisation solutions, coupled with exceptional customer service and data-driven insights, will be best positioned for success. Embracing digital transformation, investing in advanced materials, and fostering strategic alliances will be crucial for navigating the competitive landscape and capitalizing on emerging opportunities. The market is ripe for leaders who can offer comprehensive water purity solutions that address the evolving demands of a diverse industrial base.
Deionisation Service Segmentation
-
1. Application
- 1.1. Mechanical Engineering
- 1.2. Automotive
- 1.3. Aeronautics
- 1.4. Marine
- 1.5. Oil And Gas
- 1.6. Chemical Industry
- 1.7. Medical
- 1.8. Electrical
-
2. Types
- 2.1. Service Deionization
- 2.2. Electrode Ionization Service
Deionisation Service Segmentation By Geography
-
1. North America
- 1.1. United States
- 1.2. Canada
- 1.3. Mexico
-
2. South America
- 2.1. Brazil
- 2.2. Argentina
- 2.3. Rest of South America
-
3. Europe
- 3.1. United Kingdom
- 3.2. Germany
- 3.3. France
- 3.4. Italy
- 3.5. Spain
- 3.6. Russia
- 3.7. Benelux
- 3.8. Nordics
- 3.9. Rest of Europe
-
4. Middle East & Africa
- 4.1. Turkey
- 4.2. Israel
- 4.3. GCC
- 4.4. North Africa
- 4.5. South Africa
- 4.6. Rest of Middle East & Africa
-
5. Asia Pacific
- 5.1. China
- 5.2. India
- 5.3. Japan
- 5.4. South Korea
- 5.5. ASEAN
- 5.6. Oceania
- 5.7. Rest of Asia Pacific
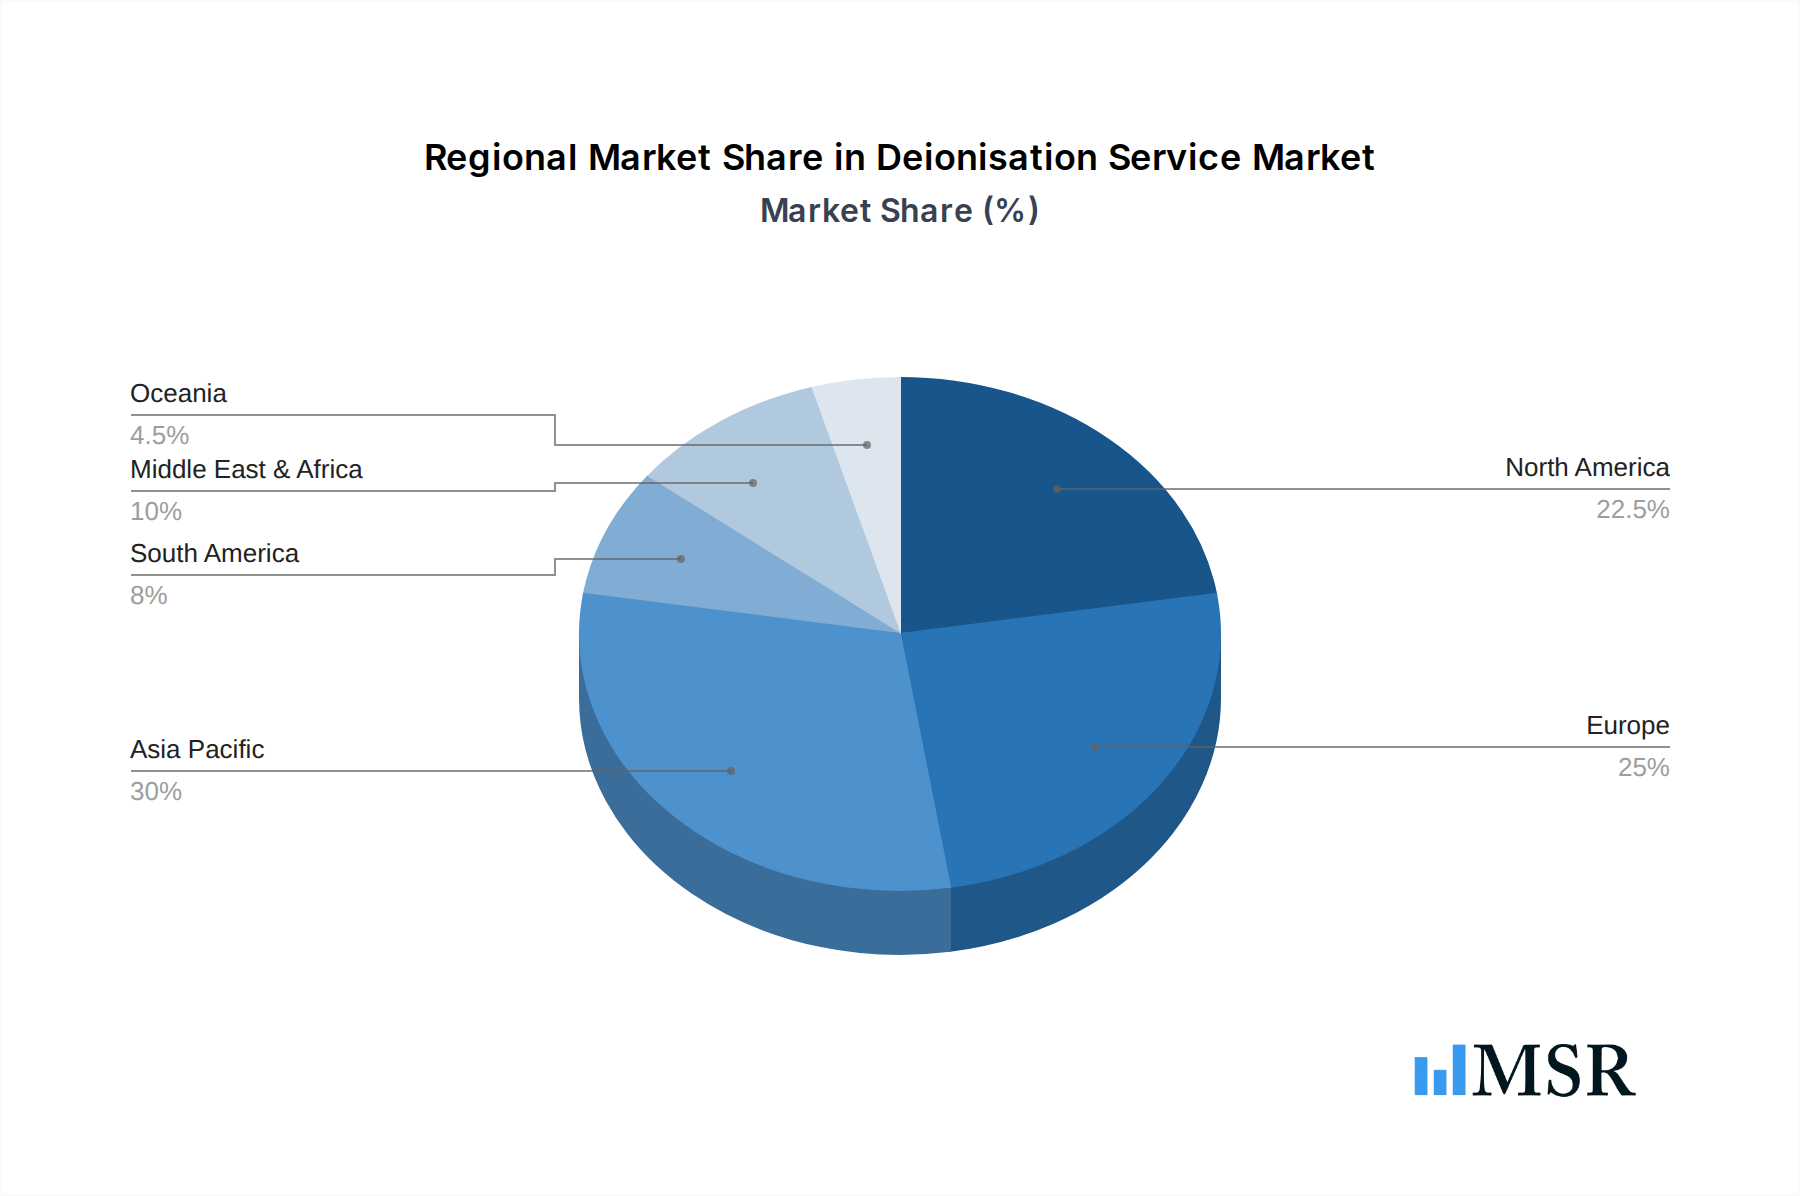
Deionisation Service Regional Market Share
Geographic Coverage of Deionisation Service
Deionisation Service REPORT HIGHLIGHTS
| Aspects | Details |
|---|---|
| Study Period | 2020-2034 |
| Base Year | 2025 |
| Estimated Year | 2026 |
| Forecast Period | 2026-2034 |
| Historical Period | 2020-2025 |
| Growth Rate | CAGR of 11.7% from 2020-2034 |
| Segmentation |
|
Table of Contents
- 1. Introduction
- 1.1. Research Scope
- 1.2. Market Segmentation
- 1.3. Research Methodology
- 1.4. Definitions and Assumptions
- 2. Executive Summary
- 2.1. Introduction
- 3. Market Dynamics
- 3.1. Introduction
- 3.2. Market Drivers
- 3.3. Market Restrains
- 3.4. Market Trends
- 4. Market Factor Analysis
- 4.1. Porters Five Forces
- 4.2. Supply/Value Chain
- 4.3. PESTEL analysis
- 4.4. Market Entropy
- 4.5. Patent/Trademark Analysis
- 5. Global Deionisation Service Analysis, Insights and Forecast, 2020-2032
- 5.1. Market Analysis, Insights and Forecast - by Application
- 5.1.1. Mechanical Engineering
- 5.1.2. Automotive
- 5.1.3. Aeronautics
- 5.1.4. Marine
- 5.1.5. Oil And Gas
- 5.1.6. Chemical Industry
- 5.1.7. Medical
- 5.1.8. Electrical
- 5.2. Market Analysis, Insights and Forecast - by Types
- 5.2.1. Service Deionization
- 5.2.2. Electrode Ionization Service
- 5.3. Market Analysis, Insights and Forecast - by Region
- 5.3.1. North America
- 5.3.2. South America
- 5.3.3. Europe
- 5.3.4. Middle East & Africa
- 5.3.5. Asia Pacific
- 5.1. Market Analysis, Insights and Forecast - by Application
- 6. North America Deionisation Service Analysis, Insights and Forecast, 2020-2032
- 6.1. Market Analysis, Insights and Forecast - by Application
- 6.1.1. Mechanical Engineering
- 6.1.2. Automotive
- 6.1.3. Aeronautics
- 6.1.4. Marine
- 6.1.5. Oil And Gas
- 6.1.6. Chemical Industry
- 6.1.7. Medical
- 6.1.8. Electrical
- 6.2. Market Analysis, Insights and Forecast - by Types
- 6.2.1. Service Deionization
- 6.2.2. Electrode Ionization Service
- 6.1. Market Analysis, Insights and Forecast - by Application
- 7. South America Deionisation Service Analysis, Insights and Forecast, 2020-2032
- 7.1. Market Analysis, Insights and Forecast - by Application
- 7.1.1. Mechanical Engineering
- 7.1.2. Automotive
- 7.1.3. Aeronautics
- 7.1.4. Marine
- 7.1.5. Oil And Gas
- 7.1.6. Chemical Industry
- 7.1.7. Medical
- 7.1.8. Electrical
- 7.2. Market Analysis, Insights and Forecast - by Types
- 7.2.1. Service Deionization
- 7.2.2. Electrode Ionization Service
- 7.1. Market Analysis, Insights and Forecast - by Application
- 8. Europe Deionisation Service Analysis, Insights and Forecast, 2020-2032
- 8.1. Market Analysis, Insights and Forecast - by Application
- 8.1.1. Mechanical Engineering
- 8.1.2. Automotive
- 8.1.3. Aeronautics
- 8.1.4. Marine
- 8.1.5. Oil And Gas
- 8.1.6. Chemical Industry
- 8.1.7. Medical
- 8.1.8. Electrical
- 8.2. Market Analysis, Insights and Forecast - by Types
- 8.2.1. Service Deionization
- 8.2.2. Electrode Ionization Service
- 8.1. Market Analysis, Insights and Forecast - by Application
- 9. Middle East & Africa Deionisation Service Analysis, Insights and Forecast, 2020-2032
- 9.1. Market Analysis, Insights and Forecast - by Application
- 9.1.1. Mechanical Engineering
- 9.1.2. Automotive
- 9.1.3. Aeronautics
- 9.1.4. Marine
- 9.1.5. Oil And Gas
- 9.1.6. Chemical Industry
- 9.1.7. Medical
- 9.1.8. Electrical
- 9.2. Market Analysis, Insights and Forecast - by Types
- 9.2.1. Service Deionization
- 9.2.2. Electrode Ionization Service
- 9.1. Market Analysis, Insights and Forecast - by Application
- 10. Asia Pacific Deionisation Service Analysis, Insights and Forecast, 2020-2032
- 10.1. Market Analysis, Insights and Forecast - by Application
- 10.1.1. Mechanical Engineering
- 10.1.2. Automotive
- 10.1.3. Aeronautics
- 10.1.4. Marine
- 10.1.5. Oil And Gas
- 10.1.6. Chemical Industry
- 10.1.7. Medical
- 10.1.8. Electrical
- 10.2. Market Analysis, Insights and Forecast - by Types
- 10.2.1. Service Deionization
- 10.2.2. Electrode Ionization Service
- 10.1. Market Analysis, Insights and Forecast - by Application
- 11. Competitive Analysis
- 11.1. Global Market Share Analysis 2025
- 11.2. Company Profiles
- 11.2.1 Veolia
- 11.2.1.1. Overview
- 11.2.1.2. Products
- 11.2.1.3. SWOT Analysis
- 11.2.1.4. Recent Developments
- 11.2.1.5. Financials (Based on Availability)
- 11.2.2 WaterProfessionals
- 11.2.2.1. Overview
- 11.2.2.2. Products
- 11.2.2.3. SWOT Analysis
- 11.2.2.4. Recent Developments
- 11.2.2.5. Financials (Based on Availability)
- 11.2.3 Culligan Water
- 11.2.3.1. Overview
- 11.2.3.2. Products
- 11.2.3.3. SWOT Analysis
- 11.2.3.4. Recent Developments
- 11.2.3.5. Financials (Based on Availability)
- 11.2.4 FCT Water Treatment
- 11.2.4.1. Overview
- 11.2.4.2. Products
- 11.2.4.3. SWOT Analysis
- 11.2.4.4. Recent Developments
- 11.2.4.5. Financials (Based on Availability)
- 11.2.5 High Purity Water Services
- 11.2.5.1. Overview
- 11.2.5.2. Products
- 11.2.5.3. SWOT Analysis
- 11.2.5.4. Recent Developments
- 11.2.5.5. Financials (Based on Availability)
- 11.2.6 Filterco Water Treatment Ltd
- 11.2.6.1. Overview
- 11.2.6.2. Products
- 11.2.6.3. SWOT Analysis
- 11.2.6.4. Recent Developments
- 11.2.6.5. Financials (Based on Availability)
- 11.2.7 Wychwood Water Systems
- 11.2.7.1. Overview
- 11.2.7.2. Products
- 11.2.7.3. SWOT Analysis
- 11.2.7.4. Recent Developments
- 11.2.7.5. Financials (Based on Availability)
- 11.2.8 W2 Systems
- 11.2.8.1. Overview
- 11.2.8.2. Products
- 11.2.8.3. SWOT Analysis
- 11.2.8.4. Recent Developments
- 11.2.8.5. Financials (Based on Availability)
- 11.2.9 Complete Water Solutions
- 11.2.9.1. Overview
- 11.2.9.2. Products
- 11.2.9.3. SWOT Analysis
- 11.2.9.4. Recent Developments
- 11.2.9.5. Financials (Based on Availability)
- 11.2.10 Lubron Water Technologies
- 11.2.10.1. Overview
- 11.2.10.2. Products
- 11.2.10.3. SWOT Analysis
- 11.2.10.4. Recent Developments
- 11.2.10.5. Financials (Based on Availability)
- 11.2.11 Evoqua Water Technologies
- 11.2.11.1. Overview
- 11.2.11.2. Products
- 11.2.11.3. SWOT Analysis
- 11.2.11.4. Recent Developments
- 11.2.11.5. Financials (Based on Availability)
- 11.2.12 AWC
- 11.2.12.1. Overview
- 11.2.12.2. Products
- 11.2.12.3. SWOT Analysis
- 11.2.12.4. Recent Developments
- 11.2.12.5. Financials (Based on Availability)
- 11.2.13 Gem Scientific
- 11.2.13.1. Overview
- 11.2.13.2. Products
- 11.2.13.3. SWOT Analysis
- 11.2.13.4. Recent Developments
- 11.2.13.5. Financials (Based on Availability)
- 11.2.1 Veolia
List of Figures
- Figure 1: Global Deionisation Service Revenue Breakdown (undefined, %) by Region 2025 & 2033
- Figure 2: North America Deionisation Service Revenue (undefined), by Application 2025 & 2033
- Figure 3: North America Deionisation Service Revenue Share (%), by Application 2025 & 2033
- Figure 4: North America Deionisation Service Revenue (undefined), by Types 2025 & 2033
- Figure 5: North America Deionisation Service Revenue Share (%), by Types 2025 & 2033
- Figure 6: North America Deionisation Service Revenue (undefined), by Country 2025 & 2033
- Figure 7: North America Deionisation Service Revenue Share (%), by Country 2025 & 2033
- Figure 8: South America Deionisation Service Revenue (undefined), by Application 2025 & 2033
- Figure 9: South America Deionisation Service Revenue Share (%), by Application 2025 & 2033
- Figure 10: South America Deionisation Service Revenue (undefined), by Types 2025 & 2033
- Figure 11: South America Deionisation Service Revenue Share (%), by Types 2025 & 2033
- Figure 12: South America Deionisation Service Revenue (undefined), by Country 2025 & 2033
- Figure 13: South America Deionisation Service Revenue Share (%), by Country 2025 & 2033
- Figure 14: Europe Deionisation Service Revenue (undefined), by Application 2025 & 2033
- Figure 15: Europe Deionisation Service Revenue Share (%), by Application 2025 & 2033
- Figure 16: Europe Deionisation Service Revenue (undefined), by Types 2025 & 2033
- Figure 17: Europe Deionisation Service Revenue Share (%), by Types 2025 & 2033
- Figure 18: Europe Deionisation Service Revenue (undefined), by Country 2025 & 2033
- Figure 19: Europe Deionisation Service Revenue Share (%), by Country 2025 & 2033
- Figure 20: Middle East & Africa Deionisation Service Revenue (undefined), by Application 2025 & 2033
- Figure 21: Middle East & Africa Deionisation Service Revenue Share (%), by Application 2025 & 2033
- Figure 22: Middle East & Africa Deionisation Service Revenue (undefined), by Types 2025 & 2033
- Figure 23: Middle East & Africa Deionisation Service Revenue Share (%), by Types 2025 & 2033
- Figure 24: Middle East & Africa Deionisation Service Revenue (undefined), by Country 2025 & 2033
- Figure 25: Middle East & Africa Deionisation Service Revenue Share (%), by Country 2025 & 2033
- Figure 26: Asia Pacific Deionisation Service Revenue (undefined), by Application 2025 & 2033
- Figure 27: Asia Pacific Deionisation Service Revenue Share (%), by Application 2025 & 2033
- Figure 28: Asia Pacific Deionisation Service Revenue (undefined), by Types 2025 & 2033
- Figure 29: Asia Pacific Deionisation Service Revenue Share (%), by Types 2025 & 2033
- Figure 30: Asia Pacific Deionisation Service Revenue (undefined), by Country 2025 & 2033
- Figure 31: Asia Pacific Deionisation Service Revenue Share (%), by Country 2025 & 2033
List of Tables
- Table 1: Global Deionisation Service Revenue undefined Forecast, by Application 2020 & 2033
- Table 2: Global Deionisation Service Revenue undefined Forecast, by Types 2020 & 2033
- Table 3: Global Deionisation Service Revenue undefined Forecast, by Region 2020 & 2033
- Table 4: Global Deionisation Service Revenue undefined Forecast, by Application 2020 & 2033
- Table 5: Global Deionisation Service Revenue undefined Forecast, by Types 2020 & 2033
- Table 6: Global Deionisation Service Revenue undefined Forecast, by Country 2020 & 2033
- Table 7: United States Deionisation Service Revenue (undefined) Forecast, by Application 2020 & 2033
- Table 8: Canada Deionisation Service Revenue (undefined) Forecast, by Application 2020 & 2033
- Table 9: Mexico Deionisation Service Revenue (undefined) Forecast, by Application 2020 & 2033
- Table 10: Global Deionisation Service Revenue undefined Forecast, by Application 2020 & 2033
- Table 11: Global Deionisation Service Revenue undefined Forecast, by Types 2020 & 2033
- Table 12: Global Deionisation Service Revenue undefined Forecast, by Country 2020 & 2033
- Table 13: Brazil Deionisation Service Revenue (undefined) Forecast, by Application 2020 & 2033
- Table 14: Argentina Deionisation Service Revenue (undefined) Forecast, by Application 2020 & 2033
- Table 15: Rest of South America Deionisation Service Revenue (undefined) Forecast, by Application 2020 & 2033
- Table 16: Global Deionisation Service Revenue undefined Forecast, by Application 2020 & 2033
- Table 17: Global Deionisation Service Revenue undefined Forecast, by Types 2020 & 2033
- Table 18: Global Deionisation Service Revenue undefined Forecast, by Country 2020 & 2033
- Table 19: United Kingdom Deionisation Service Revenue (undefined) Forecast, by Application 2020 & 2033
- Table 20: Germany Deionisation Service Revenue (undefined) Forecast, by Application 2020 & 2033
- Table 21: France Deionisation Service Revenue (undefined) Forecast, by Application 2020 & 2033
- Table 22: Italy Deionisation Service Revenue (undefined) Forecast, by Application 2020 & 2033
- Table 23: Spain Deionisation Service Revenue (undefined) Forecast, by Application 2020 & 2033
- Table 24: Russia Deionisation Service Revenue (undefined) Forecast, by Application 2020 & 2033
- Table 25: Benelux Deionisation Service Revenue (undefined) Forecast, by Application 2020 & 2033
- Table 26: Nordics Deionisation Service Revenue (undefined) Forecast, by Application 2020 & 2033
- Table 27: Rest of Europe Deionisation Service Revenue (undefined) Forecast, by Application 2020 & 2033
- Table 28: Global Deionisation Service Revenue undefined Forecast, by Application 2020 & 2033
- Table 29: Global Deionisation Service Revenue undefined Forecast, by Types 2020 & 2033
- Table 30: Global Deionisation Service Revenue undefined Forecast, by Country 2020 & 2033
- Table 31: Turkey Deionisation Service Revenue (undefined) Forecast, by Application 2020 & 2033
- Table 32: Israel Deionisation Service Revenue (undefined) Forecast, by Application 2020 & 2033
- Table 33: GCC Deionisation Service Revenue (undefined) Forecast, by Application 2020 & 2033
- Table 34: North Africa Deionisation Service Revenue (undefined) Forecast, by Application 2020 & 2033
- Table 35: South Africa Deionisation Service Revenue (undefined) Forecast, by Application 2020 & 2033
- Table 36: Rest of Middle East & Africa Deionisation Service Revenue (undefined) Forecast, by Application 2020 & 2033
- Table 37: Global Deionisation Service Revenue undefined Forecast, by Application 2020 & 2033
- Table 38: Global Deionisation Service Revenue undefined Forecast, by Types 2020 & 2033
- Table 39: Global Deionisation Service Revenue undefined Forecast, by Country 2020 & 2033
- Table 40: China Deionisation Service Revenue (undefined) Forecast, by Application 2020 & 2033
- Table 41: India Deionisation Service Revenue (undefined) Forecast, by Application 2020 & 2033
- Table 42: Japan Deionisation Service Revenue (undefined) Forecast, by Application 2020 & 2033
- Table 43: South Korea Deionisation Service Revenue (undefined) Forecast, by Application 2020 & 2033
- Table 44: ASEAN Deionisation Service Revenue (undefined) Forecast, by Application 2020 & 2033
- Table 45: Oceania Deionisation Service Revenue (undefined) Forecast, by Application 2020 & 2033
- Table 46: Rest of Asia Pacific Deionisation Service Revenue (undefined) Forecast, by Application 2020 & 2033
Frequently Asked Questions
1. What is the projected Compound Annual Growth Rate (CAGR) of the Deionisation Service?
The projected CAGR is approximately 11.7%.
2. Which companies are prominent players in the Deionisation Service?
Key companies in the market include Veolia, WaterProfessionals, Culligan Water, FCT Water Treatment, High Purity Water Services, Filterco Water Treatment Ltd, Wychwood Water Systems, W2 Systems, Complete Water Solutions, Lubron Water Technologies, Evoqua Water Technologies, AWC, Gem Scientific.
3. What are the main segments of the Deionisation Service?
The market segments include Application, Types.
4. Can you provide details about the market size?
The market size is estimated to be USD XXX N/A as of 2022.
5. What are some drivers contributing to market growth?
N/A
6. What are the notable trends driving market growth?
N/A
7. Are there any restraints impacting market growth?
N/A
8. Can you provide examples of recent developments in the market?
N/A
9. What pricing options are available for accessing the report?
Pricing options include single-user, multi-user, and enterprise licenses priced at USD 3350.00, USD 5025.00, and USD 6700.00 respectively.
10. Is the market size provided in terms of value or volume?
The market size is provided in terms of value, measured in N/A.
11. Are there any specific market keywords associated with the report?
Yes, the market keyword associated with the report is "Deionisation Service," which aids in identifying and referencing the specific market segment covered.
12. How do I determine which pricing option suits my needs best?
The pricing options vary based on user requirements and access needs. Individual users may opt for single-user licenses, while businesses requiring broader access may choose multi-user or enterprise licenses for cost-effective access to the report.
13. Are there any additional resources or data provided in the Deionisation Service report?
While the report offers comprehensive insights, it's advisable to review the specific contents or supplementary materials provided to ascertain if additional resources or data are available.
14. How can I stay updated on further developments or reports in the Deionisation Service?
To stay informed about further developments, trends, and reports in the Deionisation Service, consider subscribing to industry newsletters, following relevant companies and organizations, or regularly checking reputable industry news sources and publications.
Methodology
Step 1 - Identification of Relevant Samples Size from Population Database


Step 2 - Approaches for Defining Global Market Size (Value, Volume* & Price*)

Note*: In applicable scenarios
Step 3 - Data Sources
Primary Research
- Web Analytics
- Survey Reports
- Research Institute
- Latest Research Reports
- Opinion Leaders
Secondary Research
- Annual Reports
- White Paper
- Latest Press Release
- Industry Association
- Paid Database
- Investor Presentations

Step 4 - Data Triangulation
Involves using different sources of information in order to increase the validity of a study
These sources are likely to be stakeholders in a program - participants, other researchers, program staff, other community members, and so on.
Then we put all data in single framework & apply various statistical tools to find out the dynamic on the market.
During the analysis stage, feedback from the stakeholder groups would be compared to determine areas of agreement as well as areas of divergence