

Key Insights
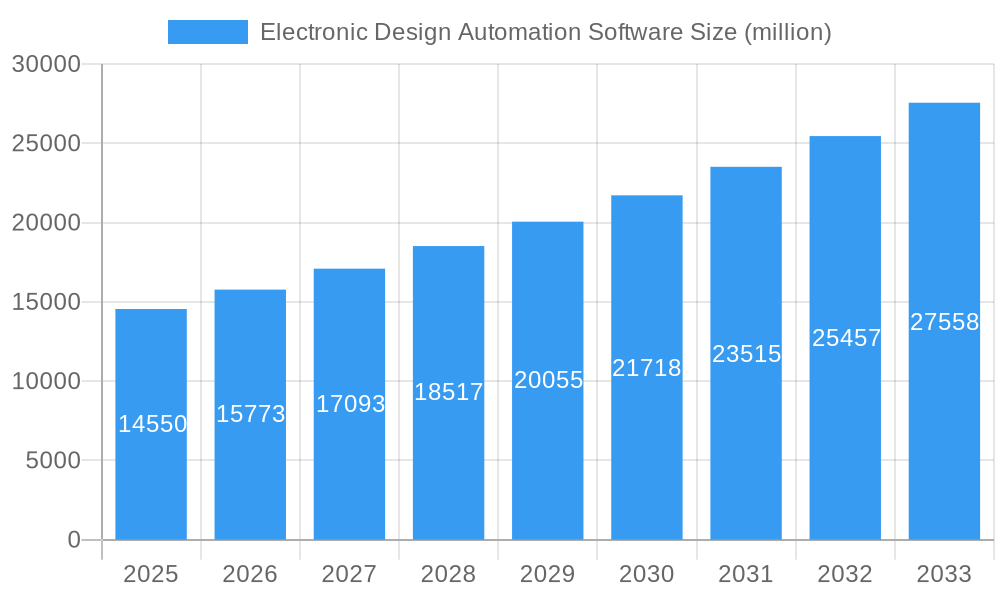
The Electronic Design Automation (EDA) software market is experiencing robust growth, driven by the increasing complexity of electronic systems and the accelerating adoption of advanced technologies like 5G, AI, and IoT. The market, estimated at $15 billion in 2025, is projected to maintain a Compound Annual Growth Rate (CAGR) of 8% from 2025 to 2033, reaching approximately $28 billion by 2033. This expansion is fueled by several key factors, including the rising demand for miniaturization, higher performance, and lower power consumption in electronic devices. The automotive, aerospace, and consumer electronics sectors are significant contributors to this growth, requiring sophisticated EDA tools for designing complex integrated circuits (ICs), printed circuit boards (PCBs), and embedded systems. Furthermore, the emergence of new design methodologies, such as system-on-chip (SoC) design and 3D IC packaging, is further stimulating demand for advanced EDA software solutions.
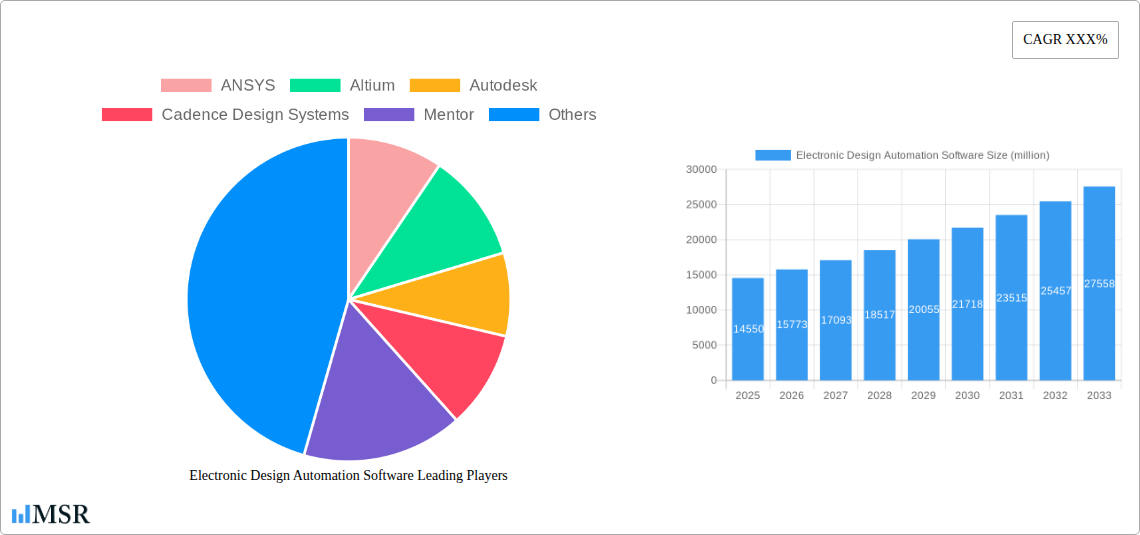
Electronic Design Automation Software Market Size (In Billion)
Major players like ANSYS, Autodesk, Cadence Design Systems, and Synopsys dominate the market, offering a wide range of software tools catering to different design stages and applications. However, the market is also witnessing the emergence of niche players specializing in specific EDA segments, such as verification and simulation. While the increasing complexity of software and hardware co-design presents challenges, the industry is actively addressing this through the development of innovative tools and methodologies. Geographic growth is expected to be diverse, with North America and Asia-Pacific experiencing particularly strong expansion due to robust technological advancements and substantial investments in electronics manufacturing in these regions. Potential restraints include high software licensing costs and the need for specialized expertise, but the overall market outlook remains positive due to the continuous innovation in the electronics industry and the pervasive integration of electronics into various aspects of modern life.
Electronic Design Automation Software Company Market Share
Electronic Design Automation (EDA) Software Market Report: 2019-2033
This comprehensive report provides an in-depth analysis of the Electronic Design Automation (EDA) software market, projecting a market value exceeding $XX million by 2033. The study covers the period from 2019 to 2033, with 2025 as the base and estimated year. This report is crucial for industry stakeholders, investors, and technology enthusiasts seeking to understand the market dynamics, growth drivers, and future opportunities within the EDA software landscape.
Electronic Design Automation Software Market Concentration & Dynamics
The EDA software market exhibits a moderately concentrated structure, with key players like Cadence Design Systems, Synopsys, and ANSYS holding significant market share. However, the presence of numerous niche players and emerging technologies fosters a dynamic competitive landscape. The market is characterized by continuous innovation, driven by the need for higher performance, lower power consumption, and increased design complexity in electronic systems. Regulatory frameworks, particularly those related to data security and intellectual property, play a crucial role in shaping market dynamics. Substitute products, while limited, include manual design processes which are becoming increasingly impractical for complex systems. End-user trends reveal a growing demand for cloud-based EDA solutions and increased automation capabilities.
- Market Share (2025 Estimate): Cadence: xx%, Synopsys: xx%, ANSYS: xx%, Others: xx%
- M&A Activity (2019-2024): A total of xx major mergers and acquisitions were recorded, reflecting industry consolidation and expansion into new markets.
Electronic Design Automation Software Industry Insights & Trends
The global Electronic Design Automation (EDA) software market is experiencing robust growth, projected to reach $XX million by 2033, exhibiting a CAGR of xx% during the forecast period (2025-2033). This growth is fueled by several key factors. The increasing complexity of electronic systems, particularly in the automotive, aerospace, and consumer electronics sectors, necessitates advanced EDA tools for efficient design and verification. Technological disruptions, such as the rise of artificial intelligence (AI) and machine learning (ML) in EDA workflows, are significantly enhancing design automation capabilities and accelerating product development cycles. Furthermore, evolving consumer behaviors, including the demand for sophisticated and interconnected devices, drive the need for innovative EDA solutions. The historical period (2019-2024) witnessed a steady growth trajectory, laying a strong foundation for future expansion.
Key Markets & Segments Leading Electronic Design Automation Software
The North American region currently holds the largest market share in EDA software, driven by a strong presence of key players, substantial R&D investments, and a robust electronics industry. However, the Asia-Pacific region, particularly China, is experiencing the fastest growth rate, fueled by rapid economic expansion, government initiatives promoting technological advancement, and a burgeoning consumer electronics market.
- Drivers in North America: Strong presence of major EDA vendors, robust semiconductor industry, high R&D spending.
- Drivers in Asia-Pacific: Rapid economic growth, government support for technology development, large consumer electronics market.
- Dominance Analysis: While North America maintains a larger market size, the Asia-Pacific region’s high growth rate suggests a potential shift in market leadership in the coming years.
Electronic Design Automation Software Product Developments
Recent product developments in EDA software have focused on incorporating AI and ML algorithms to optimize design flows, improve verification efficiency, and accelerate time-to-market. New applications are emerging in areas such as system-on-chip (SoC) design, 3D IC design, and high-speed digital signal processing. These advancements provide significant competitive advantages, enabling designers to create more complex, efficient, and reliable electronic systems. The integration of cloud computing is also transforming EDA software accessibility and collaborative capabilities.
Challenges in the Electronic Design Automation Software Market
The EDA software market faces challenges including the high cost of software licenses, the complexity of integrating various EDA tools, and the need for highly skilled engineers to operate these systems effectively. Furthermore, maintaining compliance with evolving regulatory standards and managing the complexities of global supply chains pose significant obstacles. Competitive pressures, particularly from smaller, agile companies offering specialized solutions, further intensify the challenges faced by established players. These factors collectively impact market growth and profitability.
Forces Driving Electronic Design Automation Software Growth
Several factors are driving the growth of the EDA software market. The increasing complexity of electronic systems, particularly in the automotive, aerospace, and consumer electronics industries, creates a demand for advanced EDA tools. Technological advancements, such as AI and ML-powered solutions, enhance design efficiency and accelerate product development cycles. Furthermore, government initiatives promoting technological advancements in various regions, coupled with the rising demand for sophisticated electronic devices, further propel market expansion.
Long-Term Growth Catalysts in Electronic Design Automation Software
Long-term growth in the EDA software market is strongly linked to continued innovation in design automation technologies. Strategic partnerships between EDA vendors and semiconductor manufacturers are expected to drive growth by creating integrated solutions. Expansion into new markets, particularly in emerging economies, will further contribute to market expansion. Furthermore, the development of new applications for EDA software, such as in the areas of quantum computing and flexible electronics, will open up significant opportunities for future growth.
Emerging Opportunities in Electronic Design Automation Software
Emerging opportunities lie in the development of EDA tools for new technologies like quantum computing and neuromorphic chips. The integration of cloud-based platforms and AI-driven automation will further enhance design efficiency and accessibility. The increasing demand for customized and personalized electronic devices creates opportunities for EDA vendors to provide tailored solutions for specific applications. New markets in developing economies, particularly in the areas of 5G and IoT infrastructure development, also present significant opportunities.
Leading Players in the Electronic Design Automation Software Sector
- ANSYS
- Altium
- Autodesk
- Cadence Design Systems
- Mentor, a Siemens business
- NVIDIA
- Silvaco
- Synopsys
- Xilinx (now part of AMD)
- Keysight Technologies
- Agnisys
- Aldec
- Lauterbach
- Zuken
Key Milestones in Electronic Design Automation Software Industry
- 2020: Increased adoption of cloud-based EDA solutions.
- 2021: Significant advancements in AI-powered design automation tools.
- 2022: Launch of several new EDA platforms for system-on-chip design.
- 2023: Several key acquisitions and mergers reshaping the industry landscape.
- 2024: Focus on enhancing security features within EDA software.
Strategic Outlook for Electronic Design Automation Software Market
The future of the EDA software market is bright, driven by continuous technological innovation and increasing demand for sophisticated electronic systems. Strategic partnerships, focused investments in R&D, and expansion into new markets will be crucial for success. The integration of AI and ML will continue to transform design workflows, leading to increased efficiency and faster time-to-market. The market is poised for sustained growth, offering significant opportunities for both established players and emerging companies.
Electronic Design Automation Software Segmentation
-
1. Application
- 1.1. Automotive
- 1.2. Aerospace & Defense
- 1.3. Consumer Electronics
- 1.4. Healthcare
- 1.5. Industrial
- 1.6. Other
-
2. Types
- 2.1. Cloud-based
- 2.2. On-premise
Electronic Design Automation Software Segmentation By Geography
-
1. North America
- 1.1. United States
- 1.2. Canada
- 1.3. Mexico
-
2. South America
- 2.1. Brazil
- 2.2. Argentina
- 2.3. Rest of South America
-
3. Europe
- 3.1. United Kingdom
- 3.2. Germany
- 3.3. France
- 3.4. Italy
- 3.5. Spain
- 3.6. Russia
- 3.7. Benelux
- 3.8. Nordics
- 3.9. Rest of Europe
-
4. Middle East & Africa
- 4.1. Turkey
- 4.2. Israel
- 4.3. GCC
- 4.4. North Africa
- 4.5. South Africa
- 4.6. Rest of Middle East & Africa
-
5. Asia Pacific
- 5.1. China
- 5.2. India
- 5.3. Japan
- 5.4. South Korea
- 5.5. ASEAN
- 5.6. Oceania
- 5.7. Rest of Asia Pacific
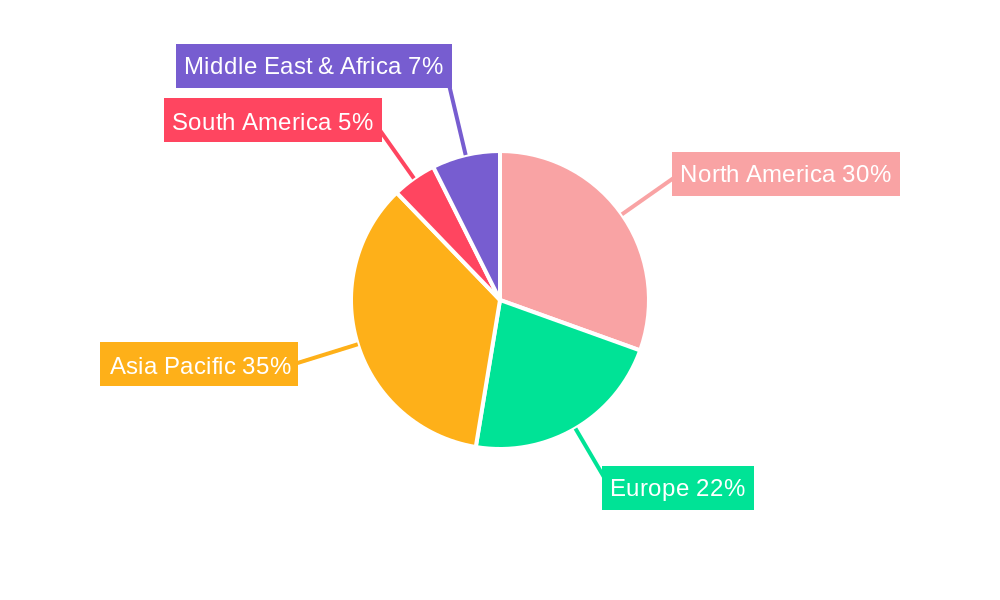
Electronic Design Automation Software Regional Market Share
Geographic Coverage of Electronic Design Automation Software
Electronic Design Automation Software REPORT HIGHLIGHTS
| Aspects | Details |
|---|---|
| Study Period | 2020-2034 |
| Base Year | 2025 |
| Estimated Year | 2026 |
| Forecast Period | 2026-2034 |
| Historical Period | 2020-2025 |
| Growth Rate | CAGR of 8.4% from 2020-2034 |
| Segmentation |
|
Table of Contents
- 1. Introduction
- 1.1. Research Scope
- 1.2. Market Segmentation
- 1.3. Research Methodology
- 1.4. Definitions and Assumptions
- 2. Executive Summary
- 2.1. Introduction
- 3. Market Dynamics
- 3.1. Introduction
- 3.2. Market Drivers
- 3.3. Market Restrains
- 3.4. Market Trends
- 4. Market Factor Analysis
- 4.1. Porters Five Forces
- 4.2. Supply/Value Chain
- 4.3. PESTEL analysis
- 4.4. Market Entropy
- 4.5. Patent/Trademark Analysis
- 5. Global Electronic Design Automation Software Analysis, Insights and Forecast, 2020-2032
- 5.1. Market Analysis, Insights and Forecast - by Application
- 5.1.1. Automotive
- 5.1.2. Aerospace & Defense
- 5.1.3. Consumer Electronics
- 5.1.4. Healthcare
- 5.1.5. Industrial
- 5.1.6. Other
- 5.2. Market Analysis, Insights and Forecast - by Types
- 5.2.1. Cloud-based
- 5.2.2. On-premise
- 5.3. Market Analysis, Insights and Forecast - by Region
- 5.3.1. North America
- 5.3.2. South America
- 5.3.3. Europe
- 5.3.4. Middle East & Africa
- 5.3.5. Asia Pacific
- 5.1. Market Analysis, Insights and Forecast - by Application
- 6. North America Electronic Design Automation Software Analysis, Insights and Forecast, 2020-2032
- 6.1. Market Analysis, Insights and Forecast - by Application
- 6.1.1. Automotive
- 6.1.2. Aerospace & Defense
- 6.1.3. Consumer Electronics
- 6.1.4. Healthcare
- 6.1.5. Industrial
- 6.1.6. Other
- 6.2. Market Analysis, Insights and Forecast - by Types
- 6.2.1. Cloud-based
- 6.2.2. On-premise
- 6.1. Market Analysis, Insights and Forecast - by Application
- 7. South America Electronic Design Automation Software Analysis, Insights and Forecast, 2020-2032
- 7.1. Market Analysis, Insights and Forecast - by Application
- 7.1.1. Automotive
- 7.1.2. Aerospace & Defense
- 7.1.3. Consumer Electronics
- 7.1.4. Healthcare
- 7.1.5. Industrial
- 7.1.6. Other
- 7.2. Market Analysis, Insights and Forecast - by Types
- 7.2.1. Cloud-based
- 7.2.2. On-premise
- 7.1. Market Analysis, Insights and Forecast - by Application
- 8. Europe Electronic Design Automation Software Analysis, Insights and Forecast, 2020-2032
- 8.1. Market Analysis, Insights and Forecast - by Application
- 8.1.1. Automotive
- 8.1.2. Aerospace & Defense
- 8.1.3. Consumer Electronics
- 8.1.4. Healthcare
- 8.1.5. Industrial
- 8.1.6. Other
- 8.2. Market Analysis, Insights and Forecast - by Types
- 8.2.1. Cloud-based
- 8.2.2. On-premise
- 8.1. Market Analysis, Insights and Forecast - by Application
- 9. Middle East & Africa Electronic Design Automation Software Analysis, Insights and Forecast, 2020-2032
- 9.1. Market Analysis, Insights and Forecast - by Application
- 9.1.1. Automotive
- 9.1.2. Aerospace & Defense
- 9.1.3. Consumer Electronics
- 9.1.4. Healthcare
- 9.1.5. Industrial
- 9.1.6. Other
- 9.2. Market Analysis, Insights and Forecast - by Types
- 9.2.1. Cloud-based
- 9.2.2. On-premise
- 9.1. Market Analysis, Insights and Forecast - by Application
- 10. Asia Pacific Electronic Design Automation Software Analysis, Insights and Forecast, 2020-2032
- 10.1. Market Analysis, Insights and Forecast - by Application
- 10.1.1. Automotive
- 10.1.2. Aerospace & Defense
- 10.1.3. Consumer Electronics
- 10.1.4. Healthcare
- 10.1.5. Industrial
- 10.1.6. Other
- 10.2. Market Analysis, Insights and Forecast - by Types
- 10.2.1. Cloud-based
- 10.2.2. On-premise
- 10.1. Market Analysis, Insights and Forecast - by Application
- 11. Competitive Analysis
- 11.1. Global Market Share Analysis 2025
- 11.2. Company Profiles
- 11.2.1 ANSYS
- 11.2.1.1. Overview
- 11.2.1.2. Products
- 11.2.1.3. SWOT Analysis
- 11.2.1.4. Recent Developments
- 11.2.1.5. Financials (Based on Availability)
- 11.2.2 Altium
- 11.2.2.1. Overview
- 11.2.2.2. Products
- 11.2.2.3. SWOT Analysis
- 11.2.2.4. Recent Developments
- 11.2.2.5. Financials (Based on Availability)
- 11.2.3 Autodesk
- 11.2.3.1. Overview
- 11.2.3.2. Products
- 11.2.3.3. SWOT Analysis
- 11.2.3.4. Recent Developments
- 11.2.3.5. Financials (Based on Availability)
- 11.2.4 Cadence Design Systems
- 11.2.4.1. Overview
- 11.2.4.2. Products
- 11.2.4.3. SWOT Analysis
- 11.2.4.4. Recent Developments
- 11.2.4.5. Financials (Based on Availability)
- 11.2.5 Mentor
- 11.2.5.1. Overview
- 11.2.5.2. Products
- 11.2.5.3. SWOT Analysis
- 11.2.5.4. Recent Developments
- 11.2.5.5. Financials (Based on Availability)
- 11.2.6 NVIDIA
- 11.2.6.1. Overview
- 11.2.6.2. Products
- 11.2.6.3. SWOT Analysis
- 11.2.6.4. Recent Developments
- 11.2.6.5. Financials (Based on Availability)
- 11.2.7 Silvaco
- 11.2.7.1. Overview
- 11.2.7.2. Products
- 11.2.7.3. SWOT Analysis
- 11.2.7.4. Recent Developments
- 11.2.7.5. Financials (Based on Availability)
- 11.2.8 Synopsis
- 11.2.8.1. Overview
- 11.2.8.2. Products
- 11.2.8.3. SWOT Analysis
- 11.2.8.4. Recent Developments
- 11.2.8.5. Financials (Based on Availability)
- 11.2.9 Xilinx
- 11.2.9.1. Overview
- 11.2.9.2. Products
- 11.2.9.3. SWOT Analysis
- 11.2.9.4. Recent Developments
- 11.2.9.5. Financials (Based on Availability)
- 11.2.10 Keysight Technologies
- 11.2.10.1. Overview
- 11.2.10.2. Products
- 11.2.10.3. SWOT Analysis
- 11.2.10.4. Recent Developments
- 11.2.10.5. Financials (Based on Availability)
- 11.2.11 Agnisys
- 11.2.11.1. Overview
- 11.2.11.2. Products
- 11.2.11.3. SWOT Analysis
- 11.2.11.4. Recent Developments
- 11.2.11.5. Financials (Based on Availability)
- 11.2.12 Aldec
- 11.2.12.1. Overview
- 11.2.12.2. Products
- 11.2.12.3. SWOT Analysis
- 11.2.12.4. Recent Developments
- 11.2.12.5. Financials (Based on Availability)
- 11.2.13 Lauterbach
- 11.2.13.1. Overview
- 11.2.13.2. Products
- 11.2.13.3. SWOT Analysis
- 11.2.13.4. Recent Developments
- 11.2.13.5. Financials (Based on Availability)
- 11.2.14 Zuken
- 11.2.14.1. Overview
- 11.2.14.2. Products
- 11.2.14.3. SWOT Analysis
- 11.2.14.4. Recent Developments
- 11.2.14.5. Financials (Based on Availability)
- 11.2.1 ANSYS
List of Figures
- Figure 1: Global Electronic Design Automation Software Revenue Breakdown (undefined, %) by Region 2025 & 2033
- Figure 2: North America Electronic Design Automation Software Revenue (undefined), by Application 2025 & 2033
- Figure 3: North America Electronic Design Automation Software Revenue Share (%), by Application 2025 & 2033
- Figure 4: North America Electronic Design Automation Software Revenue (undefined), by Types 2025 & 2033
- Figure 5: North America Electronic Design Automation Software Revenue Share (%), by Types 2025 & 2033
- Figure 6: North America Electronic Design Automation Software Revenue (undefined), by Country 2025 & 2033
- Figure 7: North America Electronic Design Automation Software Revenue Share (%), by Country 2025 & 2033
- Figure 8: South America Electronic Design Automation Software Revenue (undefined), by Application 2025 & 2033
- Figure 9: South America Electronic Design Automation Software Revenue Share (%), by Application 2025 & 2033
- Figure 10: South America Electronic Design Automation Software Revenue (undefined), by Types 2025 & 2033
- Figure 11: South America Electronic Design Automation Software Revenue Share (%), by Types 2025 & 2033
- Figure 12: South America Electronic Design Automation Software Revenue (undefined), by Country 2025 & 2033
- Figure 13: South America Electronic Design Automation Software Revenue Share (%), by Country 2025 & 2033
- Figure 14: Europe Electronic Design Automation Software Revenue (undefined), by Application 2025 & 2033
- Figure 15: Europe Electronic Design Automation Software Revenue Share (%), by Application 2025 & 2033
- Figure 16: Europe Electronic Design Automation Software Revenue (undefined), by Types 2025 & 2033
- Figure 17: Europe Electronic Design Automation Software Revenue Share (%), by Types 2025 & 2033
- Figure 18: Europe Electronic Design Automation Software Revenue (undefined), by Country 2025 & 2033
- Figure 19: Europe Electronic Design Automation Software Revenue Share (%), by Country 2025 & 2033
- Figure 20: Middle East & Africa Electronic Design Automation Software Revenue (undefined), by Application 2025 & 2033
- Figure 21: Middle East & Africa Electronic Design Automation Software Revenue Share (%), by Application 2025 & 2033
- Figure 22: Middle East & Africa Electronic Design Automation Software Revenue (undefined), by Types 2025 & 2033
- Figure 23: Middle East & Africa Electronic Design Automation Software Revenue Share (%), by Types 2025 & 2033
- Figure 24: Middle East & Africa Electronic Design Automation Software Revenue (undefined), by Country 2025 & 2033
- Figure 25: Middle East & Africa Electronic Design Automation Software Revenue Share (%), by Country 2025 & 2033
- Figure 26: Asia Pacific Electronic Design Automation Software Revenue (undefined), by Application 2025 & 2033
- Figure 27: Asia Pacific Electronic Design Automation Software Revenue Share (%), by Application 2025 & 2033
- Figure 28: Asia Pacific Electronic Design Automation Software Revenue (undefined), by Types 2025 & 2033
- Figure 29: Asia Pacific Electronic Design Automation Software Revenue Share (%), by Types 2025 & 2033
- Figure 30: Asia Pacific Electronic Design Automation Software Revenue (undefined), by Country 2025 & 2033
- Figure 31: Asia Pacific Electronic Design Automation Software Revenue Share (%), by Country 2025 & 2033
List of Tables
- Table 1: Global Electronic Design Automation Software Revenue undefined Forecast, by Application 2020 & 2033
- Table 2: Global Electronic Design Automation Software Revenue undefined Forecast, by Types 2020 & 2033
- Table 3: Global Electronic Design Automation Software Revenue undefined Forecast, by Region 2020 & 2033
- Table 4: Global Electronic Design Automation Software Revenue undefined Forecast, by Application 2020 & 2033
- Table 5: Global Electronic Design Automation Software Revenue undefined Forecast, by Types 2020 & 2033
- Table 6: Global Electronic Design Automation Software Revenue undefined Forecast, by Country 2020 & 2033
- Table 7: United States Electronic Design Automation Software Revenue (undefined) Forecast, by Application 2020 & 2033
- Table 8: Canada Electronic Design Automation Software Revenue (undefined) Forecast, by Application 2020 & 2033
- Table 9: Mexico Electronic Design Automation Software Revenue (undefined) Forecast, by Application 2020 & 2033
- Table 10: Global Electronic Design Automation Software Revenue undefined Forecast, by Application 2020 & 2033
- Table 11: Global Electronic Design Automation Software Revenue undefined Forecast, by Types 2020 & 2033
- Table 12: Global Electronic Design Automation Software Revenue undefined Forecast, by Country 2020 & 2033
- Table 13: Brazil Electronic Design Automation Software Revenue (undefined) Forecast, by Application 2020 & 2033
- Table 14: Argentina Electronic Design Automation Software Revenue (undefined) Forecast, by Application 2020 & 2033
- Table 15: Rest of South America Electronic Design Automation Software Revenue (undefined) Forecast, by Application 2020 & 2033
- Table 16: Global Electronic Design Automation Software Revenue undefined Forecast, by Application 2020 & 2033
- Table 17: Global Electronic Design Automation Software Revenue undefined Forecast, by Types 2020 & 2033
- Table 18: Global Electronic Design Automation Software Revenue undefined Forecast, by Country 2020 & 2033
- Table 19: United Kingdom Electronic Design Automation Software Revenue (undefined) Forecast, by Application 2020 & 2033
- Table 20: Germany Electronic Design Automation Software Revenue (undefined) Forecast, by Application 2020 & 2033
- Table 21: France Electronic Design Automation Software Revenue (undefined) Forecast, by Application 2020 & 2033
- Table 22: Italy Electronic Design Automation Software Revenue (undefined) Forecast, by Application 2020 & 2033
- Table 23: Spain Electronic Design Automation Software Revenue (undefined) Forecast, by Application 2020 & 2033
- Table 24: Russia Electronic Design Automation Software Revenue (undefined) Forecast, by Application 2020 & 2033
- Table 25: Benelux Electronic Design Automation Software Revenue (undefined) Forecast, by Application 2020 & 2033
- Table 26: Nordics Electronic Design Automation Software Revenue (undefined) Forecast, by Application 2020 & 2033
- Table 27: Rest of Europe Electronic Design Automation Software Revenue (undefined) Forecast, by Application 2020 & 2033
- Table 28: Global Electronic Design Automation Software Revenue undefined Forecast, by Application 2020 & 2033
- Table 29: Global Electronic Design Automation Software Revenue undefined Forecast, by Types 2020 & 2033
- Table 30: Global Electronic Design Automation Software Revenue undefined Forecast, by Country 2020 & 2033
- Table 31: Turkey Electronic Design Automation Software Revenue (undefined) Forecast, by Application 2020 & 2033
- Table 32: Israel Electronic Design Automation Software Revenue (undefined) Forecast, by Application 2020 & 2033
- Table 33: GCC Electronic Design Automation Software Revenue (undefined) Forecast, by Application 2020 & 2033
- Table 34: North Africa Electronic Design Automation Software Revenue (undefined) Forecast, by Application 2020 & 2033
- Table 35: South Africa Electronic Design Automation Software Revenue (undefined) Forecast, by Application 2020 & 2033
- Table 36: Rest of Middle East & Africa Electronic Design Automation Software Revenue (undefined) Forecast, by Application 2020 & 2033
- Table 37: Global Electronic Design Automation Software Revenue undefined Forecast, by Application 2020 & 2033
- Table 38: Global Electronic Design Automation Software Revenue undefined Forecast, by Types 2020 & 2033
- Table 39: Global Electronic Design Automation Software Revenue undefined Forecast, by Country 2020 & 2033
- Table 40: China Electronic Design Automation Software Revenue (undefined) Forecast, by Application 2020 & 2033
- Table 41: India Electronic Design Automation Software Revenue (undefined) Forecast, by Application 2020 & 2033
- Table 42: Japan Electronic Design Automation Software Revenue (undefined) Forecast, by Application 2020 & 2033
- Table 43: South Korea Electronic Design Automation Software Revenue (undefined) Forecast, by Application 2020 & 2033
- Table 44: ASEAN Electronic Design Automation Software Revenue (undefined) Forecast, by Application 2020 & 2033
- Table 45: Oceania Electronic Design Automation Software Revenue (undefined) Forecast, by Application 2020 & 2033
- Table 46: Rest of Asia Pacific Electronic Design Automation Software Revenue (undefined) Forecast, by Application 2020 & 2033
Frequently Asked Questions
1. What is the projected Compound Annual Growth Rate (CAGR) of the Electronic Design Automation Software?
The projected CAGR is approximately 8.4%.
2. Which companies are prominent players in the Electronic Design Automation Software?
Key companies in the market include ANSYS, Altium, Autodesk, Cadence Design Systems, Mentor, NVIDIA, Silvaco, Synopsis, Xilinx, Keysight Technologies, Agnisys, Aldec, Lauterbach, Zuken.
3. What are the main segments of the Electronic Design Automation Software?
The market segments include Application, Types.
4. Can you provide details about the market size?
The market size is estimated to be USD XXX N/A as of 2022.
5. What are some drivers contributing to market growth?
N/A
6. What are the notable trends driving market growth?
N/A
7. Are there any restraints impacting market growth?
N/A
8. Can you provide examples of recent developments in the market?
N/A
9. What pricing options are available for accessing the report?
Pricing options include single-user, multi-user, and enterprise licenses priced at USD 3950.00, USD 5925.00, and USD 7900.00 respectively.
10. Is the market size provided in terms of value or volume?
The market size is provided in terms of value, measured in N/A.
11. Are there any specific market keywords associated with the report?
Yes, the market keyword associated with the report is "Electronic Design Automation Software," which aids in identifying and referencing the specific market segment covered.
12. How do I determine which pricing option suits my needs best?
The pricing options vary based on user requirements and access needs. Individual users may opt for single-user licenses, while businesses requiring broader access may choose multi-user or enterprise licenses for cost-effective access to the report.
13. Are there any additional resources or data provided in the Electronic Design Automation Software report?
While the report offers comprehensive insights, it's advisable to review the specific contents or supplementary materials provided to ascertain if additional resources or data are available.
14. How can I stay updated on further developments or reports in the Electronic Design Automation Software?
To stay informed about further developments, trends, and reports in the Electronic Design Automation Software, consider subscribing to industry newsletters, following relevant companies and organizations, or regularly checking reputable industry news sources and publications.
Methodology
Step 1 - Identification of Relevant Samples Size from Population Database


Step 2 - Approaches for Defining Global Market Size (Value, Volume* & Price*)

Note*: In applicable scenarios
Step 3 - Data Sources
Primary Research
- Web Analytics
- Survey Reports
- Research Institute
- Latest Research Reports
- Opinion Leaders
Secondary Research
- Annual Reports
- White Paper
- Latest Press Release
- Industry Association
- Paid Database
- Investor Presentations

Step 4 - Data Triangulation
Involves using different sources of information in order to increase the validity of a study
These sources are likely to be stakeholders in a program - participants, other researchers, program staff, other community members, and so on.
Then we put all data in single framework & apply various statistical tools to find out the dynamic on the market.
During the analysis stage, feedback from the stakeholder groups would be compared to determine areas of agreement as well as areas of divergence