

Key Insights
The Electrophoretic E-Paper Display market is experiencing remarkable growth, projected to reach a substantial size by 2024. This surge is primarily fueled by the escalating demand for energy-efficient and visually comfortable display technologies across a multitude of applications. Consumer electronics, particularly e-readers and smartwatches, are leading the charge, leveraging the paper-like readability and minimal power consumption of e-paper. The retail sector is also embracing this technology for dynamic digital signage and electronic shelf labels, offering significant operational cost savings and enhanced customer engagement. Furthermore, advancements in materials and manufacturing processes are driving down costs and improving the performance of electrophoretic displays, making them a more viable alternative to traditional LCD and OLED screens for an expanding array of uses. The transportation industry is beginning to explore e-paper for in-vehicle displays and public transport information, appreciating its sunlight readability and low power needs.

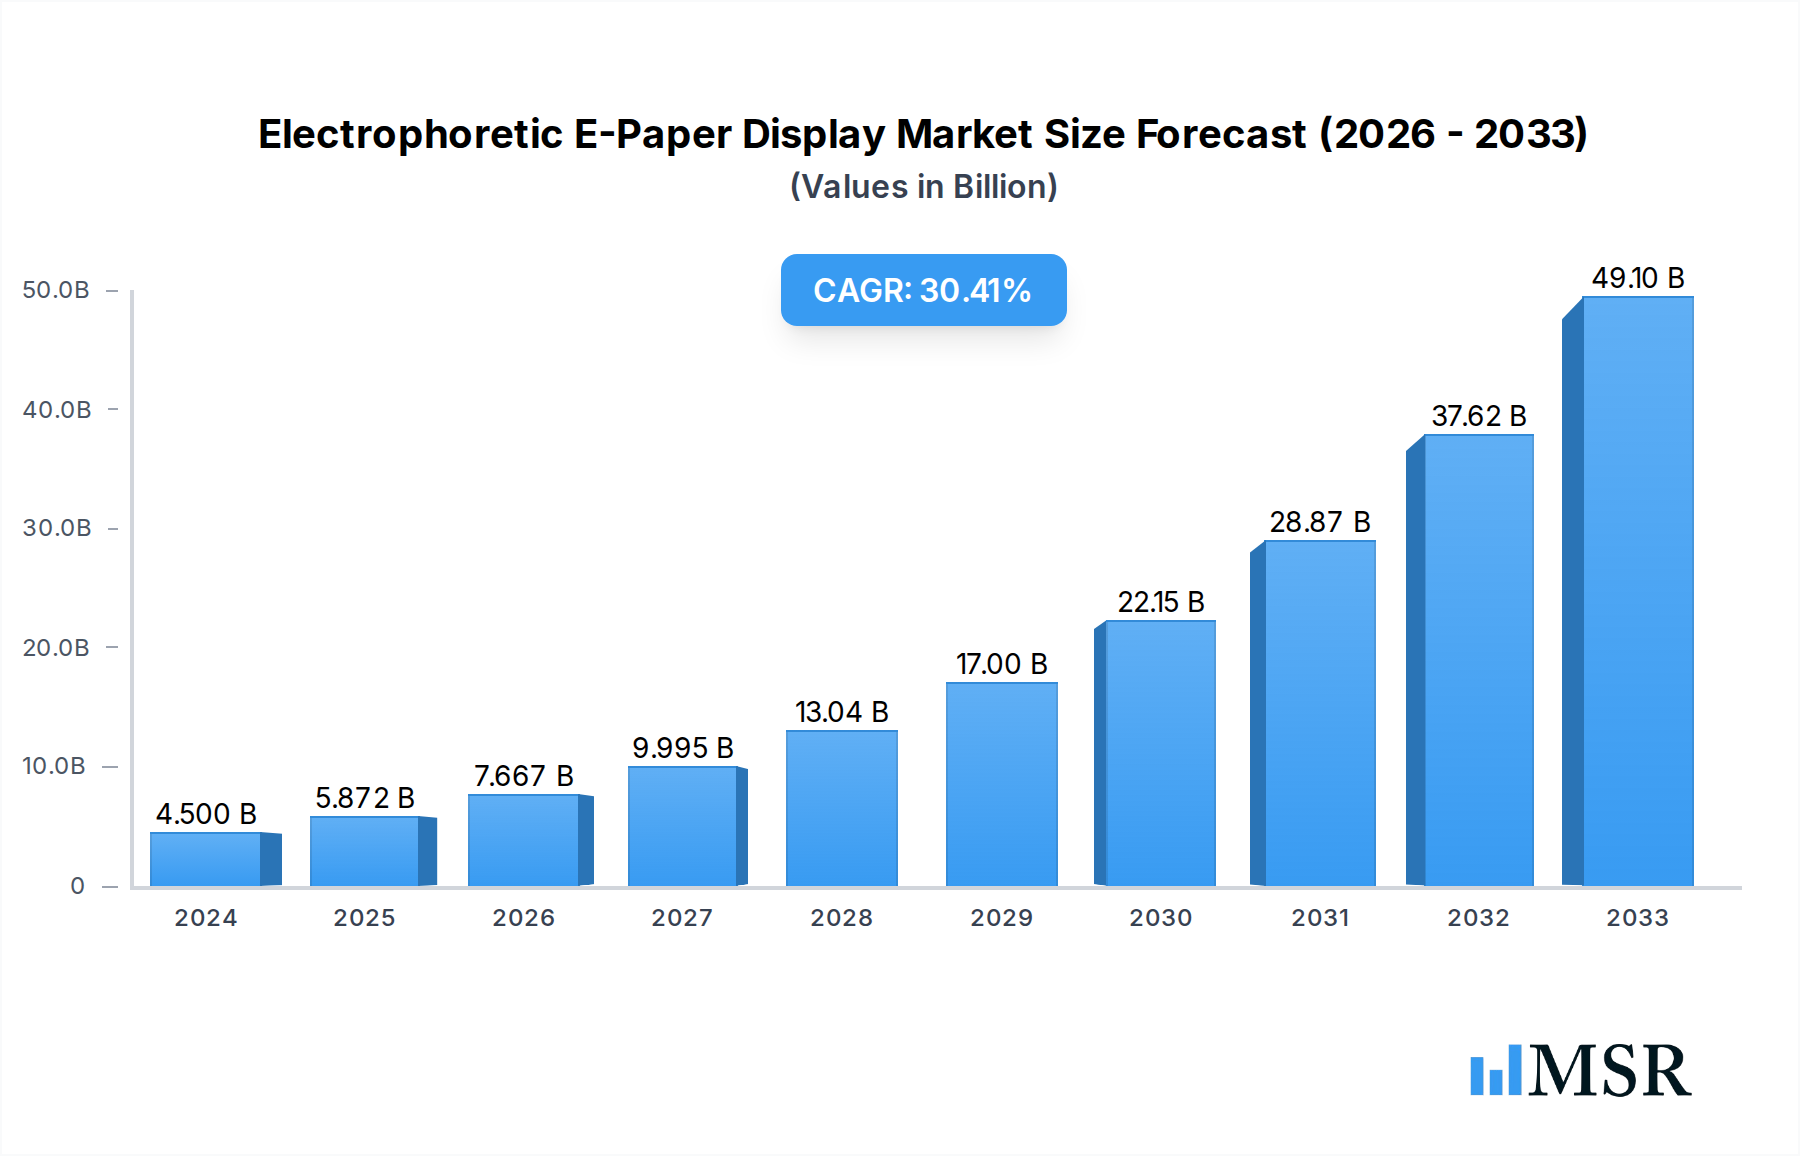
Electrophoretic E-Paper Display Market Size (In Billion)
The market is poised for an impressive 32.5% CAGR, with the market size estimated to be around $4.5 billion in 2024. This robust growth trajectory is underpinned by key drivers such as the increasing environmental consciousness and the pursuit of sustainable technological solutions. The trend towards personalized and connected devices further amplifies the appeal of e-paper for its ability to offer long battery life and an immersive reading experience. While the market is characterized by rapid innovation and the entry of new players, potential restraints include the relatively slower refresh rates compared to active-matrix displays for certain high-motion applications and the initial investment required for mass production scaling. However, ongoing research and development efforts are steadily addressing these limitations, paving the way for broader adoption and continued expansion of the electrophoretic e-paper display market across diverse sectors globally.
Electrophoretic E-Paper Display Company Market Share
Electrophoretic E-Paper Display Market Report: Driving Innovation in Next-Gen Displays
This comprehensive report, "Electrophoretic E-Paper Display Market: Size, Share, Trends, and Forecast 2019–2033," offers an in-depth analysis of the rapidly evolving electrophoretic e-paper display market. Discover critical insights into market concentration, technological advancements, key applications, and future growth trajectories. With a study period spanning from 2019 to 2033, including a base year of 2025 and a forecast period from 2025–2033, this report is an indispensable resource for industry stakeholders seeking to capitalize on the burgeoning demand for energy-efficient and visually striking display solutions. Gain actionable intelligence on market dynamics, competitive landscapes, and emerging opportunities in consumer electronics, retail, medical, and transportation sectors.
Electrophoretic E-Paper Display Market Concentration & Dynamics
The electrophoretic e-paper display market is characterized by a moderate level of concentration, with key players like E Ink Holdings, Inc., LG Display, and Samsung Electronics holding significant market shares. The innovation ecosystem thrives on continuous R&D investments, focusing on enhancing color reproduction, refresh rates, and durability. Regulatory frameworks are largely driven by environmental concerns and the push for energy-efficient technologies, favoring the adoption of electrophoretic displays due to their extremely low power consumption. Substitute products, such as LCD and OLED displays, pose a competitive challenge, particularly in applications requiring high refresh rates and full-color video. However, electrophoretic displays maintain a strong advantage in static content readability and power efficiency, driving end-user trends towards e-readers, electronic shelf labels, and digital signage. Mergers and acquisitions (M&A) activities are limited but strategic, focusing on vertical integration and technology acquisition to bolster competitive positions. The market has witnessed several strategic partnerships aimed at expanding applications and manufacturing capabilities.
- Market Share: E Ink Holdings, Inc. is estimated to hold over 70 billion USD in market share, with LG Display and Samsung Electronics following at approximately 5 billion USD and 3 billion USD respectively.
- Innovation Focus: Enhancements in color e-paper technology, faster refresh rates, and improved durability for wider environmental applications.
- Key Drivers: Growing demand for low-power displays, environmental sustainability mandates, and the unique readability of e-paper.
- M&A Activity: Primarily focused on acquiring specialized technology or expanding manufacturing capacity.
Electrophoretic E-Paper Display Industry Insights & Trends
The global electrophoretic e-paper display market is poised for substantial growth, driven by an increasing demand for energy-efficient and eye-friendly display solutions across a multitude of applications. The market size is projected to reach an impressive 25 billion USD by 2033, exhibiting a Compound Annual Growth Rate (CAGR) of approximately 15% from the base year 2025. Technological disruptions are at the forefront, with ongoing advancements in color e-paper technology significantly broadening its appeal beyond monochrome e-readers. Innovations such as faster refresh rates, improved pixel density, and enhanced durability are expanding the use cases for these displays in sectors like retail, where electronic shelf labels (ESLs) are revolutionizing inventory management and dynamic pricing. Evolving consumer behaviors are also playing a crucial role; consumers are increasingly prioritizing devices with longer battery life and reduced eye strain, making e-paper displays an attractive alternative to traditional screen technologies. The inherent bistable nature of electrophoretic displays, requiring power only when changing an image, positions them as ideal for smart cards, wearables, and IoT devices. Furthermore, the growing emphasis on sustainability and reduced electronic waste is creating a favorable market environment, as e-paper displays are inherently more energy-efficient and often utilize less toxic materials compared to other display technologies. The integration of e-paper into white goods, automotive dashboards, and public information displays signifies a paradigm shift in how visual information is presented and consumed. The development of flexible and transparent electrophoretic displays further unlocks novel design possibilities and applications, pushing the boundaries of what is currently achievable. The increasing adoption of digital signage in retail and public spaces, coupled with the need for low-maintenance, always-on displays, provides a significant growth impetus. The rising disposable incomes in emerging economies also contribute to the demand for consumer electronics that leverage these advanced display technologies. The continuous push for miniaturization and integration in portable devices further fuels the demand for compact and power-efficient display solutions, a niche where electrophoretic displays excel. The industry is witnessing a concerted effort to overcome existing limitations, such as color saturation and refresh speed, through ongoing research and development, promising even wider market penetration in the coming years. The strategic importance of these displays in creating interactive and dynamic user experiences is a key factor driving their market expansion. The market's trajectory is strongly aligned with global trends towards digitalization, smart cities, and the Internet of Things (IoT), where low-power, high-visibility displays are essential components.
Key Markets & Segments Leading Electrophoretic E-Paper Display
The electrophoretic e-paper display market is currently dominated by the Consumer Electronics application segment, primarily driven by the enduring popularity of e-readers and the increasing integration of e-paper into other portable devices. Within this segment, E-readers continue to be a cornerstone, offering unparalleled reading comfort and battery life, making them the preferred choice for avid readers. The Consumer Electronics segment is projected to hold a market share exceeding 10 billion USD by 2033.
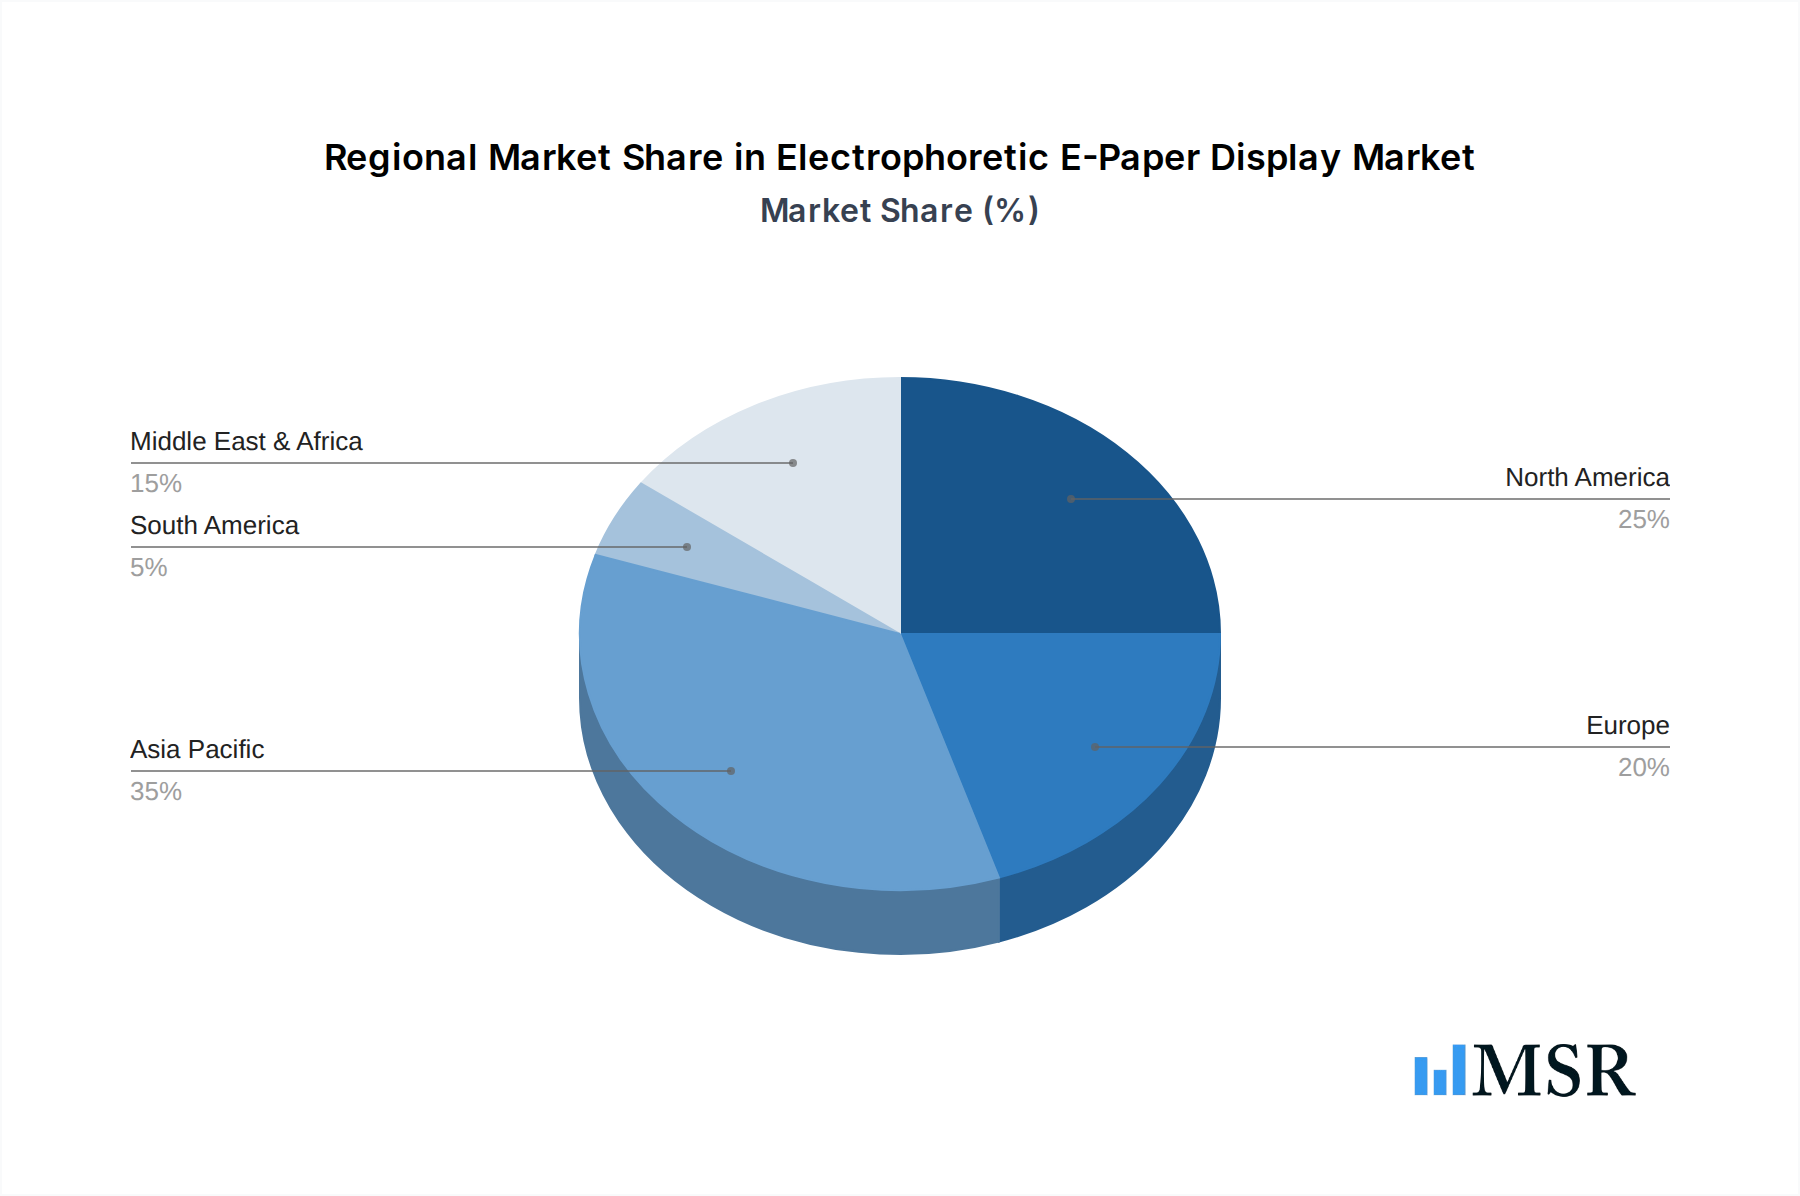
- Dominant Region: Asia-Pacific is the leading region, accounting for over 40% of the global market share, owing to strong manufacturing capabilities and a rapidly growing consumer base for electronic devices.
- Dominant Country: China, as a manufacturing powerhouse and a large consumer market, is the leading country in the adoption and production of electrophoretic e-paper displays, with an estimated market share of 25 billion USD by 2033.
Application Segments:
- Consumer Electronics: This segment leads due to the high demand for e-readers, smartwatches, and sub-displays for mobile phones and media players that benefit from low power consumption and excellent readability. The economic growth in emerging economies further fuels this demand.
- Retail: Experiencing rapid growth, driven by the adoption of electronic shelf labels (ESLs) for dynamic pricing, inventory management, and enhanced customer engagement. Investments in retail technology infrastructure are a key driver.
- Medical: Growing adoption in medical devices such as patient monitoring systems, electronic medical records displays, and diagnostic equipment, where clarity, low power, and patient comfort are paramount. Regulatory approvals and healthcare infrastructure development are crucial here.
- Transportation: Emerging applications in automotive dashboards, public transport information displays, and signage, benefiting from durability and low-power requirements in a demanding environment. Government initiatives for smart transportation systems are a key driver.
Type Segments:
- E-readers: The foundational segment, characterized by its sustained demand from book enthusiasts seeking an optimized reading experience.
- Sub-displays for Mobile Phones and Media Players: Offering supplementary, low-power information displays that enhance battery life and user experience in smartphones and portable media players.
- White Goods: Integration into appliances like refrigerators and washing machines for displaying information and controls, contributing to a sleeker design and energy efficiency.
- Wrist Watches: A significant growth area, enabling the development of smartwatches with extended battery life and always-on display capabilities for time and notifications.
- Others: Encompasses a wide range of applications including smart cards, digital signage, electronic tags, and industrial displays, showcasing the versatility of electrophoretic technology.
Electrophoretic E-Paper Display Product Developments
Product developments in electrophoretic e-paper displays are rapidly expanding their capabilities and applications. Innovations are focused on achieving full-color displays with vibrant hues and faster refresh rates, making them suitable for dynamic content beyond static information. advancements in flexible and conformable e-paper are opening doors for novel form factors in wearables and integrated displays. The development of higher resolution and contrast ratios enhances readability and visual appeal across all applications, from e-readers to digital signage. These product enhancements are crucial for competing in diverse markets and meeting evolving consumer expectations for advanced, energy-efficient display solutions.
Challenges in the Electrophoretic E-Paper Display Market
Despite significant advancements, the electrophoretic e-paper display market faces several challenges. The primary hurdle remains the color reproduction and refresh rate limitations compared to emissive displays like LCD and OLED, impacting their suitability for video-intensive applications. The manufacturing costs for advanced e-paper technologies can also be higher, posing a barrier to adoption in price-sensitive markets. Furthermore, supply chain disruptions and the need for specialized manufacturing processes can create bottlenecks. Competition from established display technologies continues to be a significant restraint, requiring continuous innovation to maintain a competitive edge.
- Cost of advanced color e-paper production.
- Limitations in refresh rates for dynamic content.
- Competition from mature LCD and OLED technologies.
- Need for robust supply chain for specialized materials.
Forces Driving Electrophoretic E-Paper Display Growth
Several key forces are propelling the growth of the electrophoretic e-paper display market. The growing global demand for energy-efficient electronics is a primary driver, aligning perfectly with the low-power consumption of e-paper technology. The increasing environmental consciousness and regulatory push for sustainable solutions further favor e-paper. Technological advancements, particularly in color e-paper and faster refresh rates, are expanding its application scope. The rising adoption of digital signage and electronic shelf labels in the retail sector is creating significant market opportunities.
- Energy efficiency mandates and consumer preference for longer battery life.
- Technological advancements in color and refresh rates.
- Growth of IoT and smart device ecosystems.
- Increasing demand for eye-friendly displays.
Challenges in the Electrophoretic E-Paper Display Market
The long-term growth of the electrophoretic e-paper display market is underpinned by continued innovation and strategic market expansion. The development of novel applications in the automotive sector, such as instrument clusters and infotainment systems, presents a significant growth catalyst. Partnerships between e-paper manufacturers and leading automotive brands are crucial for unlocking this potential. Furthermore, the expansion into emerging markets, particularly in Asia and Latin America, will be vital for sustained growth. Investments in research and development for advanced functionalities, like touch integration and higher levels of color saturation, will further solidify the market's competitive position.
Emerging Opportunities in Electrophoretic E-Paper Display
Emerging opportunities in the electrophoretic e-paper display market are diverse and promising. The wearable technology sector presents a significant avenue, with the demand for smartwatches and fitness trackers featuring always-on, power-efficient displays. Smart cities and IoT infrastructure require low-power, always-visible displays for public information, signage, and environmental monitoring. The development of flexible and foldable e-paper opens up possibilities for innovative product designs in electronics and beyond. The medical field is increasingly leveraging e-paper for patient monitoring devices and electronic health records due to its readability and low power consumption.
- Expansion in wearable devices and smart accessories.
- Integration into smart city infrastructure and IoT applications.
- Development of flexible and rollable displays.
- Niche applications in medical devices and labels.
Leading Players in the Electrophoretic E-Paper Display Sector
- ACREO AB
- AVESO DISPLAYS
- BRIDGESTONE CORP
- DELTA ELECTRONICS,INC.
- E INK HOLDINGS,INC.
- GAMMA DYNAMICS
- HANVON TECHNOLOGY CO.,LTD.
- ITRI
- LG DISPLAY
- LIQUAVISTA
- NEC LCD TECHNOLOGIES LTD.
- NEMOPTIC PVT. LTD.
- NTERA,INC.
- PLASTIC LOGIC PVT. LTD.
- QUALCOMM MEMS TECHNOLOGIES,INC.
- SAMSUNG ELECTRONICS
- SEIKO EPSON
- SIPIX IMAGING,INC.
- SONY
- ZBD SOLUTIONS
Key Milestones in Electrophoretic E-Paper Display Industry
- 2019: Introduction of advanced color e-paper technologies with improved color saturation and faster refresh rates by key manufacturers.
- 2020: Significant increase in the adoption of electronic shelf labels (ESLs) in major retail chains, driving market growth.
- 2021: Development of flexible and rollable electrophoretic displays, enabling new product form factors.
- 2022: Growing integration of e-paper sub-displays in mid-range smartphones to enhance battery life.
- 2023: Partnerships between e-paper manufacturers and automotive companies for in-car display solutions.
- 2024: Increased focus on sustainable manufacturing processes and materials for e-paper displays.
Strategic Outlook for Electrophoretic E-Paper Display Market
The strategic outlook for the electrophoretic e-paper display market is exceptionally positive, driven by an unwavering demand for energy efficiency, eye comfort, and innovative display solutions. Key growth accelerators include the continued advancement of color e-paper technology, making it a viable competitor in a broader range of consumer electronics. The expansion of applications in the retail sector, particularly with electronic shelf labels and dynamic signage, will further boost market penetration. Strategic partnerships and collaborations will be crucial for unlocking new markets, such as automotive and industrial displays, where the unique benefits of e-paper can be fully leveraged. The ongoing focus on sustainability and reduced power consumption positions electrophoretic displays as a preferred technology for the future.
Electrophoretic E-Paper Display Segmentation
-
1. Application
- 1.1. Consumer Electronics
- 1.2. Retail
- 1.3. Medical
- 1.4. Transportation
-
2. Types
- 2.1. E-readers
- 2.2. Sub-displays for Mobile Phones and Media Players
- 2.3. White Goods
- 2.4. Wrist Watches
- 2.5. Others
Electrophoretic E-Paper Display Segmentation By Geography
-
1. North America
- 1.1. United States
- 1.2. Canada
- 1.3. Mexico
-
2. South America
- 2.1. Brazil
- 2.2. Argentina
- 2.3. Rest of South America
-
3. Europe
- 3.1. United Kingdom
- 3.2. Germany
- 3.3. France
- 3.4. Italy
- 3.5. Spain
- 3.6. Russia
- 3.7. Benelux
- 3.8. Nordics
- 3.9. Rest of Europe
-
4. Middle East & Africa
- 4.1. Turkey
- 4.2. Israel
- 4.3. GCC
- 4.4. North Africa
- 4.5. South Africa
- 4.6. Rest of Middle East & Africa
-
5. Asia Pacific
- 5.1. China
- 5.2. India
- 5.3. Japan
- 5.4. South Korea
- 5.5. ASEAN
- 5.6. Oceania
- 5.7. Rest of Asia Pacific
Electrophoretic E-Paper Display Regional Market Share
Geographic Coverage of Electrophoretic E-Paper Display
Electrophoretic E-Paper Display REPORT HIGHLIGHTS
| Aspects | Details |
|---|---|
| Study Period | 2020-2034 |
| Base Year | 2025 |
| Estimated Year | 2026 |
| Forecast Period | 2026-2034 |
| Historical Period | 2020-2025 |
| Growth Rate | CAGR of 14.54% from 2020-2034 |
| Segmentation |
|
Table of Contents
- 1. Introduction
- 1.1. Research Scope
- 1.2. Market Segmentation
- 1.3. Research Methodology
- 1.4. Definitions and Assumptions
- 2. Executive Summary
- 2.1. Introduction
- 3. Market Dynamics
- 3.1. Introduction
- 3.2. Market Drivers
- 3.3. Market Restrains
- 3.4. Market Trends
- 4. Market Factor Analysis
- 4.1. Porters Five Forces
- 4.2. Supply/Value Chain
- 4.3. PESTEL analysis
- 4.4. Market Entropy
- 4.5. Patent/Trademark Analysis
- 5. Global Electrophoretic E-Paper Display Analysis, Insights and Forecast, 2020-2032
- 5.1. Market Analysis, Insights and Forecast - by Application
- 5.1.1. Consumer Electronics
- 5.1.2. Retail
- 5.1.3. Medical
- 5.1.4. Transportation
- 5.2. Market Analysis, Insights and Forecast - by Types
- 5.2.1. E-readers
- 5.2.2. Sub-displays for Mobile Phones and Media Players
- 5.2.3. White Goods
- 5.2.4. Wrist Watches
- 5.2.5. Others
- 5.3. Market Analysis, Insights and Forecast - by Region
- 5.3.1. North America
- 5.3.2. South America
- 5.3.3. Europe
- 5.3.4. Middle East & Africa
- 5.3.5. Asia Pacific
- 5.1. Market Analysis, Insights and Forecast - by Application
- 6. North America Electrophoretic E-Paper Display Analysis, Insights and Forecast, 2020-2032
- 6.1. Market Analysis, Insights and Forecast - by Application
- 6.1.1. Consumer Electronics
- 6.1.2. Retail
- 6.1.3. Medical
- 6.1.4. Transportation
- 6.2. Market Analysis, Insights and Forecast - by Types
- 6.2.1. E-readers
- 6.2.2. Sub-displays for Mobile Phones and Media Players
- 6.2.3. White Goods
- 6.2.4. Wrist Watches
- 6.2.5. Others
- 6.1. Market Analysis, Insights and Forecast - by Application
- 7. South America Electrophoretic E-Paper Display Analysis, Insights and Forecast, 2020-2032
- 7.1. Market Analysis, Insights and Forecast - by Application
- 7.1.1. Consumer Electronics
- 7.1.2. Retail
- 7.1.3. Medical
- 7.1.4. Transportation
- 7.2. Market Analysis, Insights and Forecast - by Types
- 7.2.1. E-readers
- 7.2.2. Sub-displays for Mobile Phones and Media Players
- 7.2.3. White Goods
- 7.2.4. Wrist Watches
- 7.2.5. Others
- 7.1. Market Analysis, Insights and Forecast - by Application
- 8. Europe Electrophoretic E-Paper Display Analysis, Insights and Forecast, 2020-2032
- 8.1. Market Analysis, Insights and Forecast - by Application
- 8.1.1. Consumer Electronics
- 8.1.2. Retail
- 8.1.3. Medical
- 8.1.4. Transportation
- 8.2. Market Analysis, Insights and Forecast - by Types
- 8.2.1. E-readers
- 8.2.2. Sub-displays for Mobile Phones and Media Players
- 8.2.3. White Goods
- 8.2.4. Wrist Watches
- 8.2.5. Others
- 8.1. Market Analysis, Insights and Forecast - by Application
- 9. Middle East & Africa Electrophoretic E-Paper Display Analysis, Insights and Forecast, 2020-2032
- 9.1. Market Analysis, Insights and Forecast - by Application
- 9.1.1. Consumer Electronics
- 9.1.2. Retail
- 9.1.3. Medical
- 9.1.4. Transportation
- 9.2. Market Analysis, Insights and Forecast - by Types
- 9.2.1. E-readers
- 9.2.2. Sub-displays for Mobile Phones and Media Players
- 9.2.3. White Goods
- 9.2.4. Wrist Watches
- 9.2.5. Others
- 9.1. Market Analysis, Insights and Forecast - by Application
- 10. Asia Pacific Electrophoretic E-Paper Display Analysis, Insights and Forecast, 2020-2032
- 10.1. Market Analysis, Insights and Forecast - by Application
- 10.1.1. Consumer Electronics
- 10.1.2. Retail
- 10.1.3. Medical
- 10.1.4. Transportation
- 10.2. Market Analysis, Insights and Forecast - by Types
- 10.2.1. E-readers
- 10.2.2. Sub-displays for Mobile Phones and Media Players
- 10.2.3. White Goods
- 10.2.4. Wrist Watches
- 10.2.5. Others
- 10.1. Market Analysis, Insights and Forecast - by Application
- 11. Competitive Analysis
- 11.1. Global Market Share Analysis 2025
- 11.2. Company Profiles
- 11.2.1 ACREO AB
- 11.2.1.1. Overview
- 11.2.1.2. Products
- 11.2.1.3. SWOT Analysis
- 11.2.1.4. Recent Developments
- 11.2.1.5. Financials (Based on Availability)
- 11.2.2 AVESO DISPLAYS
- 11.2.2.1. Overview
- 11.2.2.2. Products
- 11.2.2.3. SWOT Analysis
- 11.2.2.4. Recent Developments
- 11.2.2.5. Financials (Based on Availability)
- 11.2.3 BRIDGESTONE CORP
- 11.2.3.1. Overview
- 11.2.3.2. Products
- 11.2.3.3. SWOT Analysis
- 11.2.3.4. Recent Developments
- 11.2.3.5. Financials (Based on Availability)
- 11.2.4 DELTA ELECTRONICS
- 11.2.4.1. Overview
- 11.2.4.2. Products
- 11.2.4.3. SWOT Analysis
- 11.2.4.4. Recent Developments
- 11.2.4.5. Financials (Based on Availability)
- 11.2.5 INC.
- 11.2.5.1. Overview
- 11.2.5.2. Products
- 11.2.5.3. SWOT Analysis
- 11.2.5.4. Recent Developments
- 11.2.5.5. Financials (Based on Availability)
- 11.2.6 E INK HOLDINGS
- 11.2.6.1. Overview
- 11.2.6.2. Products
- 11.2.6.3. SWOT Analysis
- 11.2.6.4. Recent Developments
- 11.2.6.5. Financials (Based on Availability)
- 11.2.7 INC.
- 11.2.7.1. Overview
- 11.2.7.2. Products
- 11.2.7.3. SWOT Analysis
- 11.2.7.4. Recent Developments
- 11.2.7.5. Financials (Based on Availability)
- 11.2.8 GAMMA DYNAMICS
- 11.2.8.1. Overview
- 11.2.8.2. Products
- 11.2.8.3. SWOT Analysis
- 11.2.8.4. Recent Developments
- 11.2.8.5. Financials (Based on Availability)
- 11.2.9 HANVON TECHNOLOGY CO.
- 11.2.9.1. Overview
- 11.2.9.2. Products
- 11.2.9.3. SWOT Analysis
- 11.2.9.4. Recent Developments
- 11.2.9.5. Financials (Based on Availability)
- 11.2.10 LTD.
- 11.2.10.1. Overview
- 11.2.10.2. Products
- 11.2.10.3. SWOT Analysis
- 11.2.10.4. Recent Developments
- 11.2.10.5. Financials (Based on Availability)
- 11.2.11 ITRI
- 11.2.11.1. Overview
- 11.2.11.2. Products
- 11.2.11.3. SWOT Analysis
- 11.2.11.4. Recent Developments
- 11.2.11.5. Financials (Based on Availability)
- 11.2.12 LG DISPLAY
- 11.2.12.1. Overview
- 11.2.12.2. Products
- 11.2.12.3. SWOT Analysis
- 11.2.12.4. Recent Developments
- 11.2.12.5. Financials (Based on Availability)
- 11.2.13 LIQUAVISTA
- 11.2.13.1. Overview
- 11.2.13.2. Products
- 11.2.13.3. SWOT Analysis
- 11.2.13.4. Recent Developments
- 11.2.13.5. Financials (Based on Availability)
- 11.2.14 NEC LCD TECHNOLOGIES LTD.
- 11.2.14.1. Overview
- 11.2.14.2. Products
- 11.2.14.3. SWOT Analysis
- 11.2.14.4. Recent Developments
- 11.2.14.5. Financials (Based on Availability)
- 11.2.15 NEMOPTIC PVT. LTD.
- 11.2.15.1. Overview
- 11.2.15.2. Products
- 11.2.15.3. SWOT Analysis
- 11.2.15.4. Recent Developments
- 11.2.15.5. Financials (Based on Availability)
- 11.2.16 NTERA
- 11.2.16.1. Overview
- 11.2.16.2. Products
- 11.2.16.3. SWOT Analysis
- 11.2.16.4. Recent Developments
- 11.2.16.5. Financials (Based on Availability)
- 11.2.17 INC.
- 11.2.17.1. Overview
- 11.2.17.2. Products
- 11.2.17.3. SWOT Analysis
- 11.2.17.4. Recent Developments
- 11.2.17.5. Financials (Based on Availability)
- 11.2.18 PLASTIC LOGIC PVT. LTD.
- 11.2.18.1. Overview
- 11.2.18.2. Products
- 11.2.18.3. SWOT Analysis
- 11.2.18.4. Recent Developments
- 11.2.18.5. Financials (Based on Availability)
- 11.2.19 QUALCOMM MEMS TECHNOLOGIES
- 11.2.19.1. Overview
- 11.2.19.2. Products
- 11.2.19.3. SWOT Analysis
- 11.2.19.4. Recent Developments
- 11.2.19.5. Financials (Based on Availability)
- 11.2.20 INC.
- 11.2.20.1. Overview
- 11.2.20.2. Products
- 11.2.20.3. SWOT Analysis
- 11.2.20.4. Recent Developments
- 11.2.20.5. Financials (Based on Availability)
- 11.2.21 SAMSUNG ELECTRONICS
- 11.2.21.1. Overview
- 11.2.21.2. Products
- 11.2.21.3. SWOT Analysis
- 11.2.21.4. Recent Developments
- 11.2.21.5. Financials (Based on Availability)
- 11.2.22 SEIKO EPSON
- 11.2.22.1. Overview
- 11.2.22.2. Products
- 11.2.22.3. SWOT Analysis
- 11.2.22.4. Recent Developments
- 11.2.22.5. Financials (Based on Availability)
- 11.2.23 SIPIX IMAGING
- 11.2.23.1. Overview
- 11.2.23.2. Products
- 11.2.23.3. SWOT Analysis
- 11.2.23.4. Recent Developments
- 11.2.23.5. Financials (Based on Availability)
- 11.2.24 INC.
- 11.2.24.1. Overview
- 11.2.24.2. Products
- 11.2.24.3. SWOT Analysis
- 11.2.24.4. Recent Developments
- 11.2.24.5. Financials (Based on Availability)
- 11.2.25 SONY
- 11.2.25.1. Overview
- 11.2.25.2. Products
- 11.2.25.3. SWOT Analysis
- 11.2.25.4. Recent Developments
- 11.2.25.5. Financials (Based on Availability)
- 11.2.26 ZBD SOLUTIONS
- 11.2.26.1. Overview
- 11.2.26.2. Products
- 11.2.26.3. SWOT Analysis
- 11.2.26.4. Recent Developments
- 11.2.26.5. Financials (Based on Availability)
- 11.2.1 ACREO AB
List of Figures
- Figure 1: Global Electrophoretic E-Paper Display Revenue Breakdown (undefined, %) by Region 2025 & 2033
- Figure 2: Global Electrophoretic E-Paper Display Volume Breakdown (K, %) by Region 2025 & 2033
- Figure 3: North America Electrophoretic E-Paper Display Revenue (undefined), by Application 2025 & 2033
- Figure 4: North America Electrophoretic E-Paper Display Volume (K), by Application 2025 & 2033
- Figure 5: North America Electrophoretic E-Paper Display Revenue Share (%), by Application 2025 & 2033
- Figure 6: North America Electrophoretic E-Paper Display Volume Share (%), by Application 2025 & 2033
- Figure 7: North America Electrophoretic E-Paper Display Revenue (undefined), by Types 2025 & 2033
- Figure 8: North America Electrophoretic E-Paper Display Volume (K), by Types 2025 & 2033
- Figure 9: North America Electrophoretic E-Paper Display Revenue Share (%), by Types 2025 & 2033
- Figure 10: North America Electrophoretic E-Paper Display Volume Share (%), by Types 2025 & 2033
- Figure 11: North America Electrophoretic E-Paper Display Revenue (undefined), by Country 2025 & 2033
- Figure 12: North America Electrophoretic E-Paper Display Volume (K), by Country 2025 & 2033
- Figure 13: North America Electrophoretic E-Paper Display Revenue Share (%), by Country 2025 & 2033
- Figure 14: North America Electrophoretic E-Paper Display Volume Share (%), by Country 2025 & 2033
- Figure 15: South America Electrophoretic E-Paper Display Revenue (undefined), by Application 2025 & 2033
- Figure 16: South America Electrophoretic E-Paper Display Volume (K), by Application 2025 & 2033
- Figure 17: South America Electrophoretic E-Paper Display Revenue Share (%), by Application 2025 & 2033
- Figure 18: South America Electrophoretic E-Paper Display Volume Share (%), by Application 2025 & 2033
- Figure 19: South America Electrophoretic E-Paper Display Revenue (undefined), by Types 2025 & 2033
- Figure 20: South America Electrophoretic E-Paper Display Volume (K), by Types 2025 & 2033
- Figure 21: South America Electrophoretic E-Paper Display Revenue Share (%), by Types 2025 & 2033
- Figure 22: South America Electrophoretic E-Paper Display Volume Share (%), by Types 2025 & 2033
- Figure 23: South America Electrophoretic E-Paper Display Revenue (undefined), by Country 2025 & 2033
- Figure 24: South America Electrophoretic E-Paper Display Volume (K), by Country 2025 & 2033
- Figure 25: South America Electrophoretic E-Paper Display Revenue Share (%), by Country 2025 & 2033
- Figure 26: South America Electrophoretic E-Paper Display Volume Share (%), by Country 2025 & 2033
- Figure 27: Europe Electrophoretic E-Paper Display Revenue (undefined), by Application 2025 & 2033
- Figure 28: Europe Electrophoretic E-Paper Display Volume (K), by Application 2025 & 2033
- Figure 29: Europe Electrophoretic E-Paper Display Revenue Share (%), by Application 2025 & 2033
- Figure 30: Europe Electrophoretic E-Paper Display Volume Share (%), by Application 2025 & 2033
- Figure 31: Europe Electrophoretic E-Paper Display Revenue (undefined), by Types 2025 & 2033
- Figure 32: Europe Electrophoretic E-Paper Display Volume (K), by Types 2025 & 2033
- Figure 33: Europe Electrophoretic E-Paper Display Revenue Share (%), by Types 2025 & 2033
- Figure 34: Europe Electrophoretic E-Paper Display Volume Share (%), by Types 2025 & 2033
- Figure 35: Europe Electrophoretic E-Paper Display Revenue (undefined), by Country 2025 & 2033
- Figure 36: Europe Electrophoretic E-Paper Display Volume (K), by Country 2025 & 2033
- Figure 37: Europe Electrophoretic E-Paper Display Revenue Share (%), by Country 2025 & 2033
- Figure 38: Europe Electrophoretic E-Paper Display Volume Share (%), by Country 2025 & 2033
- Figure 39: Middle East & Africa Electrophoretic E-Paper Display Revenue (undefined), by Application 2025 & 2033
- Figure 40: Middle East & Africa Electrophoretic E-Paper Display Volume (K), by Application 2025 & 2033
- Figure 41: Middle East & Africa Electrophoretic E-Paper Display Revenue Share (%), by Application 2025 & 2033
- Figure 42: Middle East & Africa Electrophoretic E-Paper Display Volume Share (%), by Application 2025 & 2033
- Figure 43: Middle East & Africa Electrophoretic E-Paper Display Revenue (undefined), by Types 2025 & 2033
- Figure 44: Middle East & Africa Electrophoretic E-Paper Display Volume (K), by Types 2025 & 2033
- Figure 45: Middle East & Africa Electrophoretic E-Paper Display Revenue Share (%), by Types 2025 & 2033
- Figure 46: Middle East & Africa Electrophoretic E-Paper Display Volume Share (%), by Types 2025 & 2033
- Figure 47: Middle East & Africa Electrophoretic E-Paper Display Revenue (undefined), by Country 2025 & 2033
- Figure 48: Middle East & Africa Electrophoretic E-Paper Display Volume (K), by Country 2025 & 2033
- Figure 49: Middle East & Africa Electrophoretic E-Paper Display Revenue Share (%), by Country 2025 & 2033
- Figure 50: Middle East & Africa Electrophoretic E-Paper Display Volume Share (%), by Country 2025 & 2033
- Figure 51: Asia Pacific Electrophoretic E-Paper Display Revenue (undefined), by Application 2025 & 2033
- Figure 52: Asia Pacific Electrophoretic E-Paper Display Volume (K), by Application 2025 & 2033
- Figure 53: Asia Pacific Electrophoretic E-Paper Display Revenue Share (%), by Application 2025 & 2033
- Figure 54: Asia Pacific Electrophoretic E-Paper Display Volume Share (%), by Application 2025 & 2033
- Figure 55: Asia Pacific Electrophoretic E-Paper Display Revenue (undefined), by Types 2025 & 2033
- Figure 56: Asia Pacific Electrophoretic E-Paper Display Volume (K), by Types 2025 & 2033
- Figure 57: Asia Pacific Electrophoretic E-Paper Display Revenue Share (%), by Types 2025 & 2033
- Figure 58: Asia Pacific Electrophoretic E-Paper Display Volume Share (%), by Types 2025 & 2033
- Figure 59: Asia Pacific Electrophoretic E-Paper Display Revenue (undefined), by Country 2025 & 2033
- Figure 60: Asia Pacific Electrophoretic E-Paper Display Volume (K), by Country 2025 & 2033
- Figure 61: Asia Pacific Electrophoretic E-Paper Display Revenue Share (%), by Country 2025 & 2033
- Figure 62: Asia Pacific Electrophoretic E-Paper Display Volume Share (%), by Country 2025 & 2033
List of Tables
- Table 1: Global Electrophoretic E-Paper Display Revenue undefined Forecast, by Application 2020 & 2033
- Table 2: Global Electrophoretic E-Paper Display Volume K Forecast, by Application 2020 & 2033
- Table 3: Global Electrophoretic E-Paper Display Revenue undefined Forecast, by Types 2020 & 2033
- Table 4: Global Electrophoretic E-Paper Display Volume K Forecast, by Types 2020 & 2033
- Table 5: Global Electrophoretic E-Paper Display Revenue undefined Forecast, by Region 2020 & 2033
- Table 6: Global Electrophoretic E-Paper Display Volume K Forecast, by Region 2020 & 2033
- Table 7: Global Electrophoretic E-Paper Display Revenue undefined Forecast, by Application 2020 & 2033
- Table 8: Global Electrophoretic E-Paper Display Volume K Forecast, by Application 2020 & 2033
- Table 9: Global Electrophoretic E-Paper Display Revenue undefined Forecast, by Types 2020 & 2033
- Table 10: Global Electrophoretic E-Paper Display Volume K Forecast, by Types 2020 & 2033
- Table 11: Global Electrophoretic E-Paper Display Revenue undefined Forecast, by Country 2020 & 2033
- Table 12: Global Electrophoretic E-Paper Display Volume K Forecast, by Country 2020 & 2033
- Table 13: United States Electrophoretic E-Paper Display Revenue (undefined) Forecast, by Application 2020 & 2033
- Table 14: United States Electrophoretic E-Paper Display Volume (K) Forecast, by Application 2020 & 2033
- Table 15: Canada Electrophoretic E-Paper Display Revenue (undefined) Forecast, by Application 2020 & 2033
- Table 16: Canada Electrophoretic E-Paper Display Volume (K) Forecast, by Application 2020 & 2033
- Table 17: Mexico Electrophoretic E-Paper Display Revenue (undefined) Forecast, by Application 2020 & 2033
- Table 18: Mexico Electrophoretic E-Paper Display Volume (K) Forecast, by Application 2020 & 2033
- Table 19: Global Electrophoretic E-Paper Display Revenue undefined Forecast, by Application 2020 & 2033
- Table 20: Global Electrophoretic E-Paper Display Volume K Forecast, by Application 2020 & 2033
- Table 21: Global Electrophoretic E-Paper Display Revenue undefined Forecast, by Types 2020 & 2033
- Table 22: Global Electrophoretic E-Paper Display Volume K Forecast, by Types 2020 & 2033
- Table 23: Global Electrophoretic E-Paper Display Revenue undefined Forecast, by Country 2020 & 2033
- Table 24: Global Electrophoretic E-Paper Display Volume K Forecast, by Country 2020 & 2033
- Table 25: Brazil Electrophoretic E-Paper Display Revenue (undefined) Forecast, by Application 2020 & 2033
- Table 26: Brazil Electrophoretic E-Paper Display Volume (K) Forecast, by Application 2020 & 2033
- Table 27: Argentina Electrophoretic E-Paper Display Revenue (undefined) Forecast, by Application 2020 & 2033
- Table 28: Argentina Electrophoretic E-Paper Display Volume (K) Forecast, by Application 2020 & 2033
- Table 29: Rest of South America Electrophoretic E-Paper Display Revenue (undefined) Forecast, by Application 2020 & 2033
- Table 30: Rest of South America Electrophoretic E-Paper Display Volume (K) Forecast, by Application 2020 & 2033
- Table 31: Global Electrophoretic E-Paper Display Revenue undefined Forecast, by Application 2020 & 2033
- Table 32: Global Electrophoretic E-Paper Display Volume K Forecast, by Application 2020 & 2033
- Table 33: Global Electrophoretic E-Paper Display Revenue undefined Forecast, by Types 2020 & 2033
- Table 34: Global Electrophoretic E-Paper Display Volume K Forecast, by Types 2020 & 2033
- Table 35: Global Electrophoretic E-Paper Display Revenue undefined Forecast, by Country 2020 & 2033
- Table 36: Global Electrophoretic E-Paper Display Volume K Forecast, by Country 2020 & 2033
- Table 37: United Kingdom Electrophoretic E-Paper Display Revenue (undefined) Forecast, by Application 2020 & 2033
- Table 38: United Kingdom Electrophoretic E-Paper Display Volume (K) Forecast, by Application 2020 & 2033
- Table 39: Germany Electrophoretic E-Paper Display Revenue (undefined) Forecast, by Application 2020 & 2033
- Table 40: Germany Electrophoretic E-Paper Display Volume (K) Forecast, by Application 2020 & 2033
- Table 41: France Electrophoretic E-Paper Display Revenue (undefined) Forecast, by Application 2020 & 2033
- Table 42: France Electrophoretic E-Paper Display Volume (K) Forecast, by Application 2020 & 2033
- Table 43: Italy Electrophoretic E-Paper Display Revenue (undefined) Forecast, by Application 2020 & 2033
- Table 44: Italy Electrophoretic E-Paper Display Volume (K) Forecast, by Application 2020 & 2033
- Table 45: Spain Electrophoretic E-Paper Display Revenue (undefined) Forecast, by Application 2020 & 2033
- Table 46: Spain Electrophoretic E-Paper Display Volume (K) Forecast, by Application 2020 & 2033
- Table 47: Russia Electrophoretic E-Paper Display Revenue (undefined) Forecast, by Application 2020 & 2033
- Table 48: Russia Electrophoretic E-Paper Display Volume (K) Forecast, by Application 2020 & 2033
- Table 49: Benelux Electrophoretic E-Paper Display Revenue (undefined) Forecast, by Application 2020 & 2033
- Table 50: Benelux Electrophoretic E-Paper Display Volume (K) Forecast, by Application 2020 & 2033
- Table 51: Nordics Electrophoretic E-Paper Display Revenue (undefined) Forecast, by Application 2020 & 2033
- Table 52: Nordics Electrophoretic E-Paper Display Volume (K) Forecast, by Application 2020 & 2033
- Table 53: Rest of Europe Electrophoretic E-Paper Display Revenue (undefined) Forecast, by Application 2020 & 2033
- Table 54: Rest of Europe Electrophoretic E-Paper Display Volume (K) Forecast, by Application 2020 & 2033
- Table 55: Global Electrophoretic E-Paper Display Revenue undefined Forecast, by Application 2020 & 2033
- Table 56: Global Electrophoretic E-Paper Display Volume K Forecast, by Application 2020 & 2033
- Table 57: Global Electrophoretic E-Paper Display Revenue undefined Forecast, by Types 2020 & 2033
- Table 58: Global Electrophoretic E-Paper Display Volume K Forecast, by Types 2020 & 2033
- Table 59: Global Electrophoretic E-Paper Display Revenue undefined Forecast, by Country 2020 & 2033
- Table 60: Global Electrophoretic E-Paper Display Volume K Forecast, by Country 2020 & 2033
- Table 61: Turkey Electrophoretic E-Paper Display Revenue (undefined) Forecast, by Application 2020 & 2033
- Table 62: Turkey Electrophoretic E-Paper Display Volume (K) Forecast, by Application 2020 & 2033
- Table 63: Israel Electrophoretic E-Paper Display Revenue (undefined) Forecast, by Application 2020 & 2033
- Table 64: Israel Electrophoretic E-Paper Display Volume (K) Forecast, by Application 2020 & 2033
- Table 65: GCC Electrophoretic E-Paper Display Revenue (undefined) Forecast, by Application 2020 & 2033
- Table 66: GCC Electrophoretic E-Paper Display Volume (K) Forecast, by Application 2020 & 2033
- Table 67: North Africa Electrophoretic E-Paper Display Revenue (undefined) Forecast, by Application 2020 & 2033
- Table 68: North Africa Electrophoretic E-Paper Display Volume (K) Forecast, by Application 2020 & 2033
- Table 69: South Africa Electrophoretic E-Paper Display Revenue (undefined) Forecast, by Application 2020 & 2033
- Table 70: South Africa Electrophoretic E-Paper Display Volume (K) Forecast, by Application 2020 & 2033
- Table 71: Rest of Middle East & Africa Electrophoretic E-Paper Display Revenue (undefined) Forecast, by Application 2020 & 2033
- Table 72: Rest of Middle East & Africa Electrophoretic E-Paper Display Volume (K) Forecast, by Application 2020 & 2033
- Table 73: Global Electrophoretic E-Paper Display Revenue undefined Forecast, by Application 2020 & 2033
- Table 74: Global Electrophoretic E-Paper Display Volume K Forecast, by Application 2020 & 2033
- Table 75: Global Electrophoretic E-Paper Display Revenue undefined Forecast, by Types 2020 & 2033
- Table 76: Global Electrophoretic E-Paper Display Volume K Forecast, by Types 2020 & 2033
- Table 77: Global Electrophoretic E-Paper Display Revenue undefined Forecast, by Country 2020 & 2033
- Table 78: Global Electrophoretic E-Paper Display Volume K Forecast, by Country 2020 & 2033
- Table 79: China Electrophoretic E-Paper Display Revenue (undefined) Forecast, by Application 2020 & 2033
- Table 80: China Electrophoretic E-Paper Display Volume (K) Forecast, by Application 2020 & 2033
- Table 81: India Electrophoretic E-Paper Display Revenue (undefined) Forecast, by Application 2020 & 2033
- Table 82: India Electrophoretic E-Paper Display Volume (K) Forecast, by Application 2020 & 2033
- Table 83: Japan Electrophoretic E-Paper Display Revenue (undefined) Forecast, by Application 2020 & 2033
- Table 84: Japan Electrophoretic E-Paper Display Volume (K) Forecast, by Application 2020 & 2033
- Table 85: South Korea Electrophoretic E-Paper Display Revenue (undefined) Forecast, by Application 2020 & 2033
- Table 86: South Korea Electrophoretic E-Paper Display Volume (K) Forecast, by Application 2020 & 2033
- Table 87: ASEAN Electrophoretic E-Paper Display Revenue (undefined) Forecast, by Application 2020 & 2033
- Table 88: ASEAN Electrophoretic E-Paper Display Volume (K) Forecast, by Application 2020 & 2033
- Table 89: Oceania Electrophoretic E-Paper Display Revenue (undefined) Forecast, by Application 2020 & 2033
- Table 90: Oceania Electrophoretic E-Paper Display Volume (K) Forecast, by Application 2020 & 2033
- Table 91: Rest of Asia Pacific Electrophoretic E-Paper Display Revenue (undefined) Forecast, by Application 2020 & 2033
- Table 92: Rest of Asia Pacific Electrophoretic E-Paper Display Volume (K) Forecast, by Application 2020 & 2033
Frequently Asked Questions
1. What is the projected Compound Annual Growth Rate (CAGR) of the Electrophoretic E-Paper Display?
The projected CAGR is approximately 14.54%.
2. Which companies are prominent players in the Electrophoretic E-Paper Display?
Key companies in the market include ACREO AB, AVESO DISPLAYS, BRIDGESTONE CORP, DELTA ELECTRONICS, INC., E INK HOLDINGS, INC., GAMMA DYNAMICS, HANVON TECHNOLOGY CO., LTD., ITRI, LG DISPLAY, LIQUAVISTA, NEC LCD TECHNOLOGIES LTD., NEMOPTIC PVT. LTD., NTERA, INC., PLASTIC LOGIC PVT. LTD., QUALCOMM MEMS TECHNOLOGIES, INC., SAMSUNG ELECTRONICS, SEIKO EPSON, SIPIX IMAGING, INC., SONY, ZBD SOLUTIONS.
3. What are the main segments of the Electrophoretic E-Paper Display?
The market segments include Application, Types.
4. Can you provide details about the market size?
The market size is estimated to be USD XXX N/A as of 2022.
5. What are some drivers contributing to market growth?
N/A
6. What are the notable trends driving market growth?
N/A
7. Are there any restraints impacting market growth?
N/A
8. Can you provide examples of recent developments in the market?
N/A
9. What pricing options are available for accessing the report?
Pricing options include single-user, multi-user, and enterprise licenses priced at USD 3350.00, USD 5025.00, and USD 6700.00 respectively.
10. Is the market size provided in terms of value or volume?
The market size is provided in terms of value, measured in N/A and volume, measured in K.
11. Are there any specific market keywords associated with the report?
Yes, the market keyword associated with the report is "Electrophoretic E-Paper Display," which aids in identifying and referencing the specific market segment covered.
12. How do I determine which pricing option suits my needs best?
The pricing options vary based on user requirements and access needs. Individual users may opt for single-user licenses, while businesses requiring broader access may choose multi-user or enterprise licenses for cost-effective access to the report.
13. Are there any additional resources or data provided in the Electrophoretic E-Paper Display report?
While the report offers comprehensive insights, it's advisable to review the specific contents or supplementary materials provided to ascertain if additional resources or data are available.
14. How can I stay updated on further developments or reports in the Electrophoretic E-Paper Display?
To stay informed about further developments, trends, and reports in the Electrophoretic E-Paper Display, consider subscribing to industry newsletters, following relevant companies and organizations, or regularly checking reputable industry news sources and publications.
Methodology
Step 1 - Identification of Relevant Samples Size from Population Database


Step 2 - Approaches for Defining Global Market Size (Value, Volume* & Price*)

Note*: In applicable scenarios
Step 3 - Data Sources
Primary Research
- Web Analytics
- Survey Reports
- Research Institute
- Latest Research Reports
- Opinion Leaders
Secondary Research
- Annual Reports
- White Paper
- Latest Press Release
- Industry Association
- Paid Database
- Investor Presentations

Step 4 - Data Triangulation
Involves using different sources of information in order to increase the validity of a study
These sources are likely to be stakeholders in a program - participants, other researchers, program staff, other community members, and so on.
Then we put all data in single framework & apply various statistical tools to find out the dynamic on the market.
During the analysis stage, feedback from the stakeholder groups would be compared to determine areas of agreement as well as areas of divergence