

Key Insights
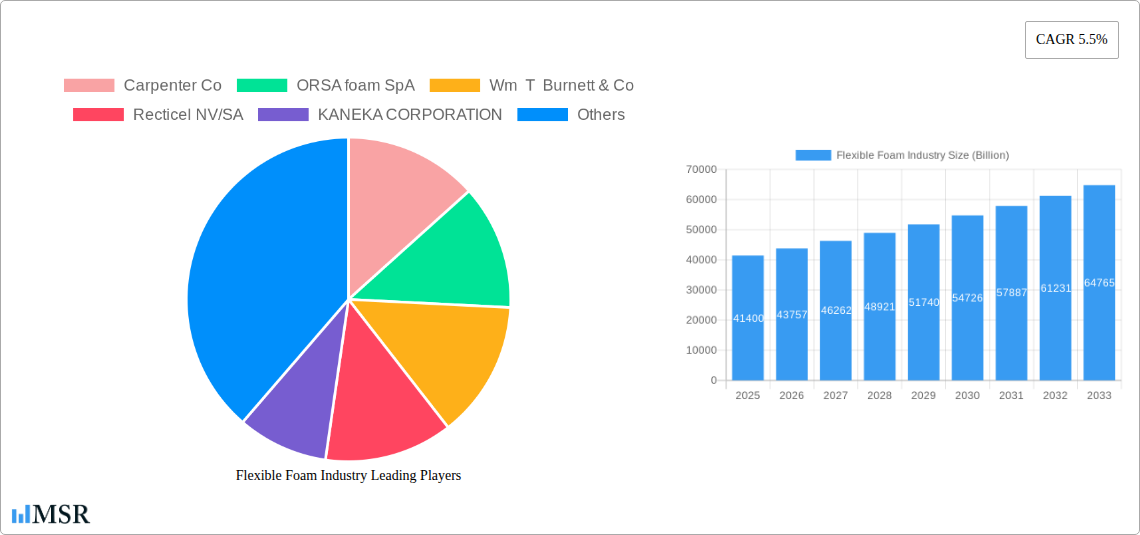
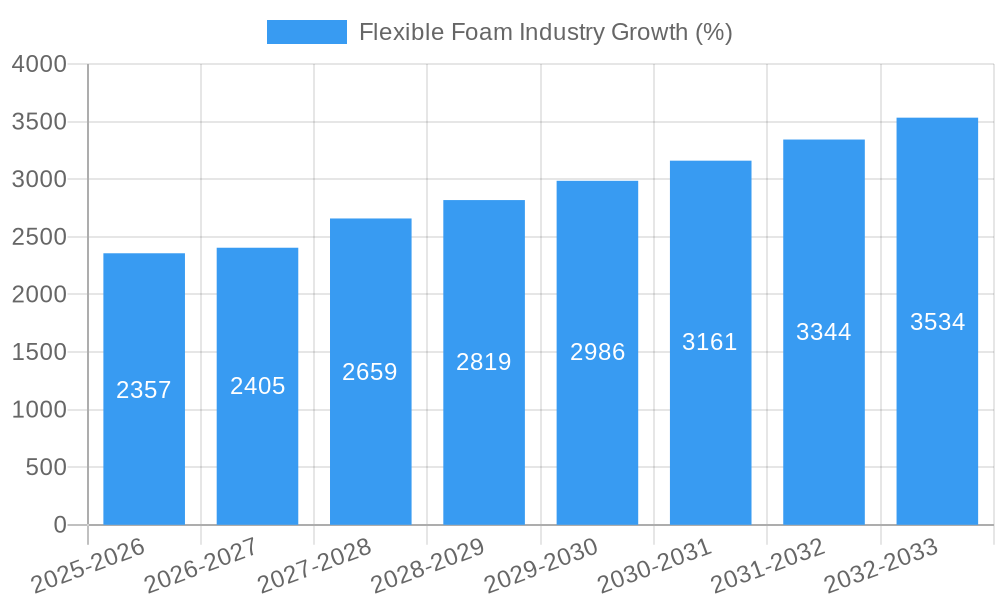
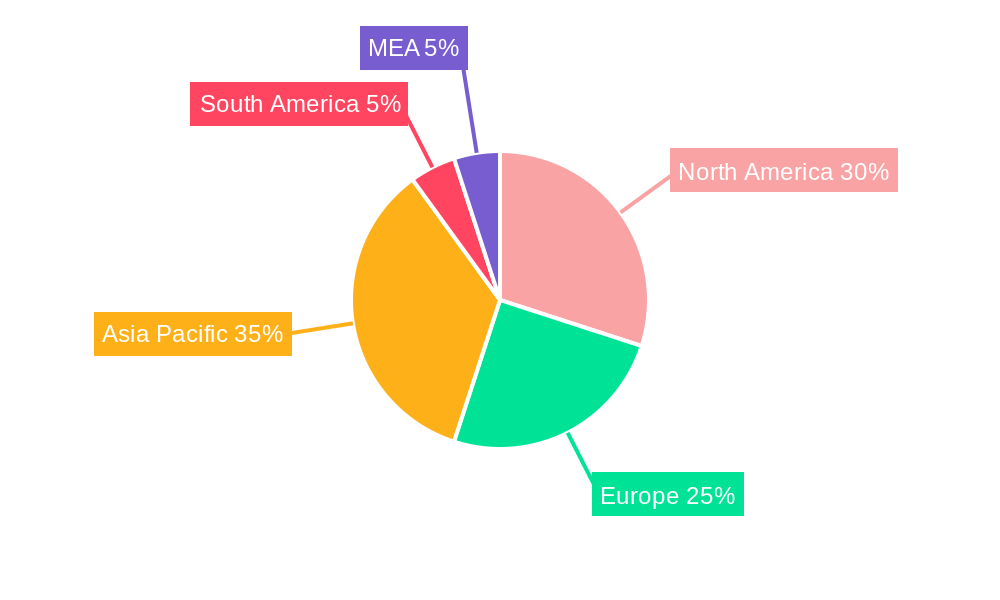
The flexible foam market, valued at $41.4 billion in 2025, is projected to experience robust growth, driven by a compound annual growth rate (CAGR) of 5.5% from 2025 to 2033. This expansion is fueled by several key factors. The burgeoning construction industry, particularly in developing economies, significantly boosts demand for flexible polyurethane foam in insulation and cushioning applications. Simultaneously, the growing consumer goods sector, encompassing mattresses, furniture, and automotive interiors, further fuels market growth. Technological advancements leading to the development of more sustainable and high-performance foams, such as those with improved durability and enhanced comfort properties, are also contributing to market expansion. Furthermore, increasing disposable incomes globally are driving demand for comfortable and high-quality furniture and bedding, thus bolstering the market. However, fluctuating raw material prices, particularly for petroleum-based components, pose a challenge. Additionally, stringent environmental regulations concerning volatile organic compound (VOC) emissions from certain foam types are creating hurdles for some manufacturers. The market is segmented by application (construction, consumer goods, furniture, transportation, and other applications) and type (polyurethane, polyether, polyethylene, non-cross-linked polypropylene). Polyurethane foam currently dominates due to its versatility and cost-effectiveness. Geographically, North America and Europe hold significant market share, but the Asia-Pacific region is anticipated to witness the fastest growth due to rapid industrialization and urbanization. Major players like BASF, Huntsman, and Dow are investing heavily in research and development to maintain their competitive edge and capitalize on emerging market trends.
The competitive landscape is characterized by a mix of established multinational corporations and regional players. Established companies leverage their extensive distribution networks and brand recognition to maintain a substantial market share. However, regional players are gaining traction by focusing on niche applications and offering customized solutions tailored to local preferences. The market's future trajectory hinges on successfully navigating environmental concerns and leveraging technological innovation to develop sustainable and high-performance flexible foams that meet the evolving demands of diverse industries and consumers. Strategic partnerships, mergers and acquisitions, and investments in production capacity are likely to further shape the competitive landscape in the coming years. The consistent growth trajectory makes the flexible foam market an attractive investment opportunity for both established and emerging players.
Flexible Foam Industry: A Comprehensive Market Report (2019-2033)
This comprehensive report provides an in-depth analysis of the flexible foam industry, encompassing market size, key segments, leading players, and future growth prospects. With a study period spanning 2019-2033, a base year of 2025, and a forecast period of 2025-2033, this report offers invaluable insights for industry stakeholders, investors, and strategic decision-makers. The global flexible foam market is projected to reach a value of $XX Billion by 2033, exhibiting a CAGR of XX% during the forecast period.
Flexible Foam Industry Market Concentration & Dynamics
The flexible foam market exhibits a moderately concentrated structure, with several major players holding significant market share. Key players like BASF SE, Huntsman International LLC, and Dow collectively account for an estimated XX% of the global market. However, the market also features several regional and specialized players, creating a dynamic competitive landscape. Innovation ecosystems are flourishing, with ongoing research and development focused on improving foam properties like durability, sustainability, and thermal performance. Regulatory frameworks, including those related to environmental protection and material safety, play a significant role in shaping market dynamics. Substitute products, such as alternative insulation materials, pose a moderate competitive threat. End-user trends, particularly towards sustainable and high-performance materials, are driving demand for innovative flexible foam solutions. Mergers and acquisitions (M&A) activity is relatively frequent, reflecting the industry's consolidation and expansion trends. In the last five years, approximately XX M&A deals were recorded, demonstrating a significant level of consolidation within the industry.
- Market Share: Top 3 players hold XX%, Top 5 players hold XX%.
- M&A Activity: XX deals in the last five years, with a significant increase in recent years.
- Regulatory Landscape: Stringent environmental regulations in several key markets are influencing material choices and manufacturing processes.
- Substitute Products: Growing competition from alternative insulation materials, particularly in the construction sector.
Flexible Foam Industry Industry Insights & Trends
The flexible foam market is experiencing robust growth, driven by several key factors. The increasing demand from the construction, furniture, and automotive industries is a major contributor to market expansion. Technological advancements are leading to the development of flexible foams with enhanced properties, such as improved durability, thermal insulation, and fire resistance. This is further fueling market growth, attracting investment into R&D for specialized applications. Consumer behavior is evolving towards more sustainable products, creating a significant opportunity for manufacturers to develop eco-friendly foam solutions. These trends, along with favorable economic conditions in key regions, are expected to drive market expansion throughout the forecast period. The global market size in 2024 was estimated at $XX Billion and is projected to reach $XX Billion by 2033, exhibiting a CAGR of XX%.
Key Markets & Segments Leading Flexible Foam Industry
The construction sector represents the largest application segment for flexible foam, accounting for approximately XX% of total market value in 2024. This is fueled by the growing global construction activity and the increasing adoption of flexible foams for insulation and soundproofing. The polyurethane type dominates the market due to its versatility and wide range of applications. Geographically, North America and Europe are the leading markets, driven by strong construction activity and demand for advanced materials.
- Dominant Application Segment: Construction (XX% market share).
- Dominant Type Segment: Polyurethane (XX% market share).
- Key Regional Markets: North America and Europe.
Drivers for Construction Segment Dominance:
- Rapid urbanization and infrastructure development.
- Stringent building codes and energy efficiency regulations.
- Increasing demand for energy-efficient buildings.
Dominance Analysis: The construction sector's dominance stems from the versatile application of flexible foams in insulation, cushioning, and acoustic dampening within buildings. This demand is further reinforced by the increasing focus on energy efficiency and sustainable building practices. Polyurethane's dominance is attributable to its cost-effectiveness, versatility, and ease of processing. North America and Europe lead due to robust construction activity and the high adoption rate of advanced building materials.
Flexible Foam Industry Product Developments
Recent innovations in flexible foam technology focus on developing sustainable, high-performance materials. Manufacturers are incorporating bio-based raw materials and exploring recycling techniques to reduce environmental impact. Advancements in foam formulation are leading to improved fire resistance, thermal insulation, and acoustic properties. These technological advancements are enabling flexible foams to meet the demanding requirements of various industries and applications, strengthening their competitive edge.
Challenges in the Flexible Foam Industry Market
The flexible foam industry faces challenges related to raw material price volatility, fluctuating energy costs, and stringent environmental regulations. Supply chain disruptions can significantly impact production and profitability. Intense competition from both established players and emerging manufacturers exerts pressure on pricing and margins. These factors necessitate efficient cost management, sustainable sourcing practices, and continuous innovation to maintain competitiveness.
Forces Driving Flexible Foam Industry Growth
Several factors contribute to the flexible foam industry's growth. Technological advancements lead to superior product performance, driving demand. Growing urbanization and infrastructure development fuel demand from the construction sector. Increasing consumer awareness of sustainability is stimulating the development of eco-friendly foams. Favorable government policies supporting energy efficiency and sustainable building practices further contribute to market expansion.
Long-Term Growth Catalysts in the Flexible Foam Industry
Long-term growth is propelled by continuous innovation in material science and manufacturing processes. Strategic partnerships and collaborations amongst manufacturers and technology providers accelerate innovation. The expansion into new markets, particularly in developing economies with rapidly growing construction sectors, presents significant opportunities. The focus on sustainable and circular economy practices also fosters growth.
Emerging Opportunities in Flexible Foam Industry
Emerging opportunities lie in developing high-performance foams for specialized applications such as aerospace and medical devices. The use of recycled and bio-based materials opens new avenues for sustainable products. Expanding into new geographical markets, particularly developing countries experiencing rapid infrastructure development, offers substantial growth potential. Focusing on niche applications and tailoring products to specific customer needs will also unlock market opportunities.
Leading Players in the Flexible Foam Industry Sector
- Carpenter Co
- ORSA foam SpA
- Wm T Burnett & Co
- Recticel NV/SA
- KANEKA CORPORATION
- Rogers Corporation
- BASF SE
- Huntsman International LLC
- Dow
- Inoac Corporation
- Woodbridge
- Greiner AG
- SEKISUI CHEMICAL CO LTD
- Sheela Foam Ltd
- American Excelsior Company
- Covestro AG
- Changzhou Xingang Plastic Products Co Ltd
Key Milestones in Flexible Foam Industry Industry
- March 2022: Carpenter Co. acquired the assets of Recticel N.V.'s Engineered Foams Division, creating the world's largest vertically integrated manufacturer of polyurethane foams and specialty polymer products. This significantly expanded Carpenter's global reach and market share.
- May 2022: Huntsman International LLC collaborated with BRUGG pipes to develop a next-generation polyurethane foam system for pre-insulated pipes, enhancing energy efficiency in building applications. This collaboration boosted the company's profile in the sustainable building materials market.
- July 2022: William T. Burnett & Co. acquired Flex Foam, expanding its specialty urethane foam production capabilities and market presence in Arizona. This acquisition broadened Burnett's product portfolio and strengthened its competitive position in the Southwest US market.
Strategic Outlook for Flexible Foam Industry Market
The flexible foam industry is poised for continued growth, driven by technological advancements, sustainable solutions, and expanding applications. Strategic opportunities lie in developing innovative products tailored to specific market needs, such as high-performance foams for aerospace and medical applications. Investing in research and development to improve material properties, reduce environmental impact, and enhance product performance will be crucial for success. Expanding into new and emerging markets and forming strategic partnerships to enhance market reach and technological capabilities will also strengthen market positioning.
Flexible Foam Industry Segmentation
-
1. Type
-
1.1. Polyurethane
- 1.1.1. Polyester
- 1.1.2. Polyether
-
1.2. Polyethylene
- 1.2.1. Cross linked
- 1.2.2. Non-cross linked
- 1.3. Polypropylene
-
1.1. Polyurethane
-
2. Application
- 2.1. Construction
- 2.2. Consumer Goods
- 2.3. Furniture
- 2.4. Transportation
- 2.5. Other Applications
Flexible Foam Industry Segmentation By Geography
-
1. Asia Pacific
- 1.1. China
- 1.2. India
- 1.3. Japan
- 1.4. South Korea
- 1.5. Rest of Asia Pacific
-
2. North America
- 2.1. United States
- 2.2. Canada
- 2.3. Mexico
-
3. Europe
- 3.1. Germany
- 3.2. United Kingdom
- 3.3. Italy
- 3.4. France
- 3.5. Rest of Europe
-
4. South America
- 4.1. Brazil
- 4.2. Argentina
- 4.3. Rest of South America
-
5. Middle East and Africa
- 5.1. Saudi Arabia
- 5.2. South Africa
- 5.3. Rest of Middle East and Africa
Flexible Foam Industry REPORT HIGHLIGHTS
| Aspects | Details |
|---|---|
| Study Period | 2019-2033 |
| Base Year | 2024 |
| Estimated Year | 2025 |
| Forecast Period | 2025-2033 |
| Historical Period | 2019-2024 |
| Growth Rate | CAGR of 5.5% from 2019-2033 |
| Segmentation |
|
Table of Contents
- 1. Introduction
- 1.1. Research Scope
- 1.2. Market Segmentation
- 1.3. Research Methodology
- 1.4. Definitions and Assumptions
- 2. Executive Summary
- 2.1. Introduction
- 3. Market Dynamics
- 3.1. Introduction
- 3.2. Market Drivers
- 3.2.1. Growing Demand of Flexible Foam in Packaging; Increasing Demand for Flexible Foam in Carpet Cushion; Other Drivers
- 3.3. Market Restrains
- 3.3.1. Environmental Degradation while Fabrication; Other Restraints
- 3.4. Market Trends
- 3.4.1. Growing Demand for Flexible Foam in Furniture Industry
- 4. Market Factor Analysis
- 4.1. Porters Five Forces
- 4.2. Supply/Value Chain
- 4.3. PESTEL analysis
- 4.4. Market Entropy
- 4.5. Patent/Trademark Analysis
- 5. Global Flexible Foam Industry Analysis, Insights and Forecast, 2019-2031
- 5.1. Market Analysis, Insights and Forecast - by Type
- 5.1.1. Polyurethane
- 5.1.1.1. Polyester
- 5.1.1.2. Polyether
- 5.1.2. Polyethylene
- 5.1.2.1. Cross linked
- 5.1.2.2. Non-cross linked
- 5.1.3. Polypropylene
- 5.1.1. Polyurethane
- 5.2. Market Analysis, Insights and Forecast - by Application
- 5.2.1. Construction
- 5.2.2. Consumer Goods
- 5.2.3. Furniture
- 5.2.4. Transportation
- 5.2.5. Other Applications
- 5.3. Market Analysis, Insights and Forecast - by Region
- 5.3.1. Asia Pacific
- 5.3.2. North America
- 5.3.3. Europe
- 5.3.4. South America
- 5.3.5. Middle East and Africa
- 5.1. Market Analysis, Insights and Forecast - by Type
- 6. Asia Pacific Flexible Foam Industry Analysis, Insights and Forecast, 2019-2031
- 6.1. Market Analysis, Insights and Forecast - by Type
- 6.1.1. Polyurethane
- 6.1.1.1. Polyester
- 6.1.1.2. Polyether
- 6.1.2. Polyethylene
- 6.1.2.1. Cross linked
- 6.1.2.2. Non-cross linked
- 6.1.3. Polypropylene
- 6.1.1. Polyurethane
- 6.2. Market Analysis, Insights and Forecast - by Application
- 6.2.1. Construction
- 6.2.2. Consumer Goods
- 6.2.3. Furniture
- 6.2.4. Transportation
- 6.2.5. Other Applications
- 6.1. Market Analysis, Insights and Forecast - by Type
- 7. North America Flexible Foam Industry Analysis, Insights and Forecast, 2019-2031
- 7.1. Market Analysis, Insights and Forecast - by Type
- 7.1.1. Polyurethane
- 7.1.1.1. Polyester
- 7.1.1.2. Polyether
- 7.1.2. Polyethylene
- 7.1.2.1. Cross linked
- 7.1.2.2. Non-cross linked
- 7.1.3. Polypropylene
- 7.1.1. Polyurethane
- 7.2. Market Analysis, Insights and Forecast - by Application
- 7.2.1. Construction
- 7.2.2. Consumer Goods
- 7.2.3. Furniture
- 7.2.4. Transportation
- 7.2.5. Other Applications
- 7.1. Market Analysis, Insights and Forecast - by Type
- 8. Europe Flexible Foam Industry Analysis, Insights and Forecast, 2019-2031
- 8.1. Market Analysis, Insights and Forecast - by Type
- 8.1.1. Polyurethane
- 8.1.1.1. Polyester
- 8.1.1.2. Polyether
- 8.1.2. Polyethylene
- 8.1.2.1. Cross linked
- 8.1.2.2. Non-cross linked
- 8.1.3. Polypropylene
- 8.1.1. Polyurethane
- 8.2. Market Analysis, Insights and Forecast - by Application
- 8.2.1. Construction
- 8.2.2. Consumer Goods
- 8.2.3. Furniture
- 8.2.4. Transportation
- 8.2.5. Other Applications
- 8.1. Market Analysis, Insights and Forecast - by Type
- 9. South America Flexible Foam Industry Analysis, Insights and Forecast, 2019-2031
- 9.1. Market Analysis, Insights and Forecast - by Type
- 9.1.1. Polyurethane
- 9.1.1.1. Polyester
- 9.1.1.2. Polyether
- 9.1.2. Polyethylene
- 9.1.2.1. Cross linked
- 9.1.2.2. Non-cross linked
- 9.1.3. Polypropylene
- 9.1.1. Polyurethane
- 9.2. Market Analysis, Insights and Forecast - by Application
- 9.2.1. Construction
- 9.2.2. Consumer Goods
- 9.2.3. Furniture
- 9.2.4. Transportation
- 9.2.5. Other Applications
- 9.1. Market Analysis, Insights and Forecast - by Type
- 10. Middle East and Africa Flexible Foam Industry Analysis, Insights and Forecast, 2019-2031
- 10.1. Market Analysis, Insights and Forecast - by Type
- 10.1.1. Polyurethane
- 10.1.1.1. Polyester
- 10.1.1.2. Polyether
- 10.1.2. Polyethylene
- 10.1.2.1. Cross linked
- 10.1.2.2. Non-cross linked
- 10.1.3. Polypropylene
- 10.1.1. Polyurethane
- 10.2. Market Analysis, Insights and Forecast - by Application
- 10.2.1. Construction
- 10.2.2. Consumer Goods
- 10.2.3. Furniture
- 10.2.4. Transportation
- 10.2.5. Other Applications
- 10.1. Market Analysis, Insights and Forecast - by Type
- 11. North America Flexible Foam Industry Analysis, Insights and Forecast, 2019-2031
- 11.1. Market Analysis, Insights and Forecast - By Country/Sub-region
- 11.1.1 United States
- 11.1.2 Canada
- 11.1.3 Mexico
- 12. Europe Flexible Foam Industry Analysis, Insights and Forecast, 2019-2031
- 12.1. Market Analysis, Insights and Forecast - By Country/Sub-region
- 12.1.1 Germany
- 12.1.2 France
- 12.1.3 Italy
- 12.1.4 United Kingdom
- 12.1.5 Netherlands
- 12.1.6 Rest of Europe
- 13. Asia Pacific Flexible Foam Industry Analysis, Insights and Forecast, 2019-2031
- 13.1. Market Analysis, Insights and Forecast - By Country/Sub-region
- 13.1.1 China
- 13.1.2 Japan
- 13.1.3 India
- 13.1.4 South Korea
- 13.1.5 Taiwan
- 13.1.6 Australia
- 13.1.7 Rest of Asia-Pacific
- 14. South America Flexible Foam Industry Analysis, Insights and Forecast, 2019-2031
- 14.1. Market Analysis, Insights and Forecast - By Country/Sub-region
- 14.1.1 Brazil
- 14.1.2 Argentina
- 14.1.3 Rest of South America
- 15. MEA Flexible Foam Industry Analysis, Insights and Forecast, 2019-2031
- 15.1. Market Analysis, Insights and Forecast - By Country/Sub-region
- 15.1.1 Middle East
- 15.1.2 Africa
- 16. Competitive Analysis
- 16.1. Global Market Share Analysis 2024
- 16.2. Company Profiles
- 16.2.1 Carpenter Co
- 16.2.1.1. Overview
- 16.2.1.2. Products
- 16.2.1.3. SWOT Analysis
- 16.2.1.4. Recent Developments
- 16.2.1.5. Financials (Based on Availability)
- 16.2.2 ORSA foam SpA
- 16.2.2.1. Overview
- 16.2.2.2. Products
- 16.2.2.3. SWOT Analysis
- 16.2.2.4. Recent Developments
- 16.2.2.5. Financials (Based on Availability)
- 16.2.3 Wm T Burnett & Co
- 16.2.3.1. Overview
- 16.2.3.2. Products
- 16.2.3.3. SWOT Analysis
- 16.2.3.4. Recent Developments
- 16.2.3.5. Financials (Based on Availability)
- 16.2.4 Recticel NV/SA
- 16.2.4.1. Overview
- 16.2.4.2. Products
- 16.2.4.3. SWOT Analysis
- 16.2.4.4. Recent Developments
- 16.2.4.5. Financials (Based on Availability)
- 16.2.5 KANEKA CORPORATION
- 16.2.5.1. Overview
- 16.2.5.2. Products
- 16.2.5.3. SWOT Analysis
- 16.2.5.4. Recent Developments
- 16.2.5.5. Financials (Based on Availability)
- 16.2.6 Rogers Corporation
- 16.2.6.1. Overview
- 16.2.6.2. Products
- 16.2.6.3. SWOT Analysis
- 16.2.6.4. Recent Developments
- 16.2.6.5. Financials (Based on Availability)
- 16.2.7 BASF SE
- 16.2.7.1. Overview
- 16.2.7.2. Products
- 16.2.7.3. SWOT Analysis
- 16.2.7.4. Recent Developments
- 16.2.7.5. Financials (Based on Availability)
- 16.2.8 Huntsman International LLC
- 16.2.8.1. Overview
- 16.2.8.2. Products
- 16.2.8.3. SWOT Analysis
- 16.2.8.4. Recent Developments
- 16.2.8.5. Financials (Based on Availability)
- 16.2.9 Dow
- 16.2.9.1. Overview
- 16.2.9.2. Products
- 16.2.9.3. SWOT Analysis
- 16.2.9.4. Recent Developments
- 16.2.9.5. Financials (Based on Availability)
- 16.2.10 Inoac Corporation
- 16.2.10.1. Overview
- 16.2.10.2. Products
- 16.2.10.3. SWOT Analysis
- 16.2.10.4. Recent Developments
- 16.2.10.5. Financials (Based on Availability)
- 16.2.11 Woodbridge
- 16.2.11.1. Overview
- 16.2.11.2. Products
- 16.2.11.3. SWOT Analysis
- 16.2.11.4. Recent Developments
- 16.2.11.5. Financials (Based on Availability)
- 16.2.12 Greiner AG
- 16.2.12.1. Overview
- 16.2.12.2. Products
- 16.2.12.3. SWOT Analysis
- 16.2.12.4. Recent Developments
- 16.2.12.5. Financials (Based on Availability)
- 16.2.13 SEKISUI CHEMICAL CO LTD
- 16.2.13.1. Overview
- 16.2.13.2. Products
- 16.2.13.3. SWOT Analysis
- 16.2.13.4. Recent Developments
- 16.2.13.5. Financials (Based on Availability)
- 16.2.14 Sheela Foam Ltd
- 16.2.14.1. Overview
- 16.2.14.2. Products
- 16.2.14.3. SWOT Analysis
- 16.2.14.4. Recent Developments
- 16.2.14.5. Financials (Based on Availability)
- 16.2.15 American Excelsior Company
- 16.2.15.1. Overview
- 16.2.15.2. Products
- 16.2.15.3. SWOT Analysis
- 16.2.15.4. Recent Developments
- 16.2.15.5. Financials (Based on Availability)
- 16.2.16 Covestro AG
- 16.2.16.1. Overview
- 16.2.16.2. Products
- 16.2.16.3. SWOT Analysis
- 16.2.16.4. Recent Developments
- 16.2.16.5. Financials (Based on Availability)
- 16.2.17 Changzhou Xingang Plastic Products Co Ltd
- 16.2.17.1. Overview
- 16.2.17.2. Products
- 16.2.17.3. SWOT Analysis
- 16.2.17.4. Recent Developments
- 16.2.17.5. Financials (Based on Availability)
- 16.2.1 Carpenter Co
List of Figures
- Figure 1: Global Flexible Foam Industry Revenue Breakdown (Billion, %) by Region 2024 & 2032
- Figure 2: Global Flexible Foam Industry Volume Breakdown (K Tons, %) by Region 2024 & 2032
- Figure 3: North America Flexible Foam Industry Revenue (Billion), by Country 2024 & 2032
- Figure 4: North America Flexible Foam Industry Volume (K Tons), by Country 2024 & 2032
- Figure 5: North America Flexible Foam Industry Revenue Share (%), by Country 2024 & 2032
- Figure 6: North America Flexible Foam Industry Volume Share (%), by Country 2024 & 2032
- Figure 7: Europe Flexible Foam Industry Revenue (Billion), by Country 2024 & 2032
- Figure 8: Europe Flexible Foam Industry Volume (K Tons), by Country 2024 & 2032
- Figure 9: Europe Flexible Foam Industry Revenue Share (%), by Country 2024 & 2032
- Figure 10: Europe Flexible Foam Industry Volume Share (%), by Country 2024 & 2032
- Figure 11: Asia Pacific Flexible Foam Industry Revenue (Billion), by Country 2024 & 2032
- Figure 12: Asia Pacific Flexible Foam Industry Volume (K Tons), by Country 2024 & 2032
- Figure 13: Asia Pacific Flexible Foam Industry Revenue Share (%), by Country 2024 & 2032
- Figure 14: Asia Pacific Flexible Foam Industry Volume Share (%), by Country 2024 & 2032
- Figure 15: South America Flexible Foam Industry Revenue (Billion), by Country 2024 & 2032
- Figure 16: South America Flexible Foam Industry Volume (K Tons), by Country 2024 & 2032
- Figure 17: South America Flexible Foam Industry Revenue Share (%), by Country 2024 & 2032
- Figure 18: South America Flexible Foam Industry Volume Share (%), by Country 2024 & 2032
- Figure 19: MEA Flexible Foam Industry Revenue (Billion), by Country 2024 & 2032
- Figure 20: MEA Flexible Foam Industry Volume (K Tons), by Country 2024 & 2032
- Figure 21: MEA Flexible Foam Industry Revenue Share (%), by Country 2024 & 2032
- Figure 22: MEA Flexible Foam Industry Volume Share (%), by Country 2024 & 2032
- Figure 23: Asia Pacific Flexible Foam Industry Revenue (Billion), by Type 2024 & 2032
- Figure 24: Asia Pacific Flexible Foam Industry Volume (K Tons), by Type 2024 & 2032
- Figure 25: Asia Pacific Flexible Foam Industry Revenue Share (%), by Type 2024 & 2032
- Figure 26: Asia Pacific Flexible Foam Industry Volume Share (%), by Type 2024 & 2032
- Figure 27: Asia Pacific Flexible Foam Industry Revenue (Billion), by Application 2024 & 2032
- Figure 28: Asia Pacific Flexible Foam Industry Volume (K Tons), by Application 2024 & 2032
- Figure 29: Asia Pacific Flexible Foam Industry Revenue Share (%), by Application 2024 & 2032
- Figure 30: Asia Pacific Flexible Foam Industry Volume Share (%), by Application 2024 & 2032
- Figure 31: Asia Pacific Flexible Foam Industry Revenue (Billion), by Country 2024 & 2032
- Figure 32: Asia Pacific Flexible Foam Industry Volume (K Tons), by Country 2024 & 2032
- Figure 33: Asia Pacific Flexible Foam Industry Revenue Share (%), by Country 2024 & 2032
- Figure 34: Asia Pacific Flexible Foam Industry Volume Share (%), by Country 2024 & 2032
- Figure 35: North America Flexible Foam Industry Revenue (Billion), by Type 2024 & 2032
- Figure 36: North America Flexible Foam Industry Volume (K Tons), by Type 2024 & 2032
- Figure 37: North America Flexible Foam Industry Revenue Share (%), by Type 2024 & 2032
- Figure 38: North America Flexible Foam Industry Volume Share (%), by Type 2024 & 2032
- Figure 39: North America Flexible Foam Industry Revenue (Billion), by Application 2024 & 2032
- Figure 40: North America Flexible Foam Industry Volume (K Tons), by Application 2024 & 2032
- Figure 41: North America Flexible Foam Industry Revenue Share (%), by Application 2024 & 2032
- Figure 42: North America Flexible Foam Industry Volume Share (%), by Application 2024 & 2032
- Figure 43: North America Flexible Foam Industry Revenue (Billion), by Country 2024 & 2032
- Figure 44: North America Flexible Foam Industry Volume (K Tons), by Country 2024 & 2032
- Figure 45: North America Flexible Foam Industry Revenue Share (%), by Country 2024 & 2032
- Figure 46: North America Flexible Foam Industry Volume Share (%), by Country 2024 & 2032
- Figure 47: Europe Flexible Foam Industry Revenue (Billion), by Type 2024 & 2032
- Figure 48: Europe Flexible Foam Industry Volume (K Tons), by Type 2024 & 2032
- Figure 49: Europe Flexible Foam Industry Revenue Share (%), by Type 2024 & 2032
- Figure 50: Europe Flexible Foam Industry Volume Share (%), by Type 2024 & 2032
- Figure 51: Europe Flexible Foam Industry Revenue (Billion), by Application 2024 & 2032
- Figure 52: Europe Flexible Foam Industry Volume (K Tons), by Application 2024 & 2032
- Figure 53: Europe Flexible Foam Industry Revenue Share (%), by Application 2024 & 2032
- Figure 54: Europe Flexible Foam Industry Volume Share (%), by Application 2024 & 2032
- Figure 55: Europe Flexible Foam Industry Revenue (Billion), by Country 2024 & 2032
- Figure 56: Europe Flexible Foam Industry Volume (K Tons), by Country 2024 & 2032
- Figure 57: Europe Flexible Foam Industry Revenue Share (%), by Country 2024 & 2032
- Figure 58: Europe Flexible Foam Industry Volume Share (%), by Country 2024 & 2032
- Figure 59: South America Flexible Foam Industry Revenue (Billion), by Type 2024 & 2032
- Figure 60: South America Flexible Foam Industry Volume (K Tons), by Type 2024 & 2032
- Figure 61: South America Flexible Foam Industry Revenue Share (%), by Type 2024 & 2032
- Figure 62: South America Flexible Foam Industry Volume Share (%), by Type 2024 & 2032
- Figure 63: South America Flexible Foam Industry Revenue (Billion), by Application 2024 & 2032
- Figure 64: South America Flexible Foam Industry Volume (K Tons), by Application 2024 & 2032
- Figure 65: South America Flexible Foam Industry Revenue Share (%), by Application 2024 & 2032
- Figure 66: South America Flexible Foam Industry Volume Share (%), by Application 2024 & 2032
- Figure 67: South America Flexible Foam Industry Revenue (Billion), by Country 2024 & 2032
- Figure 68: South America Flexible Foam Industry Volume (K Tons), by Country 2024 & 2032
- Figure 69: South America Flexible Foam Industry Revenue Share (%), by Country 2024 & 2032
- Figure 70: South America Flexible Foam Industry Volume Share (%), by Country 2024 & 2032
- Figure 71: Middle East and Africa Flexible Foam Industry Revenue (Billion), by Type 2024 & 2032
- Figure 72: Middle East and Africa Flexible Foam Industry Volume (K Tons), by Type 2024 & 2032
- Figure 73: Middle East and Africa Flexible Foam Industry Revenue Share (%), by Type 2024 & 2032
- Figure 74: Middle East and Africa Flexible Foam Industry Volume Share (%), by Type 2024 & 2032
- Figure 75: Middle East and Africa Flexible Foam Industry Revenue (Billion), by Application 2024 & 2032
- Figure 76: Middle East and Africa Flexible Foam Industry Volume (K Tons), by Application 2024 & 2032
- Figure 77: Middle East and Africa Flexible Foam Industry Revenue Share (%), by Application 2024 & 2032
- Figure 78: Middle East and Africa Flexible Foam Industry Volume Share (%), by Application 2024 & 2032
- Figure 79: Middle East and Africa Flexible Foam Industry Revenue (Billion), by Country 2024 & 2032
- Figure 80: Middle East and Africa Flexible Foam Industry Volume (K Tons), by Country 2024 & 2032
- Figure 81: Middle East and Africa Flexible Foam Industry Revenue Share (%), by Country 2024 & 2032
- Figure 82: Middle East and Africa Flexible Foam Industry Volume Share (%), by Country 2024 & 2032
List of Tables
- Table 1: Global Flexible Foam Industry Revenue Billion Forecast, by Region 2019 & 2032
- Table 2: Global Flexible Foam Industry Volume K Tons Forecast, by Region 2019 & 2032
- Table 3: Global Flexible Foam Industry Revenue Billion Forecast, by Type 2019 & 2032
- Table 4: Global Flexible Foam Industry Volume K Tons Forecast, by Type 2019 & 2032
- Table 5: Global Flexible Foam Industry Revenue Billion Forecast, by Application 2019 & 2032
- Table 6: Global Flexible Foam Industry Volume K Tons Forecast, by Application 2019 & 2032
- Table 7: Global Flexible Foam Industry Revenue Billion Forecast, by Region 2019 & 2032
- Table 8: Global Flexible Foam Industry Volume K Tons Forecast, by Region 2019 & 2032
- Table 9: Global Flexible Foam Industry Revenue Billion Forecast, by Country 2019 & 2032
- Table 10: Global Flexible Foam Industry Volume K Tons Forecast, by Country 2019 & 2032
- Table 11: United States Flexible Foam Industry Revenue (Billion) Forecast, by Application 2019 & 2032
- Table 12: United States Flexible Foam Industry Volume (K Tons) Forecast, by Application 2019 & 2032
- Table 13: Canada Flexible Foam Industry Revenue (Billion) Forecast, by Application 2019 & 2032
- Table 14: Canada Flexible Foam Industry Volume (K Tons) Forecast, by Application 2019 & 2032
- Table 15: Mexico Flexible Foam Industry Revenue (Billion) Forecast, by Application 2019 & 2032
- Table 16: Mexico Flexible Foam Industry Volume (K Tons) Forecast, by Application 2019 & 2032
- Table 17: Global Flexible Foam Industry Revenue Billion Forecast, by Country 2019 & 2032
- Table 18: Global Flexible Foam Industry Volume K Tons Forecast, by Country 2019 & 2032
- Table 19: Germany Flexible Foam Industry Revenue (Billion) Forecast, by Application 2019 & 2032
- Table 20: Germany Flexible Foam Industry Volume (K Tons) Forecast, by Application 2019 & 2032
- Table 21: France Flexible Foam Industry Revenue (Billion) Forecast, by Application 2019 & 2032
- Table 22: France Flexible Foam Industry Volume (K Tons) Forecast, by Application 2019 & 2032
- Table 23: Italy Flexible Foam Industry Revenue (Billion) Forecast, by Application 2019 & 2032
- Table 24: Italy Flexible Foam Industry Volume (K Tons) Forecast, by Application 2019 & 2032
- Table 25: United Kingdom Flexible Foam Industry Revenue (Billion) Forecast, by Application 2019 & 2032
- Table 26: United Kingdom Flexible Foam Industry Volume (K Tons) Forecast, by Application 2019 & 2032
- Table 27: Netherlands Flexible Foam Industry Revenue (Billion) Forecast, by Application 2019 & 2032
- Table 28: Netherlands Flexible Foam Industry Volume (K Tons) Forecast, by Application 2019 & 2032
- Table 29: Rest of Europe Flexible Foam Industry Revenue (Billion) Forecast, by Application 2019 & 2032
- Table 30: Rest of Europe Flexible Foam Industry Volume (K Tons) Forecast, by Application 2019 & 2032
- Table 31: Global Flexible Foam Industry Revenue Billion Forecast, by Country 2019 & 2032
- Table 32: Global Flexible Foam Industry Volume K Tons Forecast, by Country 2019 & 2032
- Table 33: China Flexible Foam Industry Revenue (Billion) Forecast, by Application 2019 & 2032
- Table 34: China Flexible Foam Industry Volume (K Tons) Forecast, by Application 2019 & 2032
- Table 35: Japan Flexible Foam Industry Revenue (Billion) Forecast, by Application 2019 & 2032
- Table 36: Japan Flexible Foam Industry Volume (K Tons) Forecast, by Application 2019 & 2032
- Table 37: India Flexible Foam Industry Revenue (Billion) Forecast, by Application 2019 & 2032
- Table 38: India Flexible Foam Industry Volume (K Tons) Forecast, by Application 2019 & 2032
- Table 39: South Korea Flexible Foam Industry Revenue (Billion) Forecast, by Application 2019 & 2032
- Table 40: South Korea Flexible Foam Industry Volume (K Tons) Forecast, by Application 2019 & 2032
- Table 41: Taiwan Flexible Foam Industry Revenue (Billion) Forecast, by Application 2019 & 2032
- Table 42: Taiwan Flexible Foam Industry Volume (K Tons) Forecast, by Application 2019 & 2032
- Table 43: Australia Flexible Foam Industry Revenue (Billion) Forecast, by Application 2019 & 2032
- Table 44: Australia Flexible Foam Industry Volume (K Tons) Forecast, by Application 2019 & 2032
- Table 45: Rest of Asia-Pacific Flexible Foam Industry Revenue (Billion) Forecast, by Application 2019 & 2032
- Table 46: Rest of Asia-Pacific Flexible Foam Industry Volume (K Tons) Forecast, by Application 2019 & 2032
- Table 47: Global Flexible Foam Industry Revenue Billion Forecast, by Country 2019 & 2032
- Table 48: Global Flexible Foam Industry Volume K Tons Forecast, by Country 2019 & 2032
- Table 49: Brazil Flexible Foam Industry Revenue (Billion) Forecast, by Application 2019 & 2032
- Table 50: Brazil Flexible Foam Industry Volume (K Tons) Forecast, by Application 2019 & 2032
- Table 51: Argentina Flexible Foam Industry Revenue (Billion) Forecast, by Application 2019 & 2032
- Table 52: Argentina Flexible Foam Industry Volume (K Tons) Forecast, by Application 2019 & 2032
- Table 53: Rest of South America Flexible Foam Industry Revenue (Billion) Forecast, by Application 2019 & 2032
- Table 54: Rest of South America Flexible Foam Industry Volume (K Tons) Forecast, by Application 2019 & 2032
- Table 55: Global Flexible Foam Industry Revenue Billion Forecast, by Country 2019 & 2032
- Table 56: Global Flexible Foam Industry Volume K Tons Forecast, by Country 2019 & 2032
- Table 57: Middle East Flexible Foam Industry Revenue (Billion) Forecast, by Application 2019 & 2032
- Table 58: Middle East Flexible Foam Industry Volume (K Tons) Forecast, by Application 2019 & 2032
- Table 59: Africa Flexible Foam Industry Revenue (Billion) Forecast, by Application 2019 & 2032
- Table 60: Africa Flexible Foam Industry Volume (K Tons) Forecast, by Application 2019 & 2032
- Table 61: Global Flexible Foam Industry Revenue Billion Forecast, by Type 2019 & 2032
- Table 62: Global Flexible Foam Industry Volume K Tons Forecast, by Type 2019 & 2032
- Table 63: Global Flexible Foam Industry Revenue Billion Forecast, by Application 2019 & 2032
- Table 64: Global Flexible Foam Industry Volume K Tons Forecast, by Application 2019 & 2032
- Table 65: Global Flexible Foam Industry Revenue Billion Forecast, by Country 2019 & 2032
- Table 66: Global Flexible Foam Industry Volume K Tons Forecast, by Country 2019 & 2032
- Table 67: China Flexible Foam Industry Revenue (Billion) Forecast, by Application 2019 & 2032
- Table 68: China Flexible Foam Industry Volume (K Tons) Forecast, by Application 2019 & 2032
- Table 69: India Flexible Foam Industry Revenue (Billion) Forecast, by Application 2019 & 2032
- Table 70: India Flexible Foam Industry Volume (K Tons) Forecast, by Application 2019 & 2032
- Table 71: Japan Flexible Foam Industry Revenue (Billion) Forecast, by Application 2019 & 2032
- Table 72: Japan Flexible Foam Industry Volume (K Tons) Forecast, by Application 2019 & 2032
- Table 73: South Korea Flexible Foam Industry Revenue (Billion) Forecast, by Application 2019 & 2032
- Table 74: South Korea Flexible Foam Industry Volume (K Tons) Forecast, by Application 2019 & 2032
- Table 75: Rest of Asia Pacific Flexible Foam Industry Revenue (Billion) Forecast, by Application 2019 & 2032
- Table 76: Rest of Asia Pacific Flexible Foam Industry Volume (K Tons) Forecast, by Application 2019 & 2032
- Table 77: Global Flexible Foam Industry Revenue Billion Forecast, by Type 2019 & 2032
- Table 78: Global Flexible Foam Industry Volume K Tons Forecast, by Type 2019 & 2032
- Table 79: Global Flexible Foam Industry Revenue Billion Forecast, by Application 2019 & 2032
- Table 80: Global Flexible Foam Industry Volume K Tons Forecast, by Application 2019 & 2032
- Table 81: Global Flexible Foam Industry Revenue Billion Forecast, by Country 2019 & 2032
- Table 82: Global Flexible Foam Industry Volume K Tons Forecast, by Country 2019 & 2032
- Table 83: United States Flexible Foam Industry Revenue (Billion) Forecast, by Application 2019 & 2032
- Table 84: United States Flexible Foam Industry Volume (K Tons) Forecast, by Application 2019 & 2032
- Table 85: Canada Flexible Foam Industry Revenue (Billion) Forecast, by Application 2019 & 2032
- Table 86: Canada Flexible Foam Industry Volume (K Tons) Forecast, by Application 2019 & 2032
- Table 87: Mexico Flexible Foam Industry Revenue (Billion) Forecast, by Application 2019 & 2032
- Table 88: Mexico Flexible Foam Industry Volume (K Tons) Forecast, by Application 2019 & 2032
- Table 89: Global Flexible Foam Industry Revenue Billion Forecast, by Type 2019 & 2032
- Table 90: Global Flexible Foam Industry Volume K Tons Forecast, by Type 2019 & 2032
- Table 91: Global Flexible Foam Industry Revenue Billion Forecast, by Application 2019 & 2032
- Table 92: Global Flexible Foam Industry Volume K Tons Forecast, by Application 2019 & 2032
- Table 93: Global Flexible Foam Industry Revenue Billion Forecast, by Country 2019 & 2032
- Table 94: Global Flexible Foam Industry Volume K Tons Forecast, by Country 2019 & 2032
- Table 95: Germany Flexible Foam Industry Revenue (Billion) Forecast, by Application 2019 & 2032
- Table 96: Germany Flexible Foam Industry Volume (K Tons) Forecast, by Application 2019 & 2032
- Table 97: United Kingdom Flexible Foam Industry Revenue (Billion) Forecast, by Application 2019 & 2032
- Table 98: United Kingdom Flexible Foam Industry Volume (K Tons) Forecast, by Application 2019 & 2032
- Table 99: Italy Flexible Foam Industry Revenue (Billion) Forecast, by Application 2019 & 2032
- Table 100: Italy Flexible Foam Industry Volume (K Tons) Forecast, by Application 2019 & 2032
- Table 101: France Flexible Foam Industry Revenue (Billion) Forecast, by Application 2019 & 2032
- Table 102: France Flexible Foam Industry Volume (K Tons) Forecast, by Application 2019 & 2032
- Table 103: Rest of Europe Flexible Foam Industry Revenue (Billion) Forecast, by Application 2019 & 2032
- Table 104: Rest of Europe Flexible Foam Industry Volume (K Tons) Forecast, by Application 2019 & 2032
- Table 105: Global Flexible Foam Industry Revenue Billion Forecast, by Type 2019 & 2032
- Table 106: Global Flexible Foam Industry Volume K Tons Forecast, by Type 2019 & 2032
- Table 107: Global Flexible Foam Industry Revenue Billion Forecast, by Application 2019 & 2032
- Table 108: Global Flexible Foam Industry Volume K Tons Forecast, by Application 2019 & 2032
- Table 109: Global Flexible Foam Industry Revenue Billion Forecast, by Country 2019 & 2032
- Table 110: Global Flexible Foam Industry Volume K Tons Forecast, by Country 2019 & 2032
- Table 111: Brazil Flexible Foam Industry Revenue (Billion) Forecast, by Application 2019 & 2032
- Table 112: Brazil Flexible Foam Industry Volume (K Tons) Forecast, by Application 2019 & 2032
- Table 113: Argentina Flexible Foam Industry Revenue (Billion) Forecast, by Application 2019 & 2032
- Table 114: Argentina Flexible Foam Industry Volume (K Tons) Forecast, by Application 2019 & 2032
- Table 115: Rest of South America Flexible Foam Industry Revenue (Billion) Forecast, by Application 2019 & 2032
- Table 116: Rest of South America Flexible Foam Industry Volume (K Tons) Forecast, by Application 2019 & 2032
- Table 117: Global Flexible Foam Industry Revenue Billion Forecast, by Type 2019 & 2032
- Table 118: Global Flexible Foam Industry Volume K Tons Forecast, by Type 2019 & 2032
- Table 119: Global Flexible Foam Industry Revenue Billion Forecast, by Application 2019 & 2032
- Table 120: Global Flexible Foam Industry Volume K Tons Forecast, by Application 2019 & 2032
- Table 121: Global Flexible Foam Industry Revenue Billion Forecast, by Country 2019 & 2032
- Table 122: Global Flexible Foam Industry Volume K Tons Forecast, by Country 2019 & 2032
- Table 123: Saudi Arabia Flexible Foam Industry Revenue (Billion) Forecast, by Application 2019 & 2032
- Table 124: Saudi Arabia Flexible Foam Industry Volume (K Tons) Forecast, by Application 2019 & 2032
- Table 125: South Africa Flexible Foam Industry Revenue (Billion) Forecast, by Application 2019 & 2032
- Table 126: South Africa Flexible Foam Industry Volume (K Tons) Forecast, by Application 2019 & 2032
- Table 127: Rest of Middle East and Africa Flexible Foam Industry Revenue (Billion) Forecast, by Application 2019 & 2032
- Table 128: Rest of Middle East and Africa Flexible Foam Industry Volume (K Tons) Forecast, by Application 2019 & 2032
Frequently Asked Questions
1. What is the projected Compound Annual Growth Rate (CAGR) of the Flexible Foam Industry?
The projected CAGR is approximately 5.5%.
2. Which companies are prominent players in the Flexible Foam Industry?
Key companies in the market include Carpenter Co, ORSA foam SpA, Wm T Burnett & Co, Recticel NV/SA, KANEKA CORPORATION, Rogers Corporation, BASF SE, Huntsman International LLC, Dow, Inoac Corporation, Woodbridge, Greiner AG, SEKISUI CHEMICAL CO LTD, Sheela Foam Ltd, American Excelsior Company, Covestro AG, Changzhou Xingang Plastic Products Co Ltd.
3. What are the main segments of the Flexible Foam Industry?
The market segments include Type, Application.
4. Can you provide details about the market size?
The market size is estimated to be USD 41.4 Billion as of 2022.
5. What are some drivers contributing to market growth?
Growing Demand of Flexible Foam in Packaging; Increasing Demand for Flexible Foam in Carpet Cushion; Other Drivers.
6. What are the notable trends driving market growth?
Growing Demand for Flexible Foam in Furniture Industry.
7. Are there any restraints impacting market growth?
Environmental Degradation while Fabrication; Other Restraints.
8. Can you provide examples of recent developments in the market?
July 2022: William T. Burnett & Co. acquired Flex Foam, the first polyurethane foam manufacturer in Arizona, which will help them in growing Flex Foam's existing business and also in expanding their own ability to produce specialty urethane foams in Phoenix that would meet exacting technical specifications for use in a wide range of industries.
9. What pricing options are available for accessing the report?
Pricing options include single-user, multi-user, and enterprise licenses priced at USD 4750, USD 5250, and USD 8750 respectively.
10. Is the market size provided in terms of value or volume?
The market size is provided in terms of value, measured in Billion and volume, measured in K Tons.
11. Are there any specific market keywords associated with the report?
Yes, the market keyword associated with the report is "Flexible Foam Industry," which aids in identifying and referencing the specific market segment covered.
12. How do I determine which pricing option suits my needs best?
The pricing options vary based on user requirements and access needs. Individual users may opt for single-user licenses, while businesses requiring broader access may choose multi-user or enterprise licenses for cost-effective access to the report.
13. Are there any additional resources or data provided in the Flexible Foam Industry report?
While the report offers comprehensive insights, it's advisable to review the specific contents or supplementary materials provided to ascertain if additional resources or data are available.
14. How can I stay updated on further developments or reports in the Flexible Foam Industry?
To stay informed about further developments, trends, and reports in the Flexible Foam Industry, consider subscribing to industry newsletters, following relevant companies and organizations, or regularly checking reputable industry news sources and publications.
Methodology
Step 1 - Identification of Relevant Samples Size from Population Database


Step 2 - Approaches for Defining Global Market Size (Value, Volume* & Price*)

Note*: In applicable scenarios
Step 3 - Data Sources
Primary Research
- Web Analytics
- Survey Reports
- Research Institute
- Latest Research Reports
- Opinion Leaders
Secondary Research
- Annual Reports
- White Paper
- Latest Press Release
- Industry Association
- Paid Database
- Investor Presentations

Step 4 - Data Triangulation
Involves using different sources of information in order to increase the validity of a study
These sources are likely to be stakeholders in a program - participants, other researchers, program staff, other community members, and so on.
Then we put all data in single framework & apply various statistical tools to find out the dynamic on the market.
During the analysis stage, feedback from the stakeholder groups would be compared to determine areas of agreement as well as areas of divergence
