

Key Insights
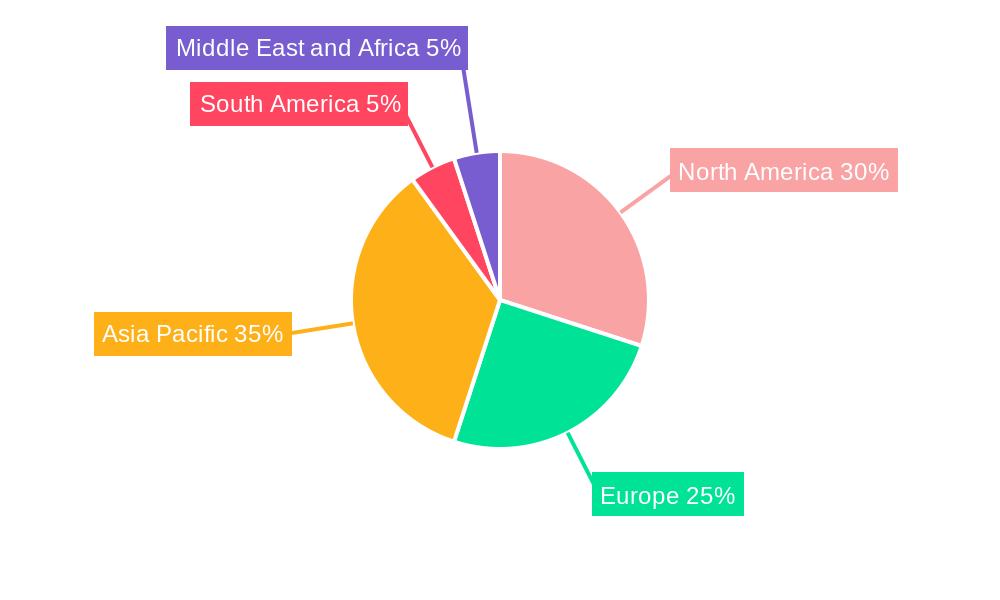
The global Petroleum Refining & Chemicals Catalysts market is poised for substantial growth, propelled by escalating demand for refined petroleum products and the expanding chemical industry. With a projected Compound Annual Growth Rate (CAGR) of 4.3%, the market is forecast to reach 10096.57 million by 2025. Key market segments include petroleum refining, chemical synthesis (isomerization), and synthesis gas processes (polymerization). The market encompasses diverse material categories such as metals and organometallic catalysts, aluminosilicates, molecular sieves, and other specialized chemical compounds. Leading companies, including Chevron Phillips Chemical Company, Honeywell International Inc., and ExxonMobil Corporation, are instrumental in shaping the competitive landscape through continuous innovation and strategic alliances. Asia Pacific dominates the market, driven by rapid industrialization in China and India, while North America and Europe represent significant established markets. Future growth will be influenced by stringent environmental regulations, advancements in catalyst technology for enhanced efficiency and sustainability, and shifts in the energy sector.
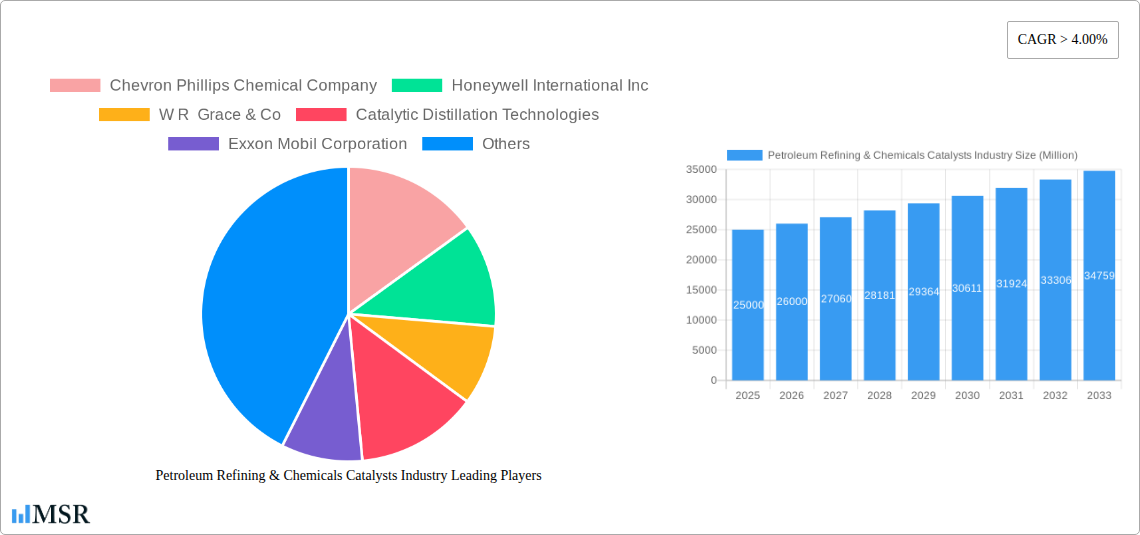
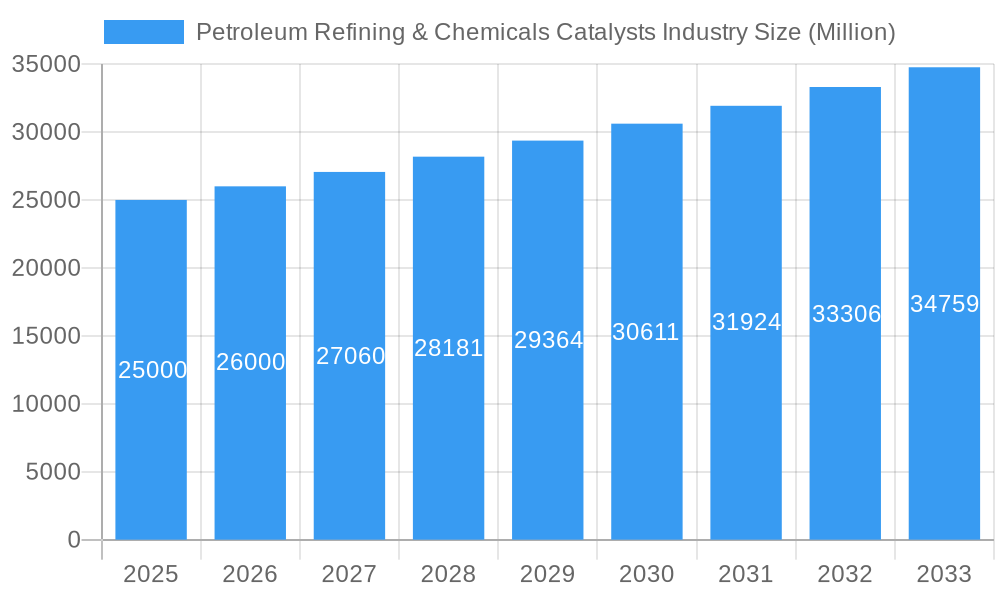
Petroleum Refining & Chemicals Catalysts Industry Market Size (In Billion)
The forecast period (2025-2033) indicates sustained market expansion. Growth drivers include government incentives for cleaner energy technologies, particularly in renewable fuel production, ongoing investments in refinery modernization, and rising demand for high-value specialty chemicals. Challenges include raw material price volatility, potential supply chain disruptions, and the emergence of alternative technologies that may reduce dependence on traditional catalysts. Despite these challenges, the outlook for the Petroleum Refining & Chemicals Catalysts market remains highly positive, offering significant opportunities for established and emerging players.
Petroleum Refining & Chemicals Catalysts Industry Company Market Share
Petroleum Refining & Chemicals Catalysts Industry: A Comprehensive Market Report (2019-2033)
This comprehensive report provides an in-depth analysis of the Petroleum Refining & Chemicals Catalysts industry, offering invaluable insights for stakeholders seeking to navigate this dynamic market. Covering the period from 2019 to 2033, with a focus on the base year 2025 and forecast period 2025-2033, this report unveils market trends, key players, and future opportunities. The global market size in 2025 is estimated at $XX Million, projected to reach $XX Million by 2033, exhibiting a CAGR of XX%.
Petroleum Refining & Chemicals Catalysts Industry Market Concentration & Dynamics
The Petroleum Refining & Chemicals Catalysts market is moderately concentrated, with several major players holding significant market share. Key players like Chevron Phillips Chemical Company, Honeywell International Inc, and W R Grace & Co dominate the landscape. However, smaller, specialized companies also contribute significantly to innovation and niche applications. Market share dynamics are influenced by factors such as technological advancements, M&A activities, and regulatory changes.
- Market Concentration: The Herfindahl-Hirschman Index (HHI) is estimated to be around XX, indicating a moderately concentrated market.
- Innovation Ecosystems: Significant investment in R&D by leading players drives innovation, focusing on enhancing catalyst efficiency, selectivity, and lifespan. Collaboration between catalyst manufacturers and end-users is also prevalent.
- Regulatory Frameworks: Environmental regulations, particularly regarding emissions and waste management, significantly influence catalyst development and adoption. Stringent safety standards also shape industry practices.
- Substitute Products: While direct substitutes are limited, the industry faces indirect competition from alternative process technologies and approaches to chemical synthesis.
- End-User Trends: The increasing demand for cleaner fuels and the rising adoption of sustainable chemical production processes are driving demand for high-performance catalysts.
- M&A Activities: The industry witnessed XX M&A deals between 2019 and 2024, driven by strategies to expand market reach, acquire technological expertise, and consolidate market share.
Petroleum Refining & Chemicals Catalysts Industry Industry Insights & Trends
The Petroleum Refining & Chemicals Catalysts market is experiencing robust growth, driven by several factors. The global expansion of the petrochemical industry, coupled with increasing demand for high-quality fuels and chemicals, is a primary driver. Technological advancements, particularly in catalyst design and synthesis, are leading to the development of more efficient and selective catalysts, further fueling market expansion. Growing environmental concerns are also driving the demand for catalysts that minimize emissions and improve sustainability.
Technological disruptions such as the application of artificial intelligence (AI) and machine learning (ML) in catalyst design and process optimization are transforming industry practices. Furthermore, the evolving consumer behavior towards environmentally friendly products and processes is encouraging the development and adoption of green catalysts. The market size is expected to experience significant growth, with a projected value of $XX Million by 2033.
Key Markets & Segments Leading Petroleum Refining & Chemicals Catalysts Industry
The Asia-Pacific region holds a dominant position in the Petroleum Refining & Chemicals Catalysts market, primarily driven by the rapid industrialization and economic growth in countries like China and India. North America and Europe also represent significant markets.
- Application: Petroleum Refining holds the largest market share, driven by the ever-increasing global demand for refined petroleum products.
- Isomerization: The chemical synthesis segment is witnessing growth due to its vital role in the production of high-octane gasoline components and specialty chemicals.
- Synthesis Gas Processes: Polymerization, crucial for producing plastics and other polymers, shows increasing demand due to continued growth in the polymers market.
- Material: Metals and Organometallic Catalysts dominate the material segment due to their high efficiency and adaptability in various chemical processes.
- Metallic Compounds: Aluminosilicates are widely used in refining and petrochemical applications, underpinning their significant market share.
- Molecular Sieves: Chemical Compounds, specifically molecular sieves, are essential for various separation and purification processes, showing consistent demand.
- Other Chemical Compounds: This segment exhibits growth driven by the continuous development of novel catalysts for specific applications.
Drivers for Dominant Regions/Segments:
- Asia-Pacific: Rapid industrialization, increasing petrochemical production, and supportive government policies.
- Petroleum Refining: Rising global energy demand and the need for cleaner fuels.
- Metals and Organometallic Catalysts: Superior catalytic activity and adaptability.
Petroleum Refining & Chemicals Catalysts Industry Product Developments
Recent innovations focus on developing highly efficient, selective, and durable catalysts to improve process yields, reduce waste, and enhance sustainability. Advancements in nanotechnology and materials science are enabling the creation of catalysts with tailored properties for specific applications. These developments provide manufacturers with a significant competitive edge, boosting overall market competitiveness.
Challenges in the Petroleum Refining & Chemicals Catalysts Industry Market
The industry faces challenges such as stringent environmental regulations impacting catalyst design and production costs. Fluctuations in raw material prices pose supply chain risks. Intense competition among established and emerging players leads to price pressure and necessitates continuous innovation. The estimated impact of these challenges on market growth is around XX% during the forecast period.
Forces Driving Petroleum Refining & Chemicals Catalysts Industry Growth
Several factors drive market growth, including increasing demand for high-quality fuels and chemicals, stringent environmental regulations pushing for cleaner technologies, and government support for the development of sustainable chemical processes. Technological advancements in catalyst design and synthesis, coupled with rising investment in R&D, further accelerate market expansion.
Challenges in the Petroleum Refining & Chemicals Catalysts Industry Market
Long-term growth catalysts include strategic partnerships and collaborations among catalyst manufacturers, end-users, and research institutions. The development of next-generation catalysts with enhanced performance characteristics and the expansion into new markets, especially in developing economies, are significant growth drivers.
Emerging Opportunities in Petroleum Refining & Chemicals Catalysts Industry
Emerging opportunities lie in developing catalysts for novel applications, particularly in green chemistry and sustainable chemical processes. The use of artificial intelligence and machine learning in catalyst design and optimization offers substantial scope for innovation. Expansion into emerging markets with growing demand for petroleum products and chemicals also presents significant potential.
Leading Players in the Petroleum Refining & Chemicals Catalysts Industry Sector
- Chevron Phillips Chemical Company
- Honeywell International Inc
- W R Grace & Co
- Catalytic Distillation Technologies
- Exxon Mobil Corporation
- INEOS Technologies
- Johnson Matthey Inc
- Evonik Industries AG
- Wako Chemicals USA Inc
- KBR Inc
- BASF SE
- Eka Chemicals AB
- Zeochem LLC
- Zeolyst International
- Chicago Bridge & Iron Company
- Dow
- Bayer Technology Services
- Nova Chemicals Corp
- Clariant International Ltd
- Eastman Chemical Co
Key Milestones in Petroleum Refining & Chemicals Catalysts Industry Industry
- 2020: Launch of a new generation of hydrocracking catalysts by Company X, significantly improving efficiency.
- 2021: Acquisition of Company Y by Company Z, leading to expanded market reach.
- 2022: Introduction of a novel catalyst for biofuel production by Company A, addressing sustainability concerns.
- 2023: Development of AI-driven catalyst design platform by Company B, accelerating R&D. (Further milestones to be added based on available data)
Strategic Outlook for Petroleum Refining & Chemicals Catalysts Industry Market
The future of the Petroleum Refining & Chemicals Catalysts industry is bright, driven by continuous innovation, technological advancements, and increasing demand for sustainable solutions. Strategic partnerships, investments in R&D, and the development of advanced catalysts for emerging applications will be pivotal for future growth and success. The market offers lucrative opportunities for companies that can adapt to evolving consumer preferences and meet stringent environmental regulations.
Petroleum Refining & Chemicals Catalysts Industry Segmentation
-
1. Material
-
1.1. Metals and Organometallic Catalysts
- 1.1.1. Inexpensive Metals
- 1.1.2. Precious Metals
- 1.1.3. Metallic Compounds
-
1.2. Aluminosilicates
- 1.2.1. Zeolites
- 1.2.2. Molecular Sieves
-
1.3. Chemical Compounds
- 1.3.1. Peroxides
- 1.3.2. Acids
- 1.3.3. Amines
- 1.3.4. Other Chemical Compounds
- 1.4. Other Materials
-
1.1. Metals and Organometallic Catalysts
-
2. Application
-
2.1. Petroleum Refining
- 2.1.1. Fluid Catalytic Cracking (FCC)
- 2.1.2. Hydrocracking
- 2.1.3. Hydrotreating
- 2.1.4. Alkylation
- 2.1.5. Reforming
- 2.1.6. Isomerization
-
2.2. Chemical Synthesis
- 2.2.1. Organic Synthesis
- 2.2.2. Oxidation
- 2.2.3. Hydrogenation
- 2.2.4. Dehydrogenation
- 2.2.5. Synthesis Gas Processes
-
2.3. Polymerization
- 2.3.1. Polyolefins
- 2.3.2. Condensation Polymers
- 2.3.3. Thermosetting Polymers
- 2.3.4. Additional Polymers
-
2.1. Petroleum Refining
Petroleum Refining & Chemicals Catalysts Industry Segmentation By Geography
-
1. Asia Pacific
- 1.1. China
- 1.2. India
- 1.3. Japan
- 1.4. South Korea
- 1.5. ASEAN Countries
- 1.6. Rest of Asia Pacific
-
2. North America
- 2.1. United States
- 2.2. Canada
- 2.3. Mexico
-
3. Europe
- 3.1. Germany
- 3.2. United Kingdom
- 3.3. Italy
- 3.4. France
- 3.5. Rest of Europe
-
4. South America
- 4.1. Brazil
- 4.2. Argentina
- 4.3. Rest of South America
-
5. Middle East and Africa
- 5.1. Saudi Arabia
- 5.2. South Africa
- 5.3. Rest of Middle East and Africa
Petroleum Refining & Chemicals Catalysts Industry Regional Market Share
Geographic Coverage of Petroleum Refining & Chemicals Catalysts Industry
Petroleum Refining & Chemicals Catalysts Industry REPORT HIGHLIGHTS
| Aspects | Details |
|---|---|
| Study Period | 2020-2034 |
| Base Year | 2025 |
| Estimated Year | 2026 |
| Forecast Period | 2026-2034 |
| Historical Period | 2020-2025 |
| Growth Rate | CAGR of 4.3% from 2020-2034 |
| Segmentation |
|
Table of Contents
- 1. Introduction
- 1.1. Research Scope
- 1.2. Market Segmentation
- 1.3. Research Objective
- 1.4. Definitions and Assumptions
- 2. Executive Summary
- 2.1. Market Snapshot
- 3. Market Dynamics
- 3.1. Market Drivers
- 3.2. Market Restrains
- 3.3. Market Trends
- 3.4. Market Opportunities
- 4. Market Factor Analysis
- 4.1. Porters Five Forces
- 4.1.1. Bargaining Power of Suppliers
- 4.1.2. Bargaining Power of Buyers
- 4.1.3. Threat of New Entrants
- 4.1.4. Threat of Substitutes
- 4.1.5. Competitive Rivalry
- 4.2. PESTEL analysis
- 4.3. BCG Analysis
- 4.3.1. Stars (High Growth, High Market Share)
- 4.3.2. Cash Cows (Low Growth, High Market Share)
- 4.3.3. Question Mark (High Growth, Low Market Share)
- 4.3.4. Dogs (Low Growth, Low Market Share)
- 4.4. Ansoff Matrix Analysis
- 4.5. Supply Chain Analysis
- 4.6. Regulatory Landscape
- 4.7. Current Market Potential and Opportunity Assessment (TAM–SAM–SOM Framework)
- 4.8. MSR Analyst Note
- 4.1. Porters Five Forces
- 5. Market Analysis, Insights and Forecast 2021-2033
- 5.1. Market Analysis, Insights and Forecast - by Material
- 5.1.1. Metals and Organometallic Catalysts
- 5.1.1.1. Inexpensive Metals
- 5.1.1.2. Precious Metals
- 5.1.1.3. Metallic Compounds
- 5.1.2. Aluminosilicates
- 5.1.2.1. Zeolites
- 5.1.2.2. Molecular Sieves
- 5.1.3. Chemical Compounds
- 5.1.3.1. Peroxides
- 5.1.3.2. Acids
- 5.1.3.3. Amines
- 5.1.3.4. Other Chemical Compounds
- 5.1.4. Other Materials
- 5.1.1. Metals and Organometallic Catalysts
- 5.2. Market Analysis, Insights and Forecast - by Application
- 5.2.1. Petroleum Refining
- 5.2.1.1. Fluid Catalytic Cracking (FCC)
- 5.2.1.2. Hydrocracking
- 5.2.1.3. Hydrotreating
- 5.2.1.4. Alkylation
- 5.2.1.5. Reforming
- 5.2.1.6. Isomerization
- 5.2.2. Chemical Synthesis
- 5.2.2.1. Organic Synthesis
- 5.2.2.2. Oxidation
- 5.2.2.3. Hydrogenation
- 5.2.2.4. Dehydrogenation
- 5.2.2.5. Synthesis Gas Processes
- 5.2.3. Polymerization
- 5.2.3.1. Polyolefins
- 5.2.3.2. Condensation Polymers
- 5.2.3.3. Thermosetting Polymers
- 5.2.3.4. Additional Polymers
- 5.2.1. Petroleum Refining
- 5.3. Market Analysis, Insights and Forecast - by Region
- 5.3.1. Asia Pacific
- 5.3.2. North America
- 5.3.3. Europe
- 5.3.4. South America
- 5.3.5. Middle East and Africa
- 5.1. Market Analysis, Insights and Forecast - by Material
- 6. Global Petroleum Refining & Chemicals Catalysts Industry Analysis, Insights and Forecast, 2021-2033
- 6.1. Market Analysis, Insights and Forecast - by Material
- 6.1.1. Metals and Organometallic Catalysts
- 6.1.1.1. Inexpensive Metals
- 6.1.1.2. Precious Metals
- 6.1.1.3. Metallic Compounds
- 6.1.2. Aluminosilicates
- 6.1.2.1. Zeolites
- 6.1.2.2. Molecular Sieves
- 6.1.3. Chemical Compounds
- 6.1.3.1. Peroxides
- 6.1.3.2. Acids
- 6.1.3.3. Amines
- 6.1.3.4. Other Chemical Compounds
- 6.1.4. Other Materials
- 6.1.1. Metals and Organometallic Catalysts
- 6.2. Market Analysis, Insights and Forecast - by Application
- 6.2.1. Petroleum Refining
- 6.2.1.1. Fluid Catalytic Cracking (FCC)
- 6.2.1.2. Hydrocracking
- 6.2.1.3. Hydrotreating
- 6.2.1.4. Alkylation
- 6.2.1.5. Reforming
- 6.2.1.6. Isomerization
- 6.2.2. Chemical Synthesis
- 6.2.2.1. Organic Synthesis
- 6.2.2.2. Oxidation
- 6.2.2.3. Hydrogenation
- 6.2.2.4. Dehydrogenation
- 6.2.2.5. Synthesis Gas Processes
- 6.2.3. Polymerization
- 6.2.3.1. Polyolefins
- 6.2.3.2. Condensation Polymers
- 6.2.3.3. Thermosetting Polymers
- 6.2.3.4. Additional Polymers
- 6.2.1. Petroleum Refining
- 6.1. Market Analysis, Insights and Forecast - by Material
- 7. Asia Pacific Petroleum Refining & Chemicals Catalysts Industry Analysis, Insights and Forecast, 2020-2032
- 7.1. Market Analysis, Insights and Forecast - by Material
- 7.1.1. Metals and Organometallic Catalysts
- 7.1.1.1. Inexpensive Metals
- 7.1.1.2. Precious Metals
- 7.1.1.3. Metallic Compounds
- 7.1.2. Aluminosilicates
- 7.1.2.1. Zeolites
- 7.1.2.2. Molecular Sieves
- 7.1.3. Chemical Compounds
- 7.1.3.1. Peroxides
- 7.1.3.2. Acids
- 7.1.3.3. Amines
- 7.1.3.4. Other Chemical Compounds
- 7.1.4. Other Materials
- 7.1.1. Metals and Organometallic Catalysts
- 7.2. Market Analysis, Insights and Forecast - by Application
- 7.2.1. Petroleum Refining
- 7.2.1.1. Fluid Catalytic Cracking (FCC)
- 7.2.1.2. Hydrocracking
- 7.2.1.3. Hydrotreating
- 7.2.1.4. Alkylation
- 7.2.1.5. Reforming
- 7.2.1.6. Isomerization
- 7.2.2. Chemical Synthesis
- 7.2.2.1. Organic Synthesis
- 7.2.2.2. Oxidation
- 7.2.2.3. Hydrogenation
- 7.2.2.4. Dehydrogenation
- 7.2.2.5. Synthesis Gas Processes
- 7.2.3. Polymerization
- 7.2.3.1. Polyolefins
- 7.2.3.2. Condensation Polymers
- 7.2.3.3. Thermosetting Polymers
- 7.2.3.4. Additional Polymers
- 7.2.1. Petroleum Refining
- 7.1. Market Analysis, Insights and Forecast - by Material
- 8. North America Petroleum Refining & Chemicals Catalysts Industry Analysis, Insights and Forecast, 2020-2032
- 8.1. Market Analysis, Insights and Forecast - by Material
- 8.1.1. Metals and Organometallic Catalysts
- 8.1.1.1. Inexpensive Metals
- 8.1.1.2. Precious Metals
- 8.1.1.3. Metallic Compounds
- 8.1.2. Aluminosilicates
- 8.1.2.1. Zeolites
- 8.1.2.2. Molecular Sieves
- 8.1.3. Chemical Compounds
- 8.1.3.1. Peroxides
- 8.1.3.2. Acids
- 8.1.3.3. Amines
- 8.1.3.4. Other Chemical Compounds
- 8.1.4. Other Materials
- 8.1.1. Metals and Organometallic Catalysts
- 8.2. Market Analysis, Insights and Forecast - by Application
- 8.2.1. Petroleum Refining
- 8.2.1.1. Fluid Catalytic Cracking (FCC)
- 8.2.1.2. Hydrocracking
- 8.2.1.3. Hydrotreating
- 8.2.1.4. Alkylation
- 8.2.1.5. Reforming
- 8.2.1.6. Isomerization
- 8.2.2. Chemical Synthesis
- 8.2.2.1. Organic Synthesis
- 8.2.2.2. Oxidation
- 8.2.2.3. Hydrogenation
- 8.2.2.4. Dehydrogenation
- 8.2.2.5. Synthesis Gas Processes
- 8.2.3. Polymerization
- 8.2.3.1. Polyolefins
- 8.2.3.2. Condensation Polymers
- 8.2.3.3. Thermosetting Polymers
- 8.2.3.4. Additional Polymers
- 8.2.1. Petroleum Refining
- 8.1. Market Analysis, Insights and Forecast - by Material
- 9. Europe Petroleum Refining & Chemicals Catalysts Industry Analysis, Insights and Forecast, 2020-2032
- 9.1. Market Analysis, Insights and Forecast - by Material
- 9.1.1. Metals and Organometallic Catalysts
- 9.1.1.1. Inexpensive Metals
- 9.1.1.2. Precious Metals
- 9.1.1.3. Metallic Compounds
- 9.1.2. Aluminosilicates
- 9.1.2.1. Zeolites
- 9.1.2.2. Molecular Sieves
- 9.1.3. Chemical Compounds
- 9.1.3.1. Peroxides
- 9.1.3.2. Acids
- 9.1.3.3. Amines
- 9.1.3.4. Other Chemical Compounds
- 9.1.4. Other Materials
- 9.1.1. Metals and Organometallic Catalysts
- 9.2. Market Analysis, Insights and Forecast - by Application
- 9.2.1. Petroleum Refining
- 9.2.1.1. Fluid Catalytic Cracking (FCC)
- 9.2.1.2. Hydrocracking
- 9.2.1.3. Hydrotreating
- 9.2.1.4. Alkylation
- 9.2.1.5. Reforming
- 9.2.1.6. Isomerization
- 9.2.2. Chemical Synthesis
- 9.2.2.1. Organic Synthesis
- 9.2.2.2. Oxidation
- 9.2.2.3. Hydrogenation
- 9.2.2.4. Dehydrogenation
- 9.2.2.5. Synthesis Gas Processes
- 9.2.3. Polymerization
- 9.2.3.1. Polyolefins
- 9.2.3.2. Condensation Polymers
- 9.2.3.3. Thermosetting Polymers
- 9.2.3.4. Additional Polymers
- 9.2.1. Petroleum Refining
- 9.1. Market Analysis, Insights and Forecast - by Material
- 10. South America Petroleum Refining & Chemicals Catalysts Industry Analysis, Insights and Forecast, 2020-2032
- 10.1. Market Analysis, Insights and Forecast - by Material
- 10.1.1. Metals and Organometallic Catalysts
- 10.1.1.1. Inexpensive Metals
- 10.1.1.2. Precious Metals
- 10.1.1.3. Metallic Compounds
- 10.1.2. Aluminosilicates
- 10.1.2.1. Zeolites
- 10.1.2.2. Molecular Sieves
- 10.1.3. Chemical Compounds
- 10.1.3.1. Peroxides
- 10.1.3.2. Acids
- 10.1.3.3. Amines
- 10.1.3.4. Other Chemical Compounds
- 10.1.4. Other Materials
- 10.1.1. Metals and Organometallic Catalysts
- 10.2. Market Analysis, Insights and Forecast - by Application
- 10.2.1. Petroleum Refining
- 10.2.1.1. Fluid Catalytic Cracking (FCC)
- 10.2.1.2. Hydrocracking
- 10.2.1.3. Hydrotreating
- 10.2.1.4. Alkylation
- 10.2.1.5. Reforming
- 10.2.1.6. Isomerization
- 10.2.2. Chemical Synthesis
- 10.2.2.1. Organic Synthesis
- 10.2.2.2. Oxidation
- 10.2.2.3. Hydrogenation
- 10.2.2.4. Dehydrogenation
- 10.2.2.5. Synthesis Gas Processes
- 10.2.3. Polymerization
- 10.2.3.1. Polyolefins
- 10.2.3.2. Condensation Polymers
- 10.2.3.3. Thermosetting Polymers
- 10.2.3.4. Additional Polymers
- 10.2.1. Petroleum Refining
- 10.1. Market Analysis, Insights and Forecast - by Material
- 11. Middle East and Africa Petroleum Refining & Chemicals Catalysts Industry Analysis, Insights and Forecast, 2020-2032
- 11.1. Market Analysis, Insights and Forecast - by Material
- 11.1.1. Metals and Organometallic Catalysts
- 11.1.1.1. Inexpensive Metals
- 11.1.1.2. Precious Metals
- 11.1.1.3. Metallic Compounds
- 11.1.2. Aluminosilicates
- 11.1.2.1. Zeolites
- 11.1.2.2. Molecular Sieves
- 11.1.3. Chemical Compounds
- 11.1.3.1. Peroxides
- 11.1.3.2. Acids
- 11.1.3.3. Amines
- 11.1.3.4. Other Chemical Compounds
- 11.1.4. Other Materials
- 11.1.1. Metals and Organometallic Catalysts
- 11.2. Market Analysis, Insights and Forecast - by Application
- 11.2.1. Petroleum Refining
- 11.2.1.1. Fluid Catalytic Cracking (FCC)
- 11.2.1.2. Hydrocracking
- 11.2.1.3. Hydrotreating
- 11.2.1.4. Alkylation
- 11.2.1.5. Reforming
- 11.2.1.6. Isomerization
- 11.2.2. Chemical Synthesis
- 11.2.2.1. Organic Synthesis
- 11.2.2.2. Oxidation
- 11.2.2.3. Hydrogenation
- 11.2.2.4. Dehydrogenation
- 11.2.2.5. Synthesis Gas Processes
- 11.2.3. Polymerization
- 11.2.3.1. Polyolefins
- 11.2.3.2. Condensation Polymers
- 11.2.3.3. Thermosetting Polymers
- 11.2.3.4. Additional Polymers
- 11.2.1. Petroleum Refining
- 11.1. Market Analysis, Insights and Forecast - by Material
- 12. Competitive Analysis
- 12.1. Company Profiles
- 12.1.1 Chevron Phillips Chemical Company
- 12.1.1.1. Company Overview
- 12.1.1.2. Products
- 12.1.1.3. Company Financials
- 12.1.1.4. SWOT Analysis
- 12.1.2 Honeywell International Inc
- 12.1.2.1. Company Overview
- 12.1.2.2. Products
- 12.1.2.3. Company Financials
- 12.1.2.4. SWOT Analysis
- 12.1.3 W R Grace & Co
- 12.1.3.1. Company Overview
- 12.1.3.2. Products
- 12.1.3.3. Company Financials
- 12.1.3.4. SWOT Analysis
- 12.1.4 Catalytic Distillation Technologies
- 12.1.4.1. Company Overview
- 12.1.4.2. Products
- 12.1.4.3. Company Financials
- 12.1.4.4. SWOT Analysis
- 12.1.5 Exxon Mobil Corporation
- 12.1.5.1. Company Overview
- 12.1.5.2. Products
- 12.1.5.3. Company Financials
- 12.1.5.4. SWOT Analysis
- 12.1.6 INEOS Technologies
- 12.1.6.1. Company Overview
- 12.1.6.2. Products
- 12.1.6.3. Company Financials
- 12.1.6.4. SWOT Analysis
- 12.1.7 Johnson Matthey Inc
- 12.1.7.1. Company Overview
- 12.1.7.2. Products
- 12.1.7.3. Company Financials
- 12.1.7.4. SWOT Analysis
- 12.1.8 Evonik Industries AG
- 12.1.8.1. Company Overview
- 12.1.8.2. Products
- 12.1.8.3. Company Financials
- 12.1.8.4. SWOT Analysis
- 12.1.9 Wako Chemicals USA Inc
- 12.1.9.1. Company Overview
- 12.1.9.2. Products
- 12.1.9.3. Company Financials
- 12.1.9.4. SWOT Analysis
- 12.1.10 KBR Inc
- 12.1.10.1. Company Overview
- 12.1.10.2. Products
- 12.1.10.3. Company Financials
- 12.1.10.4. SWOT Analysis
- 12.1.11 BASF SE
- 12.1.11.1. Company Overview
- 12.1.11.2. Products
- 12.1.11.3. Company Financials
- 12.1.11.4. SWOT Analysis
- 12.1.12 Eka Chemicals AB
- 12.1.12.1. Company Overview
- 12.1.12.2. Products
- 12.1.12.3. Company Financials
- 12.1.12.4. SWOT Analysis
- 12.1.13 Zeochem LLC
- 12.1.13.1. Company Overview
- 12.1.13.2. Products
- 12.1.13.3. Company Financials
- 12.1.13.4. SWOT Analysis
- 12.1.14 Zeolyst International*List Not Exhaustive
- 12.1.14.1. Company Overview
- 12.1.14.2. Products
- 12.1.14.3. Company Financials
- 12.1.14.4. SWOT Analysis
- 12.1.15 Chicago Bridge & Iron Company
- 12.1.15.1. Company Overview
- 12.1.15.2. Products
- 12.1.15.3. Company Financials
- 12.1.15.4. SWOT Analysis
- 12.1.16 Dow
- 12.1.16.1. Company Overview
- 12.1.16.2. Products
- 12.1.16.3. Company Financials
- 12.1.16.4. SWOT Analysis
- 12.1.17 Bayer Technology Services
- 12.1.17.1. Company Overview
- 12.1.17.2. Products
- 12.1.17.3. Company Financials
- 12.1.17.4. SWOT Analysis
- 12.1.18 Nova Chemicals Corp
- 12.1.18.1. Company Overview
- 12.1.18.2. Products
- 12.1.18.3. Company Financials
- 12.1.18.4. SWOT Analysis
- 12.1.19 Clariant International Ltd
- 12.1.19.1. Company Overview
- 12.1.19.2. Products
- 12.1.19.3. Company Financials
- 12.1.19.4. SWOT Analysis
- 12.1.20 Eastman Chemical Co
- 12.1.20.1. Company Overview
- 12.1.20.2. Products
- 12.1.20.3. Company Financials
- 12.1.20.4. SWOT Analysis
- 12.1.1 Chevron Phillips Chemical Company
- 12.2. Market Entropy
- 12.2.1 Company's Key Areas Served
- 12.2.2 Recent Developments
- 12.3. Company Market Share Analysis 2025
- 12.3.1 Top 5 Companies Market Share Analysis
- 12.3.2 Top 3 Companies Market Share Analysis
- 12.4. List of Potential Customers
- 13. Research Methodology
List of Figures
- Figure 1: Global Petroleum Refining & Chemicals Catalysts Industry Revenue Breakdown (million, %) by Region 2025 & 2033
- Figure 2: Asia Pacific Petroleum Refining & Chemicals Catalysts Industry Revenue (million), by Material 2025 & 2033
- Figure 3: Asia Pacific Petroleum Refining & Chemicals Catalysts Industry Revenue Share (%), by Material 2025 & 2033
- Figure 4: Asia Pacific Petroleum Refining & Chemicals Catalysts Industry Revenue (million), by Application 2025 & 2033
- Figure 5: Asia Pacific Petroleum Refining & Chemicals Catalysts Industry Revenue Share (%), by Application 2025 & 2033
- Figure 6: Asia Pacific Petroleum Refining & Chemicals Catalysts Industry Revenue (million), by Country 2025 & 2033
- Figure 7: Asia Pacific Petroleum Refining & Chemicals Catalysts Industry Revenue Share (%), by Country 2025 & 2033
- Figure 8: North America Petroleum Refining & Chemicals Catalysts Industry Revenue (million), by Material 2025 & 2033
- Figure 9: North America Petroleum Refining & Chemicals Catalysts Industry Revenue Share (%), by Material 2025 & 2033
- Figure 10: North America Petroleum Refining & Chemicals Catalysts Industry Revenue (million), by Application 2025 & 2033
- Figure 11: North America Petroleum Refining & Chemicals Catalysts Industry Revenue Share (%), by Application 2025 & 2033
- Figure 12: North America Petroleum Refining & Chemicals Catalysts Industry Revenue (million), by Country 2025 & 2033
- Figure 13: North America Petroleum Refining & Chemicals Catalysts Industry Revenue Share (%), by Country 2025 & 2033
- Figure 14: Europe Petroleum Refining & Chemicals Catalysts Industry Revenue (million), by Material 2025 & 2033
- Figure 15: Europe Petroleum Refining & Chemicals Catalysts Industry Revenue Share (%), by Material 2025 & 2033
- Figure 16: Europe Petroleum Refining & Chemicals Catalysts Industry Revenue (million), by Application 2025 & 2033
- Figure 17: Europe Petroleum Refining & Chemicals Catalysts Industry Revenue Share (%), by Application 2025 & 2033
- Figure 18: Europe Petroleum Refining & Chemicals Catalysts Industry Revenue (million), by Country 2025 & 2033
- Figure 19: Europe Petroleum Refining & Chemicals Catalysts Industry Revenue Share (%), by Country 2025 & 2033
- Figure 20: South America Petroleum Refining & Chemicals Catalysts Industry Revenue (million), by Material 2025 & 2033
- Figure 21: South America Petroleum Refining & Chemicals Catalysts Industry Revenue Share (%), by Material 2025 & 2033
- Figure 22: South America Petroleum Refining & Chemicals Catalysts Industry Revenue (million), by Application 2025 & 2033
- Figure 23: South America Petroleum Refining & Chemicals Catalysts Industry Revenue Share (%), by Application 2025 & 2033
- Figure 24: South America Petroleum Refining & Chemicals Catalysts Industry Revenue (million), by Country 2025 & 2033
- Figure 25: South America Petroleum Refining & Chemicals Catalysts Industry Revenue Share (%), by Country 2025 & 2033
- Figure 26: Middle East and Africa Petroleum Refining & Chemicals Catalysts Industry Revenue (million), by Material 2025 & 2033
- Figure 27: Middle East and Africa Petroleum Refining & Chemicals Catalysts Industry Revenue Share (%), by Material 2025 & 2033
- Figure 28: Middle East and Africa Petroleum Refining & Chemicals Catalysts Industry Revenue (million), by Application 2025 & 2033
- Figure 29: Middle East and Africa Petroleum Refining & Chemicals Catalysts Industry Revenue Share (%), by Application 2025 & 2033
- Figure 30: Middle East and Africa Petroleum Refining & Chemicals Catalysts Industry Revenue (million), by Country 2025 & 2033
- Figure 31: Middle East and Africa Petroleum Refining & Chemicals Catalysts Industry Revenue Share (%), by Country 2025 & 2033
List of Tables
- Table 1: Global Petroleum Refining & Chemicals Catalysts Industry Revenue million Forecast, by Material 2020 & 2033
- Table 2: Global Petroleum Refining & Chemicals Catalysts Industry Revenue million Forecast, by Application 2020 & 2033
- Table 3: Global Petroleum Refining & Chemicals Catalysts Industry Revenue million Forecast, by Region 2020 & 2033
- Table 4: Global Petroleum Refining & Chemicals Catalysts Industry Revenue million Forecast, by Material 2020 & 2033
- Table 5: Global Petroleum Refining & Chemicals Catalysts Industry Revenue million Forecast, by Application 2020 & 2033
- Table 6: Global Petroleum Refining & Chemicals Catalysts Industry Revenue million Forecast, by Country 2020 & 2033
- Table 7: China Petroleum Refining & Chemicals Catalysts Industry Revenue (million) Forecast, by Application 2020 & 2033
- Table 8: India Petroleum Refining & Chemicals Catalysts Industry Revenue (million) Forecast, by Application 2020 & 2033
- Table 9: Japan Petroleum Refining & Chemicals Catalysts Industry Revenue (million) Forecast, by Application 2020 & 2033
- Table 10: South Korea Petroleum Refining & Chemicals Catalysts Industry Revenue (million) Forecast, by Application 2020 & 2033
- Table 11: ASEAN Countries Petroleum Refining & Chemicals Catalysts Industry Revenue (million) Forecast, by Application 2020 & 2033
- Table 12: Rest of Asia Pacific Petroleum Refining & Chemicals Catalysts Industry Revenue (million) Forecast, by Application 2020 & 2033
- Table 13: Global Petroleum Refining & Chemicals Catalysts Industry Revenue million Forecast, by Material 2020 & 2033
- Table 14: Global Petroleum Refining & Chemicals Catalysts Industry Revenue million Forecast, by Application 2020 & 2033
- Table 15: Global Petroleum Refining & Chemicals Catalysts Industry Revenue million Forecast, by Country 2020 & 2033
- Table 16: United States Petroleum Refining & Chemicals Catalysts Industry Revenue (million) Forecast, by Application 2020 & 2033
- Table 17: Canada Petroleum Refining & Chemicals Catalysts Industry Revenue (million) Forecast, by Application 2020 & 2033
- Table 18: Mexico Petroleum Refining & Chemicals Catalysts Industry Revenue (million) Forecast, by Application 2020 & 2033
- Table 19: Global Petroleum Refining & Chemicals Catalysts Industry Revenue million Forecast, by Material 2020 & 2033
- Table 20: Global Petroleum Refining & Chemicals Catalysts Industry Revenue million Forecast, by Application 2020 & 2033
- Table 21: Global Petroleum Refining & Chemicals Catalysts Industry Revenue million Forecast, by Country 2020 & 2033
- Table 22: Germany Petroleum Refining & Chemicals Catalysts Industry Revenue (million) Forecast, by Application 2020 & 2033
- Table 23: United Kingdom Petroleum Refining & Chemicals Catalysts Industry Revenue (million) Forecast, by Application 2020 & 2033
- Table 24: Italy Petroleum Refining & Chemicals Catalysts Industry Revenue (million) Forecast, by Application 2020 & 2033
- Table 25: France Petroleum Refining & Chemicals Catalysts Industry Revenue (million) Forecast, by Application 2020 & 2033
- Table 26: Rest of Europe Petroleum Refining & Chemicals Catalysts Industry Revenue (million) Forecast, by Application 2020 & 2033
- Table 27: Global Petroleum Refining & Chemicals Catalysts Industry Revenue million Forecast, by Material 2020 & 2033
- Table 28: Global Petroleum Refining & Chemicals Catalysts Industry Revenue million Forecast, by Application 2020 & 2033
- Table 29: Global Petroleum Refining & Chemicals Catalysts Industry Revenue million Forecast, by Country 2020 & 2033
- Table 30: Brazil Petroleum Refining & Chemicals Catalysts Industry Revenue (million) Forecast, by Application 2020 & 2033
- Table 31: Argentina Petroleum Refining & Chemicals Catalysts Industry Revenue (million) Forecast, by Application 2020 & 2033
- Table 32: Rest of South America Petroleum Refining & Chemicals Catalysts Industry Revenue (million) Forecast, by Application 2020 & 2033
- Table 33: Global Petroleum Refining & Chemicals Catalysts Industry Revenue million Forecast, by Material 2020 & 2033
- Table 34: Global Petroleum Refining & Chemicals Catalysts Industry Revenue million Forecast, by Application 2020 & 2033
- Table 35: Global Petroleum Refining & Chemicals Catalysts Industry Revenue million Forecast, by Country 2020 & 2033
- Table 36: Saudi Arabia Petroleum Refining & Chemicals Catalysts Industry Revenue (million) Forecast, by Application 2020 & 2033
- Table 37: South Africa Petroleum Refining & Chemicals Catalysts Industry Revenue (million) Forecast, by Application 2020 & 2033
- Table 38: Rest of Middle East and Africa Petroleum Refining & Chemicals Catalysts Industry Revenue (million) Forecast, by Application 2020 & 2033
Frequently Asked Questions
1. What is the projected Compound Annual Growth Rate (CAGR) of the Petroleum Refining & Chemicals Catalysts Industry?
The projected CAGR is approximately 4.3%.
2. Which companies are prominent players in the Petroleum Refining & Chemicals Catalysts Industry?
Key companies in the market include Chevron Phillips Chemical Company, Honeywell International Inc, W R Grace & Co, Catalytic Distillation Technologies, Exxon Mobil Corporation, INEOS Technologies, Johnson Matthey Inc, Evonik Industries AG, Wako Chemicals USA Inc, KBR Inc, BASF SE, Eka Chemicals AB, Zeochem LLC, Zeolyst International*List Not Exhaustive, Chicago Bridge & Iron Company, Dow, Bayer Technology Services, Nova Chemicals Corp, Clariant International Ltd, Eastman Chemical Co.
3. What are the main segments of the Petroleum Refining & Chemicals Catalysts Industry?
The market segments include Material, Application.
4. Can you provide details about the market size?
The market size is estimated to be USD 10096.57 million as of 2022.
5. What are some drivers contributing to market growth?
Increasing Refinery Market Output in Africa; Middle East; and Asia-Pacific; Rising Demand for Maintaining High Octane Figures.
6. What are the notable trends driving market growth?
Petroleum Refining Application to Dominate the Market.
7. Are there any restraints impacting market growth?
High Manufacturing Costs; Other Restraints.
8. Can you provide examples of recent developments in the market?
N/A
9. What pricing options are available for accessing the report?
Pricing options include single-user, multi-user, and enterprise licenses priced at USD 4750, USD 5250, and USD 8750 respectively.
10. Is the market size provided in terms of value or volume?
The market size is provided in terms of value, measured in million.
11. Are there any specific market keywords associated with the report?
Yes, the market keyword associated with the report is "Petroleum Refining & Chemicals Catalysts Industry," which aids in identifying and referencing the specific market segment covered.
12. How do I determine which pricing option suits my needs best?
The pricing options vary based on user requirements and access needs. Individual users may opt for single-user licenses, while businesses requiring broader access may choose multi-user or enterprise licenses for cost-effective access to the report.
13. Are there any additional resources or data provided in the Petroleum Refining & Chemicals Catalysts Industry report?
While the report offers comprehensive insights, it's advisable to review the specific contents or supplementary materials provided to ascertain if additional resources or data are available.
14. How can I stay updated on further developments or reports in the Petroleum Refining & Chemicals Catalysts Industry?
To stay informed about further developments, trends, and reports in the Petroleum Refining & Chemicals Catalysts Industry, consider subscribing to industry newsletters, following relevant companies and organizations, or regularly checking reputable industry news sources and publications.
Methodology
Step 1 - Identification of Relevant Samples Size from Population Database


Step 2 - Approaches for Defining Global Market Size (Value, Volume* & Price*)

Note*: In applicable scenarios
Step 3 - Data Sources
Primary Research
- Web Analytics
- Survey Reports
- Research Institute
- Latest Research Reports
- Opinion Leaders
Secondary Research
- Annual Reports
- White Paper
- Latest Press Release
- Industry Association
- Paid Database
- Investor Presentations

Step 4 - Data Triangulation
Involves using different sources of information in order to increase the validity of a study
These sources are likely to be stakeholders in a program - participants, other researchers, program staff, other community members, and so on.
Then we put all data in single framework & apply various statistical tools to find out the dynamic on the market.
During the analysis stage, feedback from the stakeholder groups would be compared to determine areas of agreement as well as areas of divergence