

Key Insights
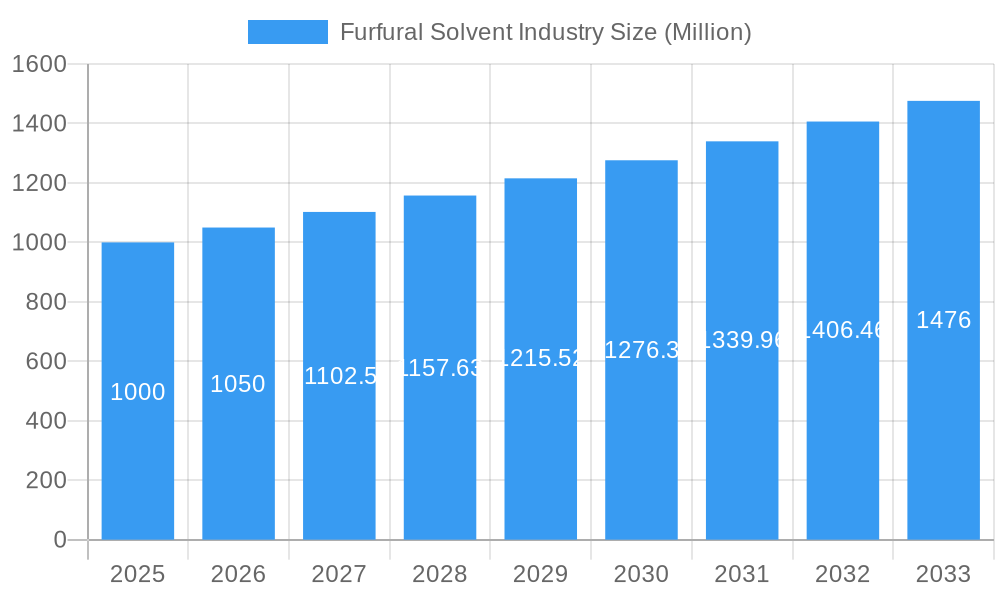
The global furfural solvent market is poised for substantial expansion, projected to reach 870.7 million by 2033, growing at a Compound Annual Growth Rate (CAGR) of 4.2% from the base year 2025. This growth is propelled by escalating demand across key sectors including petroleum refining, agrochemicals, paints & coatings, and pharmaceuticals. The increasing preference for sustainable, bio-based solvents significantly contributes to market advancement. Petroleum refining relies heavily on furfural for solvent extraction, while the agrochemical industry incorporates it into various formulations. The paints and coatings sector benefits from furfural's film-forming and durability-enhancing properties, ensuring sustained demand. Although a niche segment, pharmaceutical applications are showing steady growth, supported by increased R&D in novel drug delivery systems. Potential restraints include fluctuating raw material costs and stringent environmental regulations. Future growth will be contingent on advancements in production efficiency and environmental impact reduction. Geographically, the Asia-Pacific region, particularly China and India, leads market performance due to rapid industrialization. North America and Europe maintain considerable market shares owing to established industrial infrastructures and high regulatory standards.
Furfural Solvent Industry Market Size (In Million)
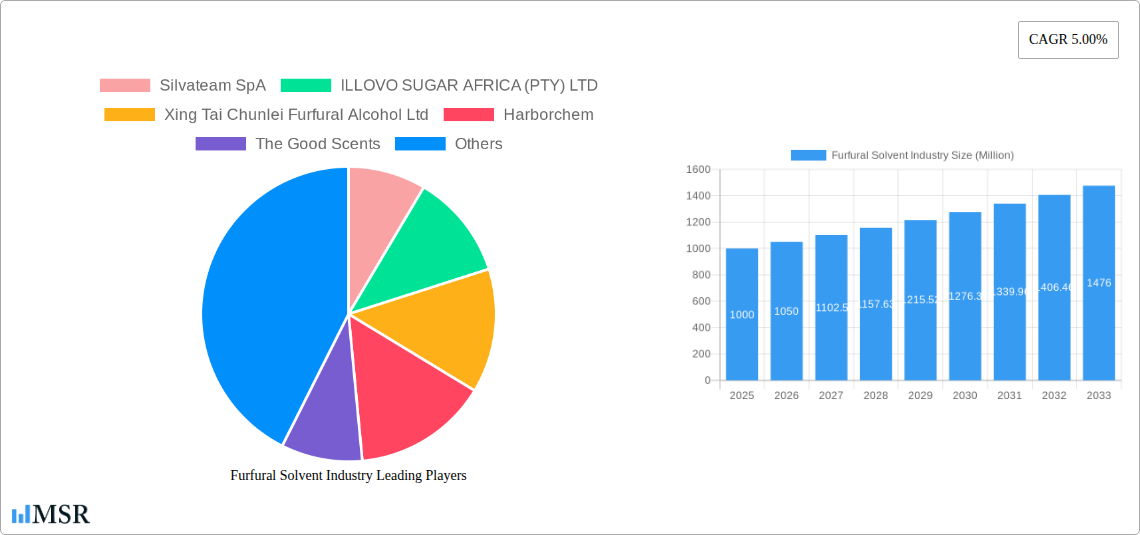
The competitive environment features established entities such as Silvateam SpA, ILLOVO SUGAR AFRICA (PTY) LTD, and Xing Tai Chunlei Furfural Alcohol Ltd, alongside emerging specialized manufacturers. Strategic alliances, mergers, and acquisitions are expected to define the industry's future, driven by efforts to expand product portfolios and market reach. Promising future prospects are underpinned by consistent demand from current applications and the potential for new market penetration. Expect further market segmentation based on specific end-user requirements, fostering tailored product development. Innovation in solvent technology, especially in developing eco-friendly and high-performance furfural-based products, will be critical for sustained growth. A strong emphasis on sustainable production practices and responsible raw material sourcing will shape the market's trajectory.
Furfural Solvent Industry Company Market Share
Furfural Solvent Industry: A Comprehensive Market Analysis (2019-2033)
This comprehensive report provides an in-depth analysis of the Furfural Solvent industry, offering valuable insights for stakeholders, investors, and industry professionals. The study period covers 2019-2033, with a base year of 2025 and a forecast period of 2025-2033. The report leverages extensive market research and data analysis to deliver actionable intelligence on market size, growth drivers, competitive dynamics, and future opportunities, all presented in an easy-to-understand format. The global Furfural Solvent market is expected to reach xx Million by 2033, exhibiting a CAGR of xx% during the forecast period.
Furfural Solvent Industry Market Concentration & Dynamics
The global Furfural Solvent market exhibits a moderately concentrated structure, with key players holding significant market share. While precise market share figures for individual companies remain confidential, leading players such as Silvateam SpA, ILLOVO SUGAR AFRICA (PTY) LTD, and Shandong Crownchem Industries Co Ltd command substantial portions of the market. The industry’s dynamics are shaped by several factors:
- Innovation Ecosystems: Ongoing research and development efforts focus on enhancing Furfural Solvent production efficiency and exploring new applications, driving innovation.
- Regulatory Frameworks: Environmental regulations concerning solvent emissions and waste management significantly influence industry operations and investment decisions. Compliance costs are a major factor impacting profitability.
- Substitute Products: The presence of alternative solvents creates competitive pressure, necessitating continuous innovation and cost optimization.
- End-User Trends: Shifting demands across various end-user industries, particularly in Petroleum Refining and Agrochemicals, influence market growth and product development strategies.
- M&A Activities: The number of mergers and acquisitions in the Furfural Solvent industry has been relatively low in recent years, with approximately xx deals recorded between 2019 and 2024. Consolidation is expected to increase in the coming years, driven by the need for enhanced scale and technological advancements.
Furfural Solvent Industry Industry Insights & Trends
The Furfural Solvent market is experiencing robust growth, primarily driven by increasing demand from the Agrochemicals and Petroleum Refining sectors. The market size reached approximately xx Million in 2024 and is projected to surpass xx Million by 2033, signifying a significant expansion. This growth is propelled by factors such as:
- Rising demand for bio-based solvents: The increasing emphasis on sustainable practices is fueling the adoption of Furfural Solvent as an eco-friendly alternative to traditional solvents.
- Technological advancements: Innovations in production processes and application technologies are enhancing the efficiency and effectiveness of Furfural Solvent.
- Expanding end-use applications: Furfural Solvent's versatility is driving its penetration into diverse industries, such as Pharmaceuticals and Paints and Coatings.
- Economic growth in developing economies: Rapid industrialization and infrastructure development in emerging markets, like Asia and South America, are significantly boosting market demand.
- Government support for sustainable chemistry: Several governments are actively promoting the use of green solvents, creating favorable conditions for the growth of the Furfural Solvent market.
Key Markets & Segments Leading Furfural Solvent Industry
The Petroleum Refining segment currently represents the dominant end-use industry for Furfural Solvent, accounting for an estimated xx% of the total market share in 2024. This dominance is attributed to:
- Drivers for Petroleum Refining:
- Strong economic growth in key regions, driving higher fuel production and refining activities.
- Increasing investment in refinery modernization and expansion.
- Stringent emission regulations promoting the adoption of efficient solvents like Furfural.
The Agrochemicals sector is another significant market segment, exhibiting robust growth due to the increasing use of Furfural Solvent as a component in various pesticides and herbicides. Other significant end-use industries include Paints and Coatings and Pharmaceuticals. The Asia-Pacific region stands as a leading market, driven by rapid industrialization and infrastructure developments.
Furfural Solvent Industry Product Developments
Recent product innovations focus on improving solvent purity, enhancing performance characteristics, and broadening application versatility. These developments include new formulations designed to optimize solubility, reduce toxicity, and enhance biodegradability, leading to a competitive advantage for companies offering advanced Furfural Solvent solutions.
Challenges in the Furfural Solvent Industry Market
The Furfural Solvent industry faces several challenges, including:
- Fluctuating raw material prices: The cost of raw materials significantly impacts profitability.
- Stringent environmental regulations: Compliance with increasingly strict environmental norms necessitates substantial investments.
- Intense competition: The presence of numerous players creates a highly competitive landscape.
- Supply chain disruptions: Global events can easily affect the availability of raw materials.
Forces Driving Furfural Solvent Industry Growth
Key growth drivers include the increasing demand from the agrochemical and petroleum refining sectors, government support for sustainable chemistry, and technological advancements in production processes. Economic growth in emerging markets also plays a significant role, creating new opportunities for market expansion.
Long-Term Growth Catalysts in the Furfural Solvent Industry
Long-term growth is fueled by ongoing research and development, leading to improved product performance and expanded applications. Strategic partnerships and collaborations among industry players also contribute to innovation and market penetration. Furthermore, geographic expansion into new markets offers significant potential for future growth.
Emerging Opportunities in Furfural Solvent Industry
Emerging opportunities lie in the exploration of new applications in advanced materials, renewable energy, and biotechnology. The development of sustainable and efficient production methods also presents significant potential for growth. Furthermore, targeting niche markets with specialized Furfural Solvent formulations offers strong growth prospects.
Leading Players in the Furfural Solvent Industry Sector
- Silvateam SpA
- ILLOVO SUGAR AFRICA (PTY) LTD
- Xing Tai Chunlei Furfural Alcohol Ltd
- Harborchem
- The Good Scents
- Furfural Espanol SA
- Alchem Chemical Co
- Shandong Crownchem Industries Co Ltd
- Pennakem LLC
- Teijing North Furfural Co
- Linzi Organic Chemical
- Transfurans Chemicals
- Goodrich Sugar & Chemical
Key Milestones in Furfural Solvent Industry Industry
- 2020: Increased investments in R&D for more sustainable production methods.
- 2022: Successful launch of a new, high-purity Furfural Solvent product by a leading manufacturer.
- 2023: Several key players entered strategic partnerships to expand their market reach.
Strategic Outlook for Furfural Solvent Industry Market
The Furfural Solvent market is poised for sustained growth, driven by increasing demand across diverse sectors and ongoing technological advancements. Strategic opportunities include investing in R&D for novel applications, optimizing production efficiency, and exploring strategic mergers and acquisitions to enhance market share and competitiveness. The focus on sustainability and eco-friendly practices will continue to shape industry dynamics and present lucrative growth avenues.
Furfural Solvent Industry Segmentation
-
1. End-user Industry
- 1.1. Petroleum Refining
- 1.2. Agrochemicals
- 1.3. Paints and Coatings
- 1.4. Pharmaceuticals
- 1.5. Other End-user Industries
Furfural Solvent Industry Segmentation By Geography
-
1. Asia Pacific
- 1.1. China
- 1.2. India
- 1.3. Japan
- 1.4. South Korea
- 1.5. Rest of Asia Pacific
-
2. North America
- 2.1. United States
- 2.2. Mexico
- 2.3. Canada
-
3. Europe
- 3.1. Germany
- 3.2. United Kingdom
- 3.3. Italy
- 3.4. France
- 3.5. Rest of Europe
-
4. South America
- 4.1. Brazil
- 4.2. Argentina
- 4.3. Rest of South America
-
5. Middle East and Africa
- 5.1. Saudi Arabia
- 5.2. South Africa
- 5.3. Rest of Middle East and Africa
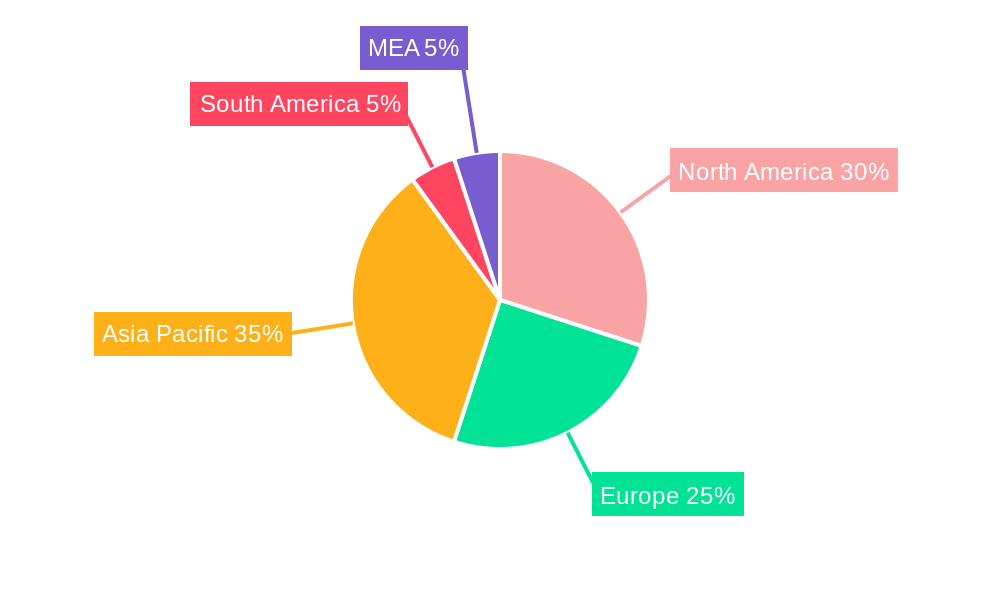
Furfural Solvent Industry Regional Market Share
Geographic Coverage of Furfural Solvent Industry
Furfural Solvent Industry REPORT HIGHLIGHTS
| Aspects | Details |
|---|---|
| Study Period | 2020-2034 |
| Base Year | 2025 |
| Estimated Year | 2026 |
| Forecast Period | 2026-2034 |
| Historical Period | 2020-2025 |
| Growth Rate | CAGR of 7% from 2020-2034 |
| Segmentation |
|
Table of Contents
- 1. Introduction
- 1.1. Research Scope
- 1.2. Market Segmentation
- 1.3. Research Objective
- 1.4. Definitions and Assumptions
- 2. Executive Summary
- 2.1. Market Snapshot
- 3. Market Dynamics
- 3.1. Market Drivers
- 3.2. Market Restrains
- 3.3. Market Trends
- 3.4. Market Opportunities
- 4. Market Factor Analysis
- 4.1. Porters Five Forces
- 4.1.1. Bargaining Power of Suppliers
- 4.1.2. Bargaining Power of Buyers
- 4.1.3. Threat of New Entrants
- 4.1.4. Threat of Substitutes
- 4.1.5. Competitive Rivalry
- 4.2. PESTEL analysis
- 4.3. BCG Analysis
- 4.3.1. Stars (High Growth, High Market Share)
- 4.3.2. Cash Cows (Low Growth, High Market Share)
- 4.3.3. Question Mark (High Growth, Low Market Share)
- 4.3.4. Dogs (Low Growth, Low Market Share)
- 4.4. Ansoff Matrix Analysis
- 4.5. Supply Chain Analysis
- 4.6. Regulatory Landscape
- 4.7. Current Market Potential and Opportunity Assessment (TAM–SAM–SOM Framework)
- 4.8. MSR Analyst Note
- 4.1. Porters Five Forces
- 5. Market Analysis, Insights and Forecast 2021-2033
- 5.1. Market Analysis, Insights and Forecast - by End-user Industry
- 5.1.1. Petroleum Refining
- 5.1.2. Agrochemicals
- 5.1.3. Paints and Coatings
- 5.1.4. Pharmaceuticals
- 5.1.5. Other End-user Industries
- 5.2. Market Analysis, Insights and Forecast - by Region
- 5.2.1. Asia Pacific
- 5.2.2. North America
- 5.2.3. Europe
- 5.2.4. South America
- 5.2.5. Middle East and Africa
- 5.1. Market Analysis, Insights and Forecast - by End-user Industry
- 6. Global Furfural Solvent Industry Analysis, Insights and Forecast, 2021-2033
- 6.1. Market Analysis, Insights and Forecast - by End-user Industry
- 6.1.1. Petroleum Refining
- 6.1.2. Agrochemicals
- 6.1.3. Paints and Coatings
- 6.1.4. Pharmaceuticals
- 6.1.5. Other End-user Industries
- 6.1. Market Analysis, Insights and Forecast - by End-user Industry
- 7. Asia Pacific Furfural Solvent Industry Analysis, Insights and Forecast, 2020-2032
- 7.1. Market Analysis, Insights and Forecast - by End-user Industry
- 7.1.1. Petroleum Refining
- 7.1.2. Agrochemicals
- 7.1.3. Paints and Coatings
- 7.1.4. Pharmaceuticals
- 7.1.5. Other End-user Industries
- 7.1. Market Analysis, Insights and Forecast - by End-user Industry
- 8. North America Furfural Solvent Industry Analysis, Insights and Forecast, 2020-2032
- 8.1. Market Analysis, Insights and Forecast - by End-user Industry
- 8.1.1. Petroleum Refining
- 8.1.2. Agrochemicals
- 8.1.3. Paints and Coatings
- 8.1.4. Pharmaceuticals
- 8.1.5. Other End-user Industries
- 8.1. Market Analysis, Insights and Forecast - by End-user Industry
- 9. Europe Furfural Solvent Industry Analysis, Insights and Forecast, 2020-2032
- 9.1. Market Analysis, Insights and Forecast - by End-user Industry
- 9.1.1. Petroleum Refining
- 9.1.2. Agrochemicals
- 9.1.3. Paints and Coatings
- 9.1.4. Pharmaceuticals
- 9.1.5. Other End-user Industries
- 9.1. Market Analysis, Insights and Forecast - by End-user Industry
- 10. South America Furfural Solvent Industry Analysis, Insights and Forecast, 2020-2032
- 10.1. Market Analysis, Insights and Forecast - by End-user Industry
- 10.1.1. Petroleum Refining
- 10.1.2. Agrochemicals
- 10.1.3. Paints and Coatings
- 10.1.4. Pharmaceuticals
- 10.1.5. Other End-user Industries
- 10.1. Market Analysis, Insights and Forecast - by End-user Industry
- 11. Middle East and Africa Furfural Solvent Industry Analysis, Insights and Forecast, 2020-2032
- 11.1. Market Analysis, Insights and Forecast - by End-user Industry
- 11.1.1. Petroleum Refining
- 11.1.2. Agrochemicals
- 11.1.3. Paints and Coatings
- 11.1.4. Pharmaceuticals
- 11.1.5. Other End-user Industries
- 11.1. Market Analysis, Insights and Forecast - by End-user Industry
- 12. Competitive Analysis
- 12.1. Company Profiles
- 12.1.1 Silvateam SpA
- 12.1.1.1. Company Overview
- 12.1.1.2. Products
- 12.1.1.3. Company Financials
- 12.1.1.4. SWOT Analysis
- 12.1.2 ILLOVO SUGAR AFRICA (PTY) LTD
- 12.1.2.1. Company Overview
- 12.1.2.2. Products
- 12.1.2.3. Company Financials
- 12.1.2.4. SWOT Analysis
- 12.1.3 Xing Tai Chunlei Furfural Alcohol Ltd
- 12.1.3.1. Company Overview
- 12.1.3.2. Products
- 12.1.3.3. Company Financials
- 12.1.3.4. SWOT Analysis
- 12.1.4 Harborchem
- 12.1.4.1. Company Overview
- 12.1.4.2. Products
- 12.1.4.3. Company Financials
- 12.1.4.4. SWOT Analysis
- 12.1.5 The Good Scents
- 12.1.5.1. Company Overview
- 12.1.5.2. Products
- 12.1.5.3. Company Financials
- 12.1.5.4. SWOT Analysis
- 12.1.6 Furfural Espanol SA
- 12.1.6.1. Company Overview
- 12.1.6.2. Products
- 12.1.6.3. Company Financials
- 12.1.6.4. SWOT Analysis
- 12.1.7 Alchem Chemical Co
- 12.1.7.1. Company Overview
- 12.1.7.2. Products
- 12.1.7.3. Company Financials
- 12.1.7.4. SWOT Analysis
- 12.1.8 Shandong Crownchem Industries Co Ltd
- 12.1.8.1. Company Overview
- 12.1.8.2. Products
- 12.1.8.3. Company Financials
- 12.1.8.4. SWOT Analysis
- 12.1.9 Pennakem LLC
- 12.1.9.1. Company Overview
- 12.1.9.2. Products
- 12.1.9.3. Company Financials
- 12.1.9.4. SWOT Analysis
- 12.1.10 Teijing North Furfural Co
- 12.1.10.1. Company Overview
- 12.1.10.2. Products
- 12.1.10.3. Company Financials
- 12.1.10.4. SWOT Analysis
- 12.1.11 Linzi Organic Chemical
- 12.1.11.1. Company Overview
- 12.1.11.2. Products
- 12.1.11.3. Company Financials
- 12.1.11.4. SWOT Analysis
- 12.1.12 Transfurans Chemicals
- 12.1.12.1. Company Overview
- 12.1.12.2. Products
- 12.1.12.3. Company Financials
- 12.1.12.4. SWOT Analysis
- 12.1.13 Goodrich Sugar & Chemical
- 12.1.13.1. Company Overview
- 12.1.13.2. Products
- 12.1.13.3. Company Financials
- 12.1.13.4. SWOT Analysis
- 12.1.1 Silvateam SpA
- 12.2. Market Entropy
- 12.2.1 Company's Key Areas Served
- 12.2.2 Recent Developments
- 12.3. Company Market Share Analysis 2025
- 12.3.1 Top 5 Companies Market Share Analysis
- 12.3.2 Top 3 Companies Market Share Analysis
- 12.4. List of Potential Customers
- 13. Research Methodology
List of Figures
- Figure 1: Global Furfural Solvent Industry Revenue Breakdown (million, %) by Region 2025 & 2033
- Figure 2: Global Furfural Solvent Industry Volume Breakdown (K Tons, %) by Region 2025 & 2033
- Figure 3: Asia Pacific Furfural Solvent Industry Revenue (million), by End-user Industry 2025 & 2033
- Figure 4: Asia Pacific Furfural Solvent Industry Volume (K Tons), by End-user Industry 2025 & 2033
- Figure 5: Asia Pacific Furfural Solvent Industry Revenue Share (%), by End-user Industry 2025 & 2033
- Figure 6: Asia Pacific Furfural Solvent Industry Volume Share (%), by End-user Industry 2025 & 2033
- Figure 7: Asia Pacific Furfural Solvent Industry Revenue (million), by Country 2025 & 2033
- Figure 8: Asia Pacific Furfural Solvent Industry Volume (K Tons), by Country 2025 & 2033
- Figure 9: Asia Pacific Furfural Solvent Industry Revenue Share (%), by Country 2025 & 2033
- Figure 10: Asia Pacific Furfural Solvent Industry Volume Share (%), by Country 2025 & 2033
- Figure 11: North America Furfural Solvent Industry Revenue (million), by End-user Industry 2025 & 2033
- Figure 12: North America Furfural Solvent Industry Volume (K Tons), by End-user Industry 2025 & 2033
- Figure 13: North America Furfural Solvent Industry Revenue Share (%), by End-user Industry 2025 & 2033
- Figure 14: North America Furfural Solvent Industry Volume Share (%), by End-user Industry 2025 & 2033
- Figure 15: North America Furfural Solvent Industry Revenue (million), by Country 2025 & 2033
- Figure 16: North America Furfural Solvent Industry Volume (K Tons), by Country 2025 & 2033
- Figure 17: North America Furfural Solvent Industry Revenue Share (%), by Country 2025 & 2033
- Figure 18: North America Furfural Solvent Industry Volume Share (%), by Country 2025 & 2033
- Figure 19: Europe Furfural Solvent Industry Revenue (million), by End-user Industry 2025 & 2033
- Figure 20: Europe Furfural Solvent Industry Volume (K Tons), by End-user Industry 2025 & 2033
- Figure 21: Europe Furfural Solvent Industry Revenue Share (%), by End-user Industry 2025 & 2033
- Figure 22: Europe Furfural Solvent Industry Volume Share (%), by End-user Industry 2025 & 2033
- Figure 23: Europe Furfural Solvent Industry Revenue (million), by Country 2025 & 2033
- Figure 24: Europe Furfural Solvent Industry Volume (K Tons), by Country 2025 & 2033
- Figure 25: Europe Furfural Solvent Industry Revenue Share (%), by Country 2025 & 2033
- Figure 26: Europe Furfural Solvent Industry Volume Share (%), by Country 2025 & 2033
- Figure 27: South America Furfural Solvent Industry Revenue (million), by End-user Industry 2025 & 2033
- Figure 28: South America Furfural Solvent Industry Volume (K Tons), by End-user Industry 2025 & 2033
- Figure 29: South America Furfural Solvent Industry Revenue Share (%), by End-user Industry 2025 & 2033
- Figure 30: South America Furfural Solvent Industry Volume Share (%), by End-user Industry 2025 & 2033
- Figure 31: South America Furfural Solvent Industry Revenue (million), by Country 2025 & 2033
- Figure 32: South America Furfural Solvent Industry Volume (K Tons), by Country 2025 & 2033
- Figure 33: South America Furfural Solvent Industry Revenue Share (%), by Country 2025 & 2033
- Figure 34: South America Furfural Solvent Industry Volume Share (%), by Country 2025 & 2033
- Figure 35: Middle East and Africa Furfural Solvent Industry Revenue (million), by End-user Industry 2025 & 2033
- Figure 36: Middle East and Africa Furfural Solvent Industry Volume (K Tons), by End-user Industry 2025 & 2033
- Figure 37: Middle East and Africa Furfural Solvent Industry Revenue Share (%), by End-user Industry 2025 & 2033
- Figure 38: Middle East and Africa Furfural Solvent Industry Volume Share (%), by End-user Industry 2025 & 2033
- Figure 39: Middle East and Africa Furfural Solvent Industry Revenue (million), by Country 2025 & 2033
- Figure 40: Middle East and Africa Furfural Solvent Industry Volume (K Tons), by Country 2025 & 2033
- Figure 41: Middle East and Africa Furfural Solvent Industry Revenue Share (%), by Country 2025 & 2033
- Figure 42: Middle East and Africa Furfural Solvent Industry Volume Share (%), by Country 2025 & 2033
List of Tables
- Table 1: Global Furfural Solvent Industry Revenue million Forecast, by End-user Industry 2020 & 2033
- Table 2: Global Furfural Solvent Industry Volume K Tons Forecast, by End-user Industry 2020 & 2033
- Table 3: Global Furfural Solvent Industry Revenue million Forecast, by Region 2020 & 2033
- Table 4: Global Furfural Solvent Industry Volume K Tons Forecast, by Region 2020 & 2033
- Table 5: Global Furfural Solvent Industry Revenue million Forecast, by End-user Industry 2020 & 2033
- Table 6: Global Furfural Solvent Industry Volume K Tons Forecast, by End-user Industry 2020 & 2033
- Table 7: Global Furfural Solvent Industry Revenue million Forecast, by Country 2020 & 2033
- Table 8: Global Furfural Solvent Industry Volume K Tons Forecast, by Country 2020 & 2033
- Table 9: China Furfural Solvent Industry Revenue (million) Forecast, by Application 2020 & 2033
- Table 10: China Furfural Solvent Industry Volume (K Tons) Forecast, by Application 2020 & 2033
- Table 11: India Furfural Solvent Industry Revenue (million) Forecast, by Application 2020 & 2033
- Table 12: India Furfural Solvent Industry Volume (K Tons) Forecast, by Application 2020 & 2033
- Table 13: Japan Furfural Solvent Industry Revenue (million) Forecast, by Application 2020 & 2033
- Table 14: Japan Furfural Solvent Industry Volume (K Tons) Forecast, by Application 2020 & 2033
- Table 15: South Korea Furfural Solvent Industry Revenue (million) Forecast, by Application 2020 & 2033
- Table 16: South Korea Furfural Solvent Industry Volume (K Tons) Forecast, by Application 2020 & 2033
- Table 17: Rest of Asia Pacific Furfural Solvent Industry Revenue (million) Forecast, by Application 2020 & 2033
- Table 18: Rest of Asia Pacific Furfural Solvent Industry Volume (K Tons) Forecast, by Application 2020 & 2033
- Table 19: Global Furfural Solvent Industry Revenue million Forecast, by End-user Industry 2020 & 2033
- Table 20: Global Furfural Solvent Industry Volume K Tons Forecast, by End-user Industry 2020 & 2033
- Table 21: Global Furfural Solvent Industry Revenue million Forecast, by Country 2020 & 2033
- Table 22: Global Furfural Solvent Industry Volume K Tons Forecast, by Country 2020 & 2033
- Table 23: United States Furfural Solvent Industry Revenue (million) Forecast, by Application 2020 & 2033
- Table 24: United States Furfural Solvent Industry Volume (K Tons) Forecast, by Application 2020 & 2033
- Table 25: Mexico Furfural Solvent Industry Revenue (million) Forecast, by Application 2020 & 2033
- Table 26: Mexico Furfural Solvent Industry Volume (K Tons) Forecast, by Application 2020 & 2033
- Table 27: Canada Furfural Solvent Industry Revenue (million) Forecast, by Application 2020 & 2033
- Table 28: Canada Furfural Solvent Industry Volume (K Tons) Forecast, by Application 2020 & 2033
- Table 29: Global Furfural Solvent Industry Revenue million Forecast, by End-user Industry 2020 & 2033
- Table 30: Global Furfural Solvent Industry Volume K Tons Forecast, by End-user Industry 2020 & 2033
- Table 31: Global Furfural Solvent Industry Revenue million Forecast, by Country 2020 & 2033
- Table 32: Global Furfural Solvent Industry Volume K Tons Forecast, by Country 2020 & 2033
- Table 33: Germany Furfural Solvent Industry Revenue (million) Forecast, by Application 2020 & 2033
- Table 34: Germany Furfural Solvent Industry Volume (K Tons) Forecast, by Application 2020 & 2033
- Table 35: United Kingdom Furfural Solvent Industry Revenue (million) Forecast, by Application 2020 & 2033
- Table 36: United Kingdom Furfural Solvent Industry Volume (K Tons) Forecast, by Application 2020 & 2033
- Table 37: Italy Furfural Solvent Industry Revenue (million) Forecast, by Application 2020 & 2033
- Table 38: Italy Furfural Solvent Industry Volume (K Tons) Forecast, by Application 2020 & 2033
- Table 39: France Furfural Solvent Industry Revenue (million) Forecast, by Application 2020 & 2033
- Table 40: France Furfural Solvent Industry Volume (K Tons) Forecast, by Application 2020 & 2033
- Table 41: Rest of Europe Furfural Solvent Industry Revenue (million) Forecast, by Application 2020 & 2033
- Table 42: Rest of Europe Furfural Solvent Industry Volume (K Tons) Forecast, by Application 2020 & 2033
- Table 43: Global Furfural Solvent Industry Revenue million Forecast, by End-user Industry 2020 & 2033
- Table 44: Global Furfural Solvent Industry Volume K Tons Forecast, by End-user Industry 2020 & 2033
- Table 45: Global Furfural Solvent Industry Revenue million Forecast, by Country 2020 & 2033
- Table 46: Global Furfural Solvent Industry Volume K Tons Forecast, by Country 2020 & 2033
- Table 47: Brazil Furfural Solvent Industry Revenue (million) Forecast, by Application 2020 & 2033
- Table 48: Brazil Furfural Solvent Industry Volume (K Tons) Forecast, by Application 2020 & 2033
- Table 49: Argentina Furfural Solvent Industry Revenue (million) Forecast, by Application 2020 & 2033
- Table 50: Argentina Furfural Solvent Industry Volume (K Tons) Forecast, by Application 2020 & 2033
- Table 51: Rest of South America Furfural Solvent Industry Revenue (million) Forecast, by Application 2020 & 2033
- Table 52: Rest of South America Furfural Solvent Industry Volume (K Tons) Forecast, by Application 2020 & 2033
- Table 53: Global Furfural Solvent Industry Revenue million Forecast, by End-user Industry 2020 & 2033
- Table 54: Global Furfural Solvent Industry Volume K Tons Forecast, by End-user Industry 2020 & 2033
- Table 55: Global Furfural Solvent Industry Revenue million Forecast, by Country 2020 & 2033
- Table 56: Global Furfural Solvent Industry Volume K Tons Forecast, by Country 2020 & 2033
- Table 57: Saudi Arabia Furfural Solvent Industry Revenue (million) Forecast, by Application 2020 & 2033
- Table 58: Saudi Arabia Furfural Solvent Industry Volume (K Tons) Forecast, by Application 2020 & 2033
- Table 59: South Africa Furfural Solvent Industry Revenue (million) Forecast, by Application 2020 & 2033
- Table 60: South Africa Furfural Solvent Industry Volume (K Tons) Forecast, by Application 2020 & 2033
- Table 61: Rest of Middle East and Africa Furfural Solvent Industry Revenue (million) Forecast, by Application 2020 & 2033
- Table 62: Rest of Middle East and Africa Furfural Solvent Industry Volume (K Tons) Forecast, by Application 2020 & 2033
Frequently Asked Questions
1. What is the projected Compound Annual Growth Rate (CAGR) of the Furfural Solvent Industry?
The projected CAGR is approximately 7%.
2. Which companies are prominent players in the Furfural Solvent Industry?
Key companies in the market include Silvateam SpA, ILLOVO SUGAR AFRICA (PTY) LTD, Xing Tai Chunlei Furfural Alcohol Ltd, Harborchem, The Good Scents, Furfural Espanol SA, Alchem Chemical Co, Shandong Crownchem Industries Co Ltd, Pennakem LLC, Teijing North Furfural Co, Linzi Organic Chemical, Transfurans Chemicals, Goodrich Sugar & Chemical.
3. What are the main segments of the Furfural Solvent Industry?
The market segments include End-user Industry.
4. Can you provide details about the market size?
The market size is estimated to be USD 680 million as of 2022.
5. What are some drivers contributing to market growth?
; Non Toxicity and Low Volatile Organic Compound Content of Furfural Solvent; Other Drivers.
6. What are the notable trends driving market growth?
Increasing Demand from Agrochemicals Segment.
7. Are there any restraints impacting market growth?
; Limited Availability of Raw Material; Unfavorable Conditions Arising Due to COVID-19 Outbreak.
8. Can you provide examples of recent developments in the market?
N/A
9. What pricing options are available for accessing the report?
Pricing options include single-user, multi-user, and enterprise licenses priced at USD 4750, USD 5250, and USD 8750 respectively.
10. Is the market size provided in terms of value or volume?
The market size is provided in terms of value, measured in million and volume, measured in K Tons.
11. Are there any specific market keywords associated with the report?
Yes, the market keyword associated with the report is "Furfural Solvent Industry," which aids in identifying and referencing the specific market segment covered.
12. How do I determine which pricing option suits my needs best?
The pricing options vary based on user requirements and access needs. Individual users may opt for single-user licenses, while businesses requiring broader access may choose multi-user or enterprise licenses for cost-effective access to the report.
13. Are there any additional resources or data provided in the Furfural Solvent Industry report?
While the report offers comprehensive insights, it's advisable to review the specific contents or supplementary materials provided to ascertain if additional resources or data are available.
14. How can I stay updated on further developments or reports in the Furfural Solvent Industry?
To stay informed about further developments, trends, and reports in the Furfural Solvent Industry, consider subscribing to industry newsletters, following relevant companies and organizations, or regularly checking reputable industry news sources and publications.
Methodology
Step 1 - Identification of Relevant Samples Size from Population Database


Step 2 - Approaches for Defining Global Market Size (Value, Volume* & Price*)

Note*: In applicable scenarios
Step 3 - Data Sources
Primary Research
- Web Analytics
- Survey Reports
- Research Institute
- Latest Research Reports
- Opinion Leaders
Secondary Research
- Annual Reports
- White Paper
- Latest Press Release
- Industry Association
- Paid Database
- Investor Presentations

Step 4 - Data Triangulation
Involves using different sources of information in order to increase the validity of a study
These sources are likely to be stakeholders in a program - participants, other researchers, program staff, other community members, and so on.
Then we put all data in single framework & apply various statistical tools to find out the dynamic on the market.
During the analysis stage, feedback from the stakeholder groups would be compared to determine areas of agreement as well as areas of divergence