

Key Insights
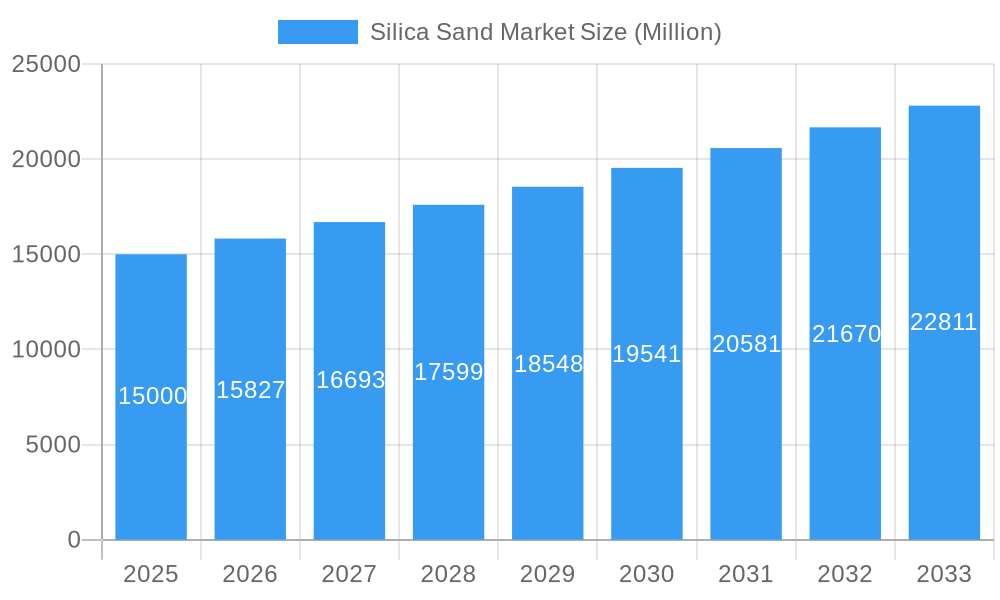
The global silica sand market, estimated at 25.4 billion in 2025, is poised for substantial growth. Projected to expand at a Compound Annual Growth Rate (CAGR) of 4.7% from 2025 to 2033, this upward trajectory is underpinned by several key drivers. The robust expansion of the construction sector, particularly in emerging economies, is a primary demand generator for silica sand in concrete and other essential applications. Concurrently, increasing demand for glass in packaging and automotive manufacturing further fuels market expansion. The oil and gas industry's reliance on silica sand for hydraulic fracturing operations also significantly contributes to its consumption. Advances in silica sand processing and purification technologies are enhancing efficiency and reducing costs, thereby supporting market growth. Key challenges include volatile raw material prices and environmental considerations associated with mining and processing. Effective regulatory compliance and sustainable mining practices are vital for navigating these restraints. The competitive landscape comprises multinational corporations and regional enterprises, with prominent players like U.S. Silica, Sibelco, and Hi-Crush Inc. influencing market dynamics through strategic initiatives. Market segmentation is anticipated across applications (construction, glass, oil & gas), silica sand types (high purity, industrial grade), and geographic regions, with the Asia-Pacific region expected to lead growth due to significant infrastructure development in China and India.
Silica Sand Market Market Size (In Billion)
The forecast period of 2025-2033 indicates sustained growth for the silica sand market, contingent on global economic stability and industry-specific cycles. Expect an increased emphasis on sustainability and responsible sourcing, including initiatives to minimize environmental impact, promote recycling, and enhance supply chain transparency. Technological innovation will remain a critical factor, with processing and purification advancements yielding higher-quality products and optimized operations. This will likely intensify competition, potentially impacting pricing and market consolidation. Companies will focus on diversifying product offerings, exploring novel applications, and expanding into emerging markets to capitalize on growth opportunities.
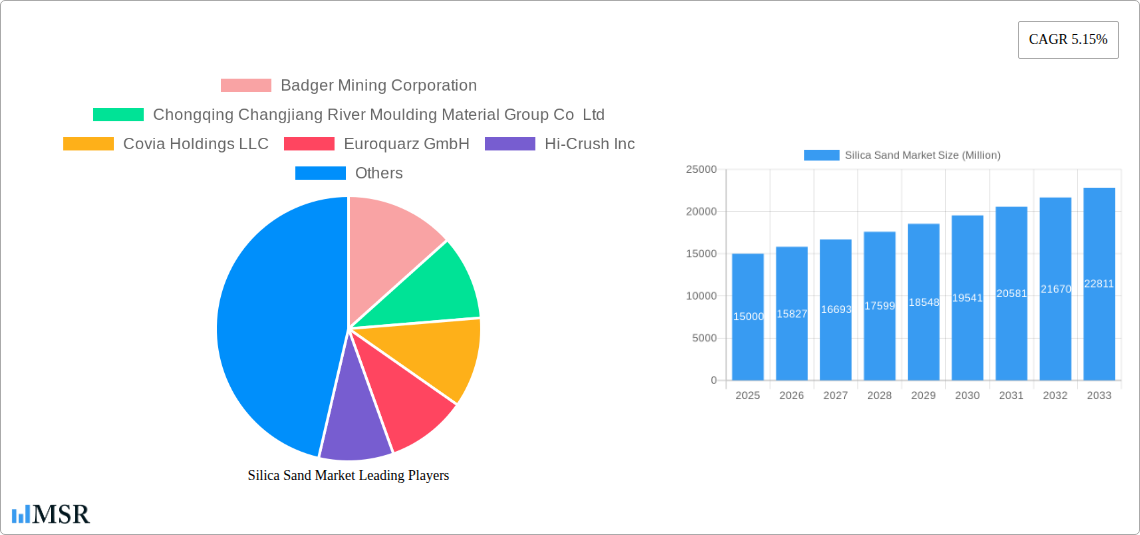
Silica Sand Market Company Market Share
Silica Sand Market: A Comprehensive Analysis (2019-2033)
This in-depth report provides a comprehensive analysis of the global Silica Sand Market, offering invaluable insights for industry stakeholders, investors, and strategic decision-makers. With a study period spanning 2019-2033 (Base Year: 2025, Forecast Period: 2025-2033), this report meticulously examines market dynamics, growth drivers, and emerging opportunities within this crucial sector. The market value is projected to reach xx Million by 2033, exhibiting a CAGR of xx% during the forecast period.
Silica Sand Market Concentration & Dynamics
The Silica Sand Market exhibits a moderately concentrated structure, with a handful of major players holding significant market share. Key players include Badger Mining Corporation, Chongqing Changjiang River Moulding Material Group Co Ltd, Covia Holdings LLC, Euroquarz GmbH, Hi-Crush Inc, JFE Mineral & Alloy Company Ltd, Mitsubishi Corporation, PUM GROUP, Sibelco, Sil Industrial Minerals, Source Energy Services, Superior Silica Sands, Tochu Corporation, and U S Silica. However, several smaller regional players also contribute significantly to the overall market volume.
- Market Share: The top 5 players collectively hold an estimated xx% market share.
- M&A Activity: The market has witnessed considerable M&A activity in recent years, with approximately xx deals recorded between 2019 and 2024. This consolidation trend is expected to continue, driving further market concentration.
- Innovation Ecosystem: The industry is characterized by moderate innovation, primarily focused on improving extraction techniques, enhancing product quality, and expanding applications.
- Regulatory Frameworks: Varying environmental regulations across different regions significantly impact operational costs and market dynamics.
- Substitute Products: Limited direct substitutes exist, but alternative materials are used in niche applications depending on specific requirements.
- End-User Trends: The increasing demand from construction, glass manufacturing, and water filtration industries is a key driver of market growth.
Silica Sand Market Industry Insights & Trends
The global Silica Sand Market is experiencing robust growth, driven by increasing demand from various end-use sectors. The market size was valued at xx Million in 2024 and is projected to reach xx Million by 2033. Key growth drivers include the booming construction industry, particularly in developing economies, and the expanding glass manufacturing sector. Technological advancements in extraction and processing methods are also contributing to increased efficiency and reduced costs. Evolving consumer preferences towards sustainable and eco-friendly products are influencing the market trends. The growth is further fueled by expanding applications in water filtration and other specialized industrial uses.
Key Markets & Segments Leading Silica Sand Market
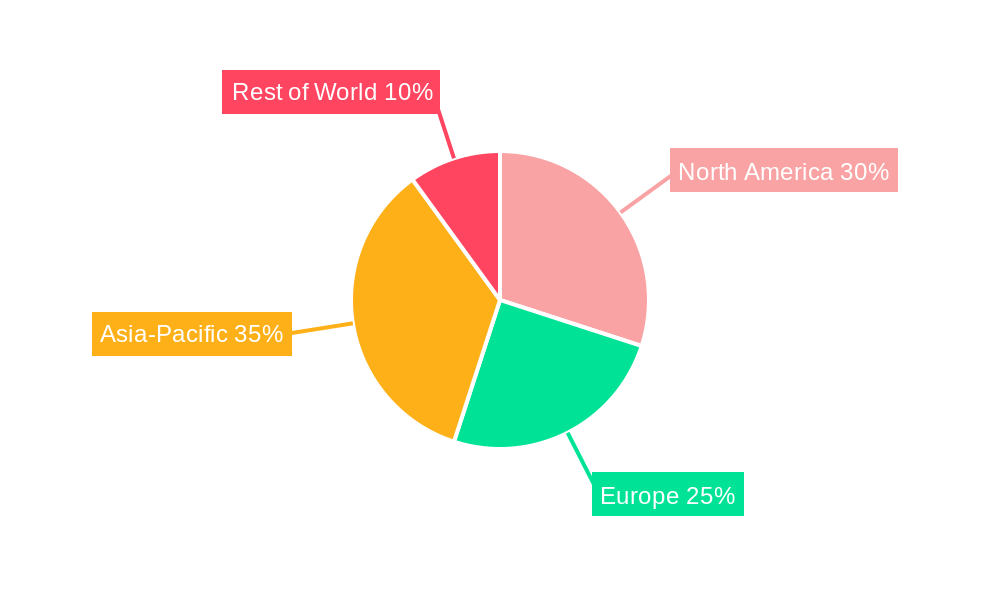
The Asia-Pacific region currently dominates the Silica Sand Market, followed by North America and Europe. China and India are the leading consumers, primarily driven by robust infrastructure development and increasing industrialization.
- Drivers in Asia-Pacific:
- Rapid urbanization and infrastructure development
- Growing glass and construction industries
- Expanding manufacturing sector
- Drivers in North America:
- Oil and gas (frac sand) sector growth (though slowing)
- Construction activity in the US and Canada
- Expanding glass manufacturing
- Dominance Analysis: The Asia-Pacific region’s dominance stems from its massive construction projects, high population density, and burgeoning industrial sector. This region is expected to continue its lead throughout the forecast period.
Silica Sand Market Product Developments
Recent product developments have focused on enhancing the purity and consistency of silica sand, improving its performance characteristics for specific applications. This includes the introduction of advanced processing techniques and the development of specialized silica sand grades tailored to meet the needs of various industries. These advancements enhance product quality and create a competitive edge for producers.
Challenges in the Silica Sand Market Market
The Silica Sand Market faces several challenges, including:
- Fluctuating raw material prices: Impacts profitability and market stability.
- Environmental regulations: Stringent environmental standards increase operational costs.
- Supply chain disruptions: Geopolitical events and logistical issues can hinder supply.
- Intense competition: Large and small players exert pressure on pricing and market share.
Forces Driving Silica Sand Market Growth
Key growth drivers include:
- Construction Boom: Continued infrastructure development globally fuels demand.
- Glass Manufacturing Expansion: Growing demand for glass products in various sectors.
- Technological Advancements: Improved extraction and processing technologies boost efficiency and reduce costs.
- Water Treatment Applications: Increasing use of silica sand in water filtration.
Long-Term Growth Catalysts in the Silica Sand Market
Long-term growth is expected to be fueled by continuous innovation in extraction and processing technologies, strategic partnerships to secure raw material supply, and expansion into emerging markets in Africa and South America. Further development of specialized silica sand grades for niche applications will also drive expansion.
Emerging Opportunities in Silica Sand Market
Emerging opportunities include:
- Expansion in developing markets: Untapped potential in rapidly growing economies.
- Development of specialized applications: New uses in advanced technologies and materials science.
- Sustainable sourcing and processing: Meeting growing demand for eco-friendly materials.
Leading Players in the Silica Sand Market Sector
- Badger Mining Corporation
- Chongqing Changjiang River Moulding Material Group Co Ltd
- Covia Holdings LLC
- Euroquarz GmbH
- Hi-Crush Inc
- JFE Mineral & Alloy Company Ltd
- Mitsubishi Corporation
- PUM GROUP
- Sibelco
- Sil Industrial Minerals
- Source Energy Services
- Superior Silica Sands
- Tochu Corporation
- U S Silica
- List Not Exhaustive
Key Milestones in Silica Sand Market Industry
- July 2022: Sibelco acquired EchasaSA, expanding its European silica sand production capacity and market reach. This acquisition strengthens Sibelco's position in the European market.
- April 2022: Source Energy Services increased its frac sand production by 400,000 metric tons, boosting its market share in the North American oil and gas sector. This expansion demonstrates a strategic move to capitalize on market demand.
Strategic Outlook for Silica Sand Market Market
The Silica Sand Market is poised for sustained growth, driven by long-term trends in infrastructure development, industrial expansion, and technological advancements. Strategic opportunities exist for companies focusing on innovation, sustainable practices, and expansion into new geographical markets. Companies focusing on value-added products and specialized applications are expected to fare better in the long run.
Silica Sand Market Segmentation
-
1. End-user Industry
- 1.1. Glass Manufacturing
- 1.2. Foundry
- 1.3. Chemical Production
- 1.4. Construction
- 1.5. Paints and Coatings
- 1.6. Ceramics and Refractories
- 1.7. Filtration
- 1.8. Oil and Gas
- 1.9. Other End-user Industries
Silica Sand Market Segmentation By Geography
-
1. Asia Pacific
- 1.1. China
- 1.2. India
- 1.3. Japan
- 1.4. South Korea
- 1.5. Rest of Asia Pacific
-
2. North America
- 2.1. United States
- 2.2. Canada
- 2.3. Mexico
-
3. Europe
- 3.1. Germany
- 3.2. United Kingdom
- 3.3. Italy
- 3.4. France
- 3.5. Rest of Europe
-
4. South America
- 4.1. Brazil
- 4.2. Argentina
- 4.3. Rest of South America
-
5. Middle East and Africa
- 5.1. Saudi Arabia
- 5.2. South Africa
- 5.3. Rest of Middle East and Africa
Silica Sand Market Regional Market Share
Geographic Coverage of Silica Sand Market
Silica Sand Market REPORT HIGHLIGHTS
| Aspects | Details |
|---|---|
| Study Period | 2020-2034 |
| Base Year | 2025 |
| Estimated Year | 2026 |
| Forecast Period | 2026-2034 |
| Historical Period | 2020-2025 |
| Growth Rate | CAGR of 4.7% from 2020-2034 |
| Segmentation |
|
Table of Contents
- 1. Introduction
- 1.1. Research Scope
- 1.2. Market Segmentation
- 1.3. Research Objective
- 1.4. Definitions and Assumptions
- 2. Executive Summary
- 2.1. Market Snapshot
- 3. Market Dynamics
- 3.1. Market Drivers
- 3.2. Market Restrains
- 3.3. Market Trends
- 3.4. Market Opportunities
- 4. Market Factor Analysis
- 4.1. Porters Five Forces
- 4.1.1. Bargaining Power of Suppliers
- 4.1.2. Bargaining Power of Buyers
- 4.1.3. Threat of New Entrants
- 4.1.4. Threat of Substitutes
- 4.1.5. Competitive Rivalry
- 4.2. PESTEL analysis
- 4.3. BCG Analysis
- 4.3.1. Stars (High Growth, High Market Share)
- 4.3.2. Cash Cows (Low Growth, High Market Share)
- 4.3.3. Question Mark (High Growth, Low Market Share)
- 4.3.4. Dogs (Low Growth, Low Market Share)
- 4.4. Ansoff Matrix Analysis
- 4.5. Supply Chain Analysis
- 4.6. Regulatory Landscape
- 4.7. Current Market Potential and Opportunity Assessment (TAM–SAM–SOM Framework)
- 4.8. MSR Analyst Note
- 4.1. Porters Five Forces
- 5. Market Analysis, Insights and Forecast 2021-2033
- 5.1. Market Analysis, Insights and Forecast - by End-user Industry
- 5.1.1. Glass Manufacturing
- 5.1.2. Foundry
- 5.1.3. Chemical Production
- 5.1.4. Construction
- 5.1.5. Paints and Coatings
- 5.1.6. Ceramics and Refractories
- 5.1.7. Filtration
- 5.1.8. Oil and Gas
- 5.1.9. Other End-user Industries
- 5.2. Market Analysis, Insights and Forecast - by Region
- 5.2.1. Asia Pacific
- 5.2.2. North America
- 5.2.3. Europe
- 5.2.4. South America
- 5.2.5. Middle East and Africa
- 5.1. Market Analysis, Insights and Forecast - by End-user Industry
- 6. Global Silica Sand Market Analysis, Insights and Forecast, 2021-2033
- 6.1. Market Analysis, Insights and Forecast - by End-user Industry
- 6.1.1. Glass Manufacturing
- 6.1.2. Foundry
- 6.1.3. Chemical Production
- 6.1.4. Construction
- 6.1.5. Paints and Coatings
- 6.1.6. Ceramics and Refractories
- 6.1.7. Filtration
- 6.1.8. Oil and Gas
- 6.1.9. Other End-user Industries
- 6.1. Market Analysis, Insights and Forecast - by End-user Industry
- 7. Asia Pacific Silica Sand Market Analysis, Insights and Forecast, 2020-2032
- 7.1. Market Analysis, Insights and Forecast - by End-user Industry
- 7.1.1. Glass Manufacturing
- 7.1.2. Foundry
- 7.1.3. Chemical Production
- 7.1.4. Construction
- 7.1.5. Paints and Coatings
- 7.1.6. Ceramics and Refractories
- 7.1.7. Filtration
- 7.1.8. Oil and Gas
- 7.1.9. Other End-user Industries
- 7.1. Market Analysis, Insights and Forecast - by End-user Industry
- 8. North America Silica Sand Market Analysis, Insights and Forecast, 2020-2032
- 8.1. Market Analysis, Insights and Forecast - by End-user Industry
- 8.1.1. Glass Manufacturing
- 8.1.2. Foundry
- 8.1.3. Chemical Production
- 8.1.4. Construction
- 8.1.5. Paints and Coatings
- 8.1.6. Ceramics and Refractories
- 8.1.7. Filtration
- 8.1.8. Oil and Gas
- 8.1.9. Other End-user Industries
- 8.1. Market Analysis, Insights and Forecast - by End-user Industry
- 9. Europe Silica Sand Market Analysis, Insights and Forecast, 2020-2032
- 9.1. Market Analysis, Insights and Forecast - by End-user Industry
- 9.1.1. Glass Manufacturing
- 9.1.2. Foundry
- 9.1.3. Chemical Production
- 9.1.4. Construction
- 9.1.5. Paints and Coatings
- 9.1.6. Ceramics and Refractories
- 9.1.7. Filtration
- 9.1.8. Oil and Gas
- 9.1.9. Other End-user Industries
- 9.1. Market Analysis, Insights and Forecast - by End-user Industry
- 10. South America Silica Sand Market Analysis, Insights and Forecast, 2020-2032
- 10.1. Market Analysis, Insights and Forecast - by End-user Industry
- 10.1.1. Glass Manufacturing
- 10.1.2. Foundry
- 10.1.3. Chemical Production
- 10.1.4. Construction
- 10.1.5. Paints and Coatings
- 10.1.6. Ceramics and Refractories
- 10.1.7. Filtration
- 10.1.8. Oil and Gas
- 10.1.9. Other End-user Industries
- 10.1. Market Analysis, Insights and Forecast - by End-user Industry
- 11. Middle East and Africa Silica Sand Market Analysis, Insights and Forecast, 2020-2032
- 11.1. Market Analysis, Insights and Forecast - by End-user Industry
- 11.1.1. Glass Manufacturing
- 11.1.2. Foundry
- 11.1.3. Chemical Production
- 11.1.4. Construction
- 11.1.5. Paints and Coatings
- 11.1.6. Ceramics and Refractories
- 11.1.7. Filtration
- 11.1.8. Oil and Gas
- 11.1.9. Other End-user Industries
- 11.1. Market Analysis, Insights and Forecast - by End-user Industry
- 12. Competitive Analysis
- 12.1. Company Profiles
- 12.1.1 Badger Mining Corporation
- 12.1.1.1. Company Overview
- 12.1.1.2. Products
- 12.1.1.3. Company Financials
- 12.1.1.4. SWOT Analysis
- 12.1.2 Chongqing Changjiang River Moulding Material Group Co Ltd
- 12.1.2.1. Company Overview
- 12.1.2.2. Products
- 12.1.2.3. Company Financials
- 12.1.2.4. SWOT Analysis
- 12.1.3 Covia Holdings LLC
- 12.1.3.1. Company Overview
- 12.1.3.2. Products
- 12.1.3.3. Company Financials
- 12.1.3.4. SWOT Analysis
- 12.1.4 Euroquarz GmbH
- 12.1.4.1. Company Overview
- 12.1.4.2. Products
- 12.1.4.3. Company Financials
- 12.1.4.4. SWOT Analysis
- 12.1.5 Hi-Crush Inc
- 12.1.5.1. Company Overview
- 12.1.5.2. Products
- 12.1.5.3. Company Financials
- 12.1.5.4. SWOT Analysis
- 12.1.6 JFE Mineral & Alloy Company Ltd
- 12.1.6.1. Company Overview
- 12.1.6.2. Products
- 12.1.6.3. Company Financials
- 12.1.6.4. SWOT Analysis
- 12.1.7 Mitsubishi Corporation
- 12.1.7.1. Company Overview
- 12.1.7.2. Products
- 12.1.7.3. Company Financials
- 12.1.7.4. SWOT Analysis
- 12.1.8 PUM GROUP
- 12.1.8.1. Company Overview
- 12.1.8.2. Products
- 12.1.8.3. Company Financials
- 12.1.8.4. SWOT Analysis
- 12.1.9 Sibelco
- 12.1.9.1. Company Overview
- 12.1.9.2. Products
- 12.1.9.3. Company Financials
- 12.1.9.4. SWOT Analysis
- 12.1.10 Sil Industrial Minerals
- 12.1.10.1. Company Overview
- 12.1.10.2. Products
- 12.1.10.3. Company Financials
- 12.1.10.4. SWOT Analysis
- 12.1.11 Source Energy Services
- 12.1.11.1. Company Overview
- 12.1.11.2. Products
- 12.1.11.3. Company Financials
- 12.1.11.4. SWOT Analysis
- 12.1.12 Superior Silica Sands
- 12.1.12.1. Company Overview
- 12.1.12.2. Products
- 12.1.12.3. Company Financials
- 12.1.12.4. SWOT Analysis
- 12.1.13 Tochu Corporation
- 12.1.13.1. Company Overview
- 12.1.13.2. Products
- 12.1.13.3. Company Financials
- 12.1.13.4. SWOT Analysis
- 12.1.14 U S Silica*List Not Exhaustive
- 12.1.14.1. Company Overview
- 12.1.14.2. Products
- 12.1.14.3. Company Financials
- 12.1.14.4. SWOT Analysis
- 12.1.1 Badger Mining Corporation
- 12.2. Market Entropy
- 12.2.1 Company's Key Areas Served
- 12.2.2 Recent Developments
- 12.3. Company Market Share Analysis 2025
- 12.3.1 Top 5 Companies Market Share Analysis
- 12.3.2 Top 3 Companies Market Share Analysis
- 12.4. List of Potential Customers
- 13. Research Methodology
List of Figures
- Figure 1: Global Silica Sand Market Revenue Breakdown (billion, %) by Region 2025 & 2033
- Figure 2: Asia Pacific Silica Sand Market Revenue (billion), by End-user Industry 2025 & 2033
- Figure 3: Asia Pacific Silica Sand Market Revenue Share (%), by End-user Industry 2025 & 2033
- Figure 4: Asia Pacific Silica Sand Market Revenue (billion), by Country 2025 & 2033
- Figure 5: Asia Pacific Silica Sand Market Revenue Share (%), by Country 2025 & 2033
- Figure 6: North America Silica Sand Market Revenue (billion), by End-user Industry 2025 & 2033
- Figure 7: North America Silica Sand Market Revenue Share (%), by End-user Industry 2025 & 2033
- Figure 8: North America Silica Sand Market Revenue (billion), by Country 2025 & 2033
- Figure 9: North America Silica Sand Market Revenue Share (%), by Country 2025 & 2033
- Figure 10: Europe Silica Sand Market Revenue (billion), by End-user Industry 2025 & 2033
- Figure 11: Europe Silica Sand Market Revenue Share (%), by End-user Industry 2025 & 2033
- Figure 12: Europe Silica Sand Market Revenue (billion), by Country 2025 & 2033
- Figure 13: Europe Silica Sand Market Revenue Share (%), by Country 2025 & 2033
- Figure 14: South America Silica Sand Market Revenue (billion), by End-user Industry 2025 & 2033
- Figure 15: South America Silica Sand Market Revenue Share (%), by End-user Industry 2025 & 2033
- Figure 16: South America Silica Sand Market Revenue (billion), by Country 2025 & 2033
- Figure 17: South America Silica Sand Market Revenue Share (%), by Country 2025 & 2033
- Figure 18: Middle East and Africa Silica Sand Market Revenue (billion), by End-user Industry 2025 & 2033
- Figure 19: Middle East and Africa Silica Sand Market Revenue Share (%), by End-user Industry 2025 & 2033
- Figure 20: Middle East and Africa Silica Sand Market Revenue (billion), by Country 2025 & 2033
- Figure 21: Middle East and Africa Silica Sand Market Revenue Share (%), by Country 2025 & 2033
List of Tables
- Table 1: Global Silica Sand Market Revenue billion Forecast, by End-user Industry 2020 & 2033
- Table 2: Global Silica Sand Market Revenue billion Forecast, by Region 2020 & 2033
- Table 3: Global Silica Sand Market Revenue billion Forecast, by End-user Industry 2020 & 2033
- Table 4: Global Silica Sand Market Revenue billion Forecast, by Country 2020 & 2033
- Table 5: China Silica Sand Market Revenue (billion) Forecast, by Application 2020 & 2033
- Table 6: India Silica Sand Market Revenue (billion) Forecast, by Application 2020 & 2033
- Table 7: Japan Silica Sand Market Revenue (billion) Forecast, by Application 2020 & 2033
- Table 8: South Korea Silica Sand Market Revenue (billion) Forecast, by Application 2020 & 2033
- Table 9: Rest of Asia Pacific Silica Sand Market Revenue (billion) Forecast, by Application 2020 & 2033
- Table 10: Global Silica Sand Market Revenue billion Forecast, by End-user Industry 2020 & 2033
- Table 11: Global Silica Sand Market Revenue billion Forecast, by Country 2020 & 2033
- Table 12: United States Silica Sand Market Revenue (billion) Forecast, by Application 2020 & 2033
- Table 13: Canada Silica Sand Market Revenue (billion) Forecast, by Application 2020 & 2033
- Table 14: Mexico Silica Sand Market Revenue (billion) Forecast, by Application 2020 & 2033
- Table 15: Global Silica Sand Market Revenue billion Forecast, by End-user Industry 2020 & 2033
- Table 16: Global Silica Sand Market Revenue billion Forecast, by Country 2020 & 2033
- Table 17: Germany Silica Sand Market Revenue (billion) Forecast, by Application 2020 & 2033
- Table 18: United Kingdom Silica Sand Market Revenue (billion) Forecast, by Application 2020 & 2033
- Table 19: Italy Silica Sand Market Revenue (billion) Forecast, by Application 2020 & 2033
- Table 20: France Silica Sand Market Revenue (billion) Forecast, by Application 2020 & 2033
- Table 21: Rest of Europe Silica Sand Market Revenue (billion) Forecast, by Application 2020 & 2033
- Table 22: Global Silica Sand Market Revenue billion Forecast, by End-user Industry 2020 & 2033
- Table 23: Global Silica Sand Market Revenue billion Forecast, by Country 2020 & 2033
- Table 24: Brazil Silica Sand Market Revenue (billion) Forecast, by Application 2020 & 2033
- Table 25: Argentina Silica Sand Market Revenue (billion) Forecast, by Application 2020 & 2033
- Table 26: Rest of South America Silica Sand Market Revenue (billion) Forecast, by Application 2020 & 2033
- Table 27: Global Silica Sand Market Revenue billion Forecast, by End-user Industry 2020 & 2033
- Table 28: Global Silica Sand Market Revenue billion Forecast, by Country 2020 & 2033
- Table 29: Saudi Arabia Silica Sand Market Revenue (billion) Forecast, by Application 2020 & 2033
- Table 30: South Africa Silica Sand Market Revenue (billion) Forecast, by Application 2020 & 2033
- Table 31: Rest of Middle East and Africa Silica Sand Market Revenue (billion) Forecast, by Application 2020 & 2033
Frequently Asked Questions
1. What is the projected Compound Annual Growth Rate (CAGR) of the Silica Sand Market?
The projected CAGR is approximately 4.7%.
2. Which companies are prominent players in the Silica Sand Market?
Key companies in the market include Badger Mining Corporation, Chongqing Changjiang River Moulding Material Group Co Ltd, Covia Holdings LLC, Euroquarz GmbH, Hi-Crush Inc, JFE Mineral & Alloy Company Ltd, Mitsubishi Corporation, PUM GROUP, Sibelco, Sil Industrial Minerals, Source Energy Services, Superior Silica Sands, Tochu Corporation, U S Silica*List Not Exhaustive.
3. What are the main segments of the Silica Sand Market?
The market segments include End-user Industry.
4. Can you provide details about the market size?
The market size is estimated to be USD 25.4 billion as of 2022.
5. What are some drivers contributing to market growth?
Increasing Demand from the Foundry Industry; Growing Demand from the Glass Industry.
6. What are the notable trends driving market growth?
Oil and Gas Industry to Dominate the Market.
7. Are there any restraints impacting market growth?
Increasing Demand from the Foundry Industry; Growing Demand from the Glass Industry.
8. Can you provide examples of recent developments in the market?
July 2022: Sibelco acquired EchasaSA, a mining company that mines silica sand from the Laminoriaquarry near Vitoria in the Basque Country in northern Spain, 160 kilometers from Sibelco's nearest silica sand quarry in Ariya.
9. What pricing options are available for accessing the report?
Pricing options include single-user, multi-user, and enterprise licenses priced at USD 4750, USD 5250, and USD 8750 respectively.
10. Is the market size provided in terms of value or volume?
The market size is provided in terms of value, measured in billion.
11. Are there any specific market keywords associated with the report?
Yes, the market keyword associated with the report is "Silica Sand Market," which aids in identifying and referencing the specific market segment covered.
12. How do I determine which pricing option suits my needs best?
The pricing options vary based on user requirements and access needs. Individual users may opt for single-user licenses, while businesses requiring broader access may choose multi-user or enterprise licenses for cost-effective access to the report.
13. Are there any additional resources or data provided in the Silica Sand Market report?
While the report offers comprehensive insights, it's advisable to review the specific contents or supplementary materials provided to ascertain if additional resources or data are available.
14. How can I stay updated on further developments or reports in the Silica Sand Market?
To stay informed about further developments, trends, and reports in the Silica Sand Market, consider subscribing to industry newsletters, following relevant companies and organizations, or regularly checking reputable industry news sources and publications.
Methodology
Step 1 - Identification of Relevant Samples Size from Population Database


Step 2 - Approaches for Defining Global Market Size (Value, Volume* & Price*)

Note*: In applicable scenarios
Step 3 - Data Sources
Primary Research
- Web Analytics
- Survey Reports
- Research Institute
- Latest Research Reports
- Opinion Leaders
Secondary Research
- Annual Reports
- White Paper
- Latest Press Release
- Industry Association
- Paid Database
- Investor Presentations

Step 4 - Data Triangulation
Involves using different sources of information in order to increase the validity of a study
These sources are likely to be stakeholders in a program - participants, other researchers, program staff, other community members, and so on.
Then we put all data in single framework & apply various statistical tools to find out the dynamic on the market.
During the analysis stage, feedback from the stakeholder groups would be compared to determine areas of agreement as well as areas of divergence