

Key Insights
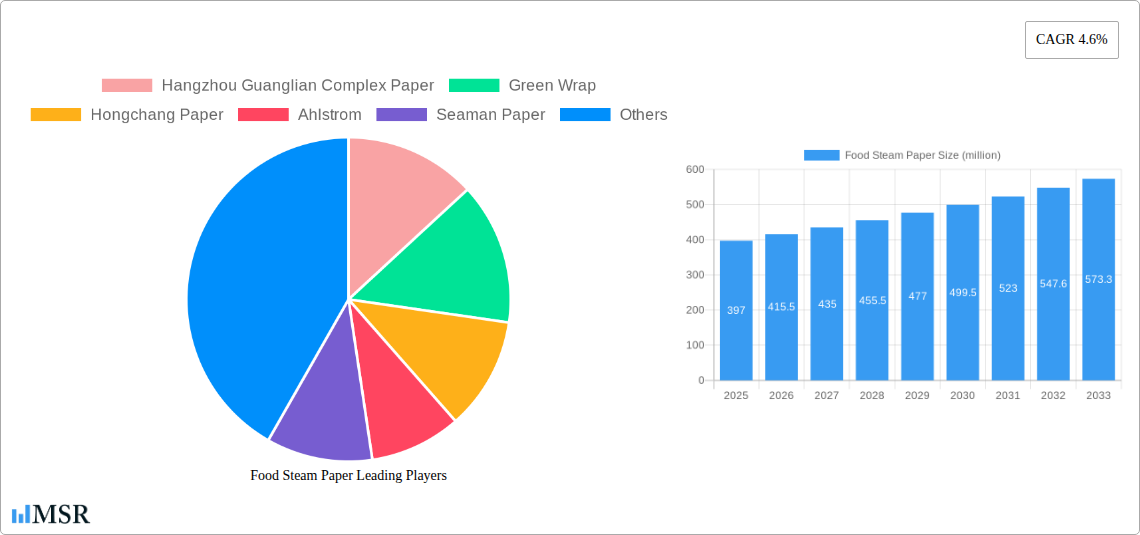
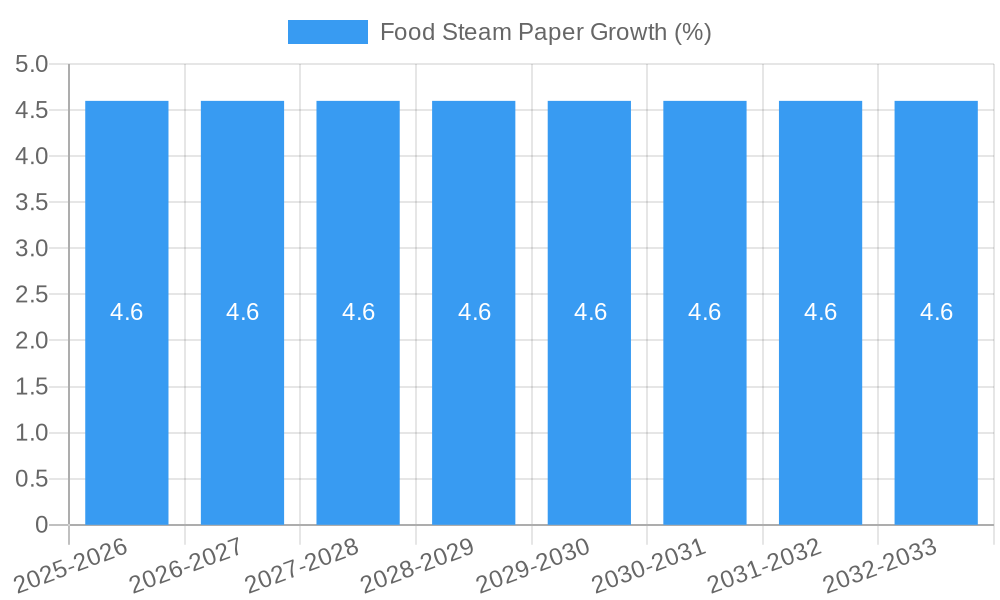
The global Food Steam Paper market is poised for steady growth, projected to reach an estimated \$397 million in value by 2025. This expansion is underpinned by a Compound Annual Growth Rate (CAGR) of 4.6% during the forecast period of 2025-2033. The increasing consumer demand for convenient and healthy cooking methods, particularly steaming, is a primary driver. This trend is amplified by a growing awareness of the health benefits associated with steaming, which preserves nutrients more effectively than other cooking techniques. Furthermore, the food service industry's adoption of steaming for a wide range of cuisines, from dim sum to steamed vegetables, contributes significantly to market uptake. The versatility of food steam paper in applications ranging from home kitchens to large-scale commercial operations and industrial food processing ensures its broad market appeal. Developments in material science are also leading to enhanced food steam paper products with improved heat resistance and non-stick properties, further stimulating demand.
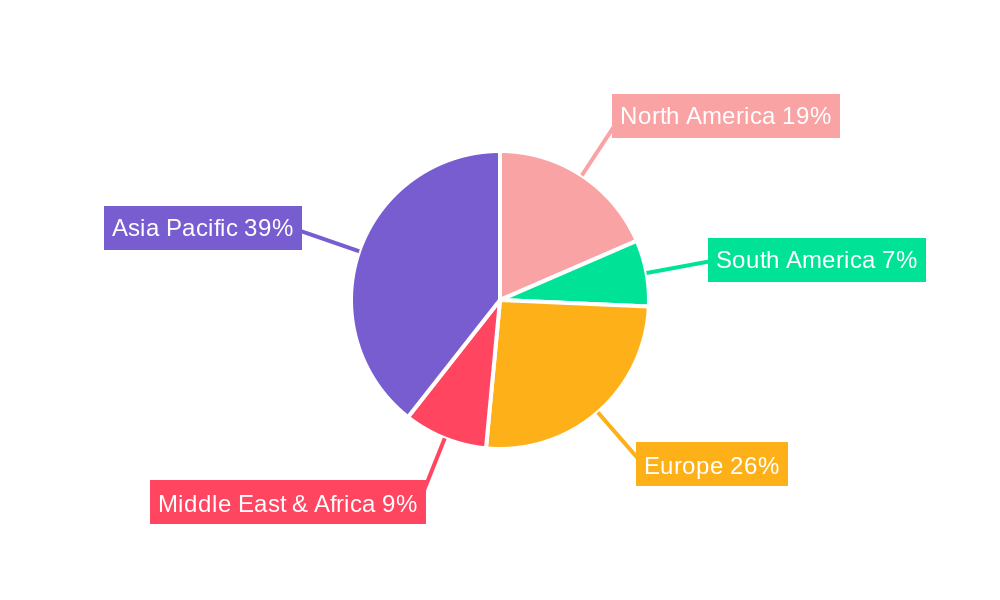
The market segmentation by size, with categories like 5-8 inches and 9-12 inches, caters to diverse culinary needs, from individual portions to bulk preparation. The competitive landscape features key players like Hangzhou Guanglian Complex Paper, Ahlstrom, and KESEE, alongside regional manufacturers, all striving to innovate and capture market share. While the market enjoys robust growth, certain factors could influence its trajectory. Escalating raw material costs for paper production and increasing competition from alternative steaming methods or reusable silicone mats might present challenges. However, the inherent convenience, disposability, and hygienic advantages of food steam paper are expected to outweigh these potential restraints, ensuring sustained market expansion. The Asia Pacific region, particularly China and India, is anticipated to be a significant growth engine due to its large population and increasing adoption of processed and convenient food options.
Food Steam Paper Market: Comprehensive Analysis & Future Outlook (2019-2033)
This in-depth report delivers a definitive analysis of the global food steam paper market, a critical component for home use food steaming, commercial food preparation, and industrial food processing. Dive into key industry developments, market dynamics, emerging trends, and strategic opportunities shaping the food paper industry. With a study period spanning from 2019 to 2033, a base year of 2025, and a forecast period extending to 2033, this report provides actionable insights for stakeholders aiming to capitalize on this growing food packaging solutions sector.
Food Steam Paper Market Concentration & Dynamics
The food steam paper market exhibits a moderate concentration, with several key players like Hangzhou Guanglian Complex Paper, Green Wrap, and Hongchang Paper holding significant market shares, estimated in the hundreds of millions. Innovation ecosystems are driven by companies like Ahlstrom and Seaman Paper, focusing on enhanced grease resistance and temperature stability. Regulatory frameworks primarily revolve around food safety standards and material compliance, ensuring safe food wrapping paper applications. Substitute products, such as reusable silicone liners and direct steaming without paper, present some competitive pressure, though the convenience and disposability of food steam paper maintain its strong market position. End-user trends are increasingly leaning towards convenient, healthy, and quick meal preparation, fueling demand for food steamer liners. Merger and acquisition (M&A) activities have been observed, with an estimated xx deal counts historically, indicating strategic consolidation and expansion efforts to enhance market reach and product portfolios. The market's evolution is closely tied to innovations in eco-friendly food packaging and advanced material science.
Food Steam Paper Industry Insights & Trends
The food steam paper market is poised for robust growth, projected to reach a market size of over $500 million by the estimated year of 2025, with a compelling Compound Annual Growth Rate (CAGR) of approximately 6.5% throughout the forecast period (2025-2033). This upward trajectory is propelled by a confluence of factors, including the escalating demand for convenient and healthy home cooking solutions, a significant rise in the adoption of steaming as a preferred cooking method due to its health benefits, and the expanding food service industry which relies heavily on efficient and hygienic food preparation tools. Technological disruptions are playing a pivotal role, with manufacturers investing in developing specialized food steam papers that offer superior non-stick properties, enhanced breathability for optimal steaming, and improved grease and moisture resistance. This includes advancements in paper coatings and composite materials that cater to diverse culinary applications. Evolving consumer behaviors, particularly the global shift towards healthier lifestyles and an increased awareness of sustainable kitchen essentials, are further bolstering the market. Consumers are actively seeking out products that facilitate quick meal preparation without compromising on health or environmental impact. The convenience offered by disposable steam paper, coupled with its ability to prevent food from sticking to steamers and retain moisture, makes it an indispensable item in both residential kitchens and commercial food establishments. The increasing popularity of online food delivery services and ready-to-eat meals also contributes to the sustained demand for these specialized paper products.
Key Markets & Segments Leading Food Steam Paper
The food steam paper market is experiencing significant growth across various applications and product types. The Commercial Use segment is a dominant force, driven by the expansive food service industry, including restaurants, catering services, and food manufacturers. This segment leverages food steam paper for efficient batch cooking, portion control, and maintaining hygiene during food preparation and service. The growing trend of convenience food and meal kits further amplifies demand within this sector.
- Drivers for Commercial Use Dominance:
- High Volume Demand: Commercial kitchens process a significantly higher volume of food, necessitating bulk purchases of steam paper.
- Operational Efficiency: Steam paper streamlines cooking processes, reduces cleaning time, and ensures consistent product quality, leading to cost savings and improved workflow.
- Hygiene Standards: Adherence to stringent food safety regulations in commercial settings makes disposable steam paper an essential tool for maintaining sanitary conditions.
- Versatility in Cooking: Its application across various steaming methods, from dim sum to vegetables and fish, makes it a versatile ingredient in professional kitchens.
In terms of product types, the 9-12 Inches size segment is leading the market. This size range is ideal for accommodating larger food items, multiple portions, and various steaming apparatus commonly found in commercial kitchens and for family-sized home use. The larger surface area provides greater coverage and protection for a wider array of food products.
- Drivers for 9-12 Inches Dominance:
- Adaptability to Steamer Sizes: These dimensions are compatible with a broad spectrum of commercial steamers, bamboo steamers, and larger pot-lid setups.
- Multi-Portion Steaming: Enables the simultaneous steaming of several food items, enhancing efficiency in busy culinary environments.
- Versatile for Different Foods: Suitable for larger cuts of meat, whole fish, or multiple servings of vegetables and dumplings.
The Home Use segment is also witnessing substantial expansion, fueled by the increasing adoption of healthy cooking practices and the desire for convenient meal solutions. As consumers become more health-conscious, steaming emerges as a preferred cooking method, directly impacting the demand for home use food steaming paper. The accessibility and affordability of these products make them an attractive option for everyday cooking.
- Drivers for Home Use Growth:
- Health and Wellness Trends: Growing awareness of the health benefits of steamed food.
- Convenience and Ease of Use: Simplifies the cooking process and minimizes cleanup.
- Affordability: A cost-effective solution for everyday kitchen needs.
Food Steam Paper Product Developments
Product innovations in the food steam paper market are primarily focused on enhancing performance and sustainability. Manufacturers are developing papers with improved non-stick coatings to prevent food adhesion and facilitate easier handling. Advancements in material science are leading to papers with superior heat resistance and breathability, ensuring optimal steam circulation for perfectly cooked food without becoming soggy. Furthermore, there's a growing emphasis on eco-friendly food packaging solutions, with the introduction of compostable and biodegradable steam papers made from sustainable sources. These developments cater to the increasing consumer demand for environmentally conscious products while maintaining the essential functionalities of grease resistance and moisture retention, offering a competitive edge in the market.
Challenges in the Food Steam Paper Market
Despite its growth, the food steam paper market faces several challenges. Intense competition among numerous manufacturers can lead to price wars and reduced profit margins. Stringent regulatory compliance regarding food contact materials requires continuous investment in testing and certification, adding to production costs. Fluctuations in raw material prices, particularly for pulp and specialty coatings, can impact profitability. Moreover, the growing awareness and adoption of reusable alternatives, such as silicone mats and other sustainable food storage options, pose a potential threat to the market share of disposable steam paper, necessitating a focus on convenience and cost-effectiveness to retain customer loyalty.
Forces Driving Food Steam Paper Growth
Several key forces are driving the growth of the food steam paper market. The global surge in health and wellness trends is a primary catalyst, as steaming is recognized as a healthy cooking method that preserves nutrients. The increasing adoption of convenient meal solutions, including meal kits and ready-to-cook meals, directly boosts demand for efficient food preparation tools like steam paper. Furthermore, the expansion of the global food service industry, encompassing restaurants, cafes, and catering businesses, necessitates high volumes of hygienic and efficient food preparation products. Technological advancements in paper manufacturing, leading to improved performance characteristics such as enhanced non-stick properties and breathability, also contribute significantly to market expansion.
Challenges in the Food Steam Paper Market
The long-term growth of the food steam paper market is underpinned by several key catalysts. Continuous innovation in material science, leading to the development of advanced, eco-friendly, and high-performance food steam papers, will be crucial. Strategic partnerships between paper manufacturers and food technology companies can unlock new applications and market segments. The expanding global reach of the food processing and food service industries, particularly in emerging economies, presents significant opportunities for market penetration and volume growth. Furthermore, the ongoing consumer shift towards healthier and more convenient cooking methods will continue to fuel demand for specialized steam paper products.
Emerging Opportunities in Food Steam Paper
Emerging opportunities in the food steam paper market lie in the development of innovative, sustainable, and specialized products. The growing demand for compostable food packaging presents a significant avenue for growth, with manufacturers exploring biodegradable materials and eco-friendly production processes. The rise of plant-based diets and ethnic cuisines that heavily utilize steaming techniques opens new market segments. Furthermore, the integration of smart functionalities, such as temperature indicators or moisture-release control, could offer unique selling propositions. Expanding into niche markets like home baking and specific dietary cooking applications also holds considerable potential for market expansion and product differentiation.
Leading Players in the Food Steam Paper Sector
- Hangzhou Guanglian Complex Paper
- Green Wrap
- Hongchang Paper
- Ahlstrom
- Seaman Paper
- Fulton
- KESEE
- Helen
- Hangzhou Yisaka Paper
- Xinfei
- YUXUAN
Key Milestones in Food Steam Paper Industry
- 2019: Increased focus on sustainable sourcing for food packaging materials.
- 2020: Introduction of advanced non-stick coatings for improved food release.
- 2021: Rise in demand for home use food steaming paper due to increased home cooking.
- 2022: Development of biodegradable and compostable steam paper options.
- 2023: Expansion of food service industry driving demand for bulk steam paper.
- 2024: Innovations in breathable paper technology for optimal steaming.
- 2025: Projected significant market growth in commercial use food steaming paper.
- 2026-2033: Anticipated continued growth driven by health trends and convenience.
Strategic Outlook for Food Steam Paper Market
The strategic outlook for the food steam paper market is exceptionally positive, characterized by sustained growth fueled by evolving consumer preferences for healthy and convenient food preparation. Key growth accelerators include ongoing product innovation focused on sustainability and enhanced functionality, such as improved grease and moisture resistance. Strategic expansions into burgeoning international markets, particularly in regions with a growing middle class and increasing adoption of Western culinary practices, will be vital. Furthermore, fostering strong collaborations with food manufacturers and food service suppliers to integrate steam paper into diverse product offerings and cooking solutions will further solidify market position and unlock new revenue streams, ensuring continued relevance in the dynamic food packaging solutions landscape.
Food Steam Paper Segmentation
-
1. Application
- 1.1. Home Use
- 1.2. Commercial Use
- 1.3. Industrial Use
-
2. Types
- 2.1. 5-8 Inches
- 2.2. 9-12 Inches
Food Steam Paper Segmentation By Geography
-
1. North America
- 1.1. United States
- 1.2. Canada
- 1.3. Mexico
-
2. South America
- 2.1. Brazil
- 2.2. Argentina
- 2.3. Rest of South America
-
3. Europe
- 3.1. United Kingdom
- 3.2. Germany
- 3.3. France
- 3.4. Italy
- 3.5. Spain
- 3.6. Russia
- 3.7. Benelux
- 3.8. Nordics
- 3.9. Rest of Europe
-
4. Middle East & Africa
- 4.1. Turkey
- 4.2. Israel
- 4.3. GCC
- 4.4. North Africa
- 4.5. South Africa
- 4.6. Rest of Middle East & Africa
-
5. Asia Pacific
- 5.1. China
- 5.2. India
- 5.3. Japan
- 5.4. South Korea
- 5.5. ASEAN
- 5.6. Oceania
- 5.7. Rest of Asia Pacific
Food Steam Paper REPORT HIGHLIGHTS
| Aspects | Details |
|---|---|
| Study Period | 2019-2033 |
| Base Year | 2024 |
| Estimated Year | 2025 |
| Forecast Period | 2025-2033 |
| Historical Period | 2019-2024 |
| Growth Rate | CAGR of 4.6% from 2019-2033 |
| Segmentation |
|
Table of Contents
- 1. Introduction
- 1.1. Research Scope
- 1.2. Market Segmentation
- 1.3. Research Methodology
- 1.4. Definitions and Assumptions
- 2. Executive Summary
- 2.1. Introduction
- 3. Market Dynamics
- 3.1. Introduction
- 3.2. Market Drivers
- 3.3. Market Restrains
- 3.4. Market Trends
- 4. Market Factor Analysis
- 4.1. Porters Five Forces
- 4.2. Supply/Value Chain
- 4.3. PESTEL analysis
- 4.4. Market Entropy
- 4.5. Patent/Trademark Analysis
- 5. Global Food Steam Paper Analysis, Insights and Forecast, 2019-2031
- 5.1. Market Analysis, Insights and Forecast - by Application
- 5.1.1. Home Use
- 5.1.2. Commercial Use
- 5.1.3. Industrial Use
- 5.2. Market Analysis, Insights and Forecast - by Types
- 5.2.1. 5-8 Inches
- 5.2.2. 9-12 Inches
- 5.3. Market Analysis, Insights and Forecast - by Region
- 5.3.1. North America
- 5.3.2. South America
- 5.3.3. Europe
- 5.3.4. Middle East & Africa
- 5.3.5. Asia Pacific
- 5.1. Market Analysis, Insights and Forecast - by Application
- 6. North America Food Steam Paper Analysis, Insights and Forecast, 2019-2031
- 6.1. Market Analysis, Insights and Forecast - by Application
- 6.1.1. Home Use
- 6.1.2. Commercial Use
- 6.1.3. Industrial Use
- 6.2. Market Analysis, Insights and Forecast - by Types
- 6.2.1. 5-8 Inches
- 6.2.2. 9-12 Inches
- 6.1. Market Analysis, Insights and Forecast - by Application
- 7. South America Food Steam Paper Analysis, Insights and Forecast, 2019-2031
- 7.1. Market Analysis, Insights and Forecast - by Application
- 7.1.1. Home Use
- 7.1.2. Commercial Use
- 7.1.3. Industrial Use
- 7.2. Market Analysis, Insights and Forecast - by Types
- 7.2.1. 5-8 Inches
- 7.2.2. 9-12 Inches
- 7.1. Market Analysis, Insights and Forecast - by Application
- 8. Europe Food Steam Paper Analysis, Insights and Forecast, 2019-2031
- 8.1. Market Analysis, Insights and Forecast - by Application
- 8.1.1. Home Use
- 8.1.2. Commercial Use
- 8.1.3. Industrial Use
- 8.2. Market Analysis, Insights and Forecast - by Types
- 8.2.1. 5-8 Inches
- 8.2.2. 9-12 Inches
- 8.1. Market Analysis, Insights and Forecast - by Application
- 9. Middle East & Africa Food Steam Paper Analysis, Insights and Forecast, 2019-2031
- 9.1. Market Analysis, Insights and Forecast - by Application
- 9.1.1. Home Use
- 9.1.2. Commercial Use
- 9.1.3. Industrial Use
- 9.2. Market Analysis, Insights and Forecast - by Types
- 9.2.1. 5-8 Inches
- 9.2.2. 9-12 Inches
- 9.1. Market Analysis, Insights and Forecast - by Application
- 10. Asia Pacific Food Steam Paper Analysis, Insights and Forecast, 2019-2031
- 10.1. Market Analysis, Insights and Forecast - by Application
- 10.1.1. Home Use
- 10.1.2. Commercial Use
- 10.1.3. Industrial Use
- 10.2. Market Analysis, Insights and Forecast - by Types
- 10.2.1. 5-8 Inches
- 10.2.2. 9-12 Inches
- 10.1. Market Analysis, Insights and Forecast - by Application
- 11. Competitive Analysis
- 11.1. Global Market Share Analysis 2024
- 11.2. Company Profiles
- 11.2.1 Hangzhou Guanglian Complex Paper
- 11.2.1.1. Overview
- 11.2.1.2. Products
- 11.2.1.3. SWOT Analysis
- 11.2.1.4. Recent Developments
- 11.2.1.5. Financials (Based on Availability)
- 11.2.2 Green Wrap
- 11.2.2.1. Overview
- 11.2.2.2. Products
- 11.2.2.3. SWOT Analysis
- 11.2.2.4. Recent Developments
- 11.2.2.5. Financials (Based on Availability)
- 11.2.3 Hongchang Paper
- 11.2.3.1. Overview
- 11.2.3.2. Products
- 11.2.3.3. SWOT Analysis
- 11.2.3.4. Recent Developments
- 11.2.3.5. Financials (Based on Availability)
- 11.2.4 Ahlstrom
- 11.2.4.1. Overview
- 11.2.4.2. Products
- 11.2.4.3. SWOT Analysis
- 11.2.4.4. Recent Developments
- 11.2.4.5. Financials (Based on Availability)
- 11.2.5 Seaman Paper
- 11.2.5.1. Overview
- 11.2.5.2. Products
- 11.2.5.3. SWOT Analysis
- 11.2.5.4. Recent Developments
- 11.2.5.5. Financials (Based on Availability)
- 11.2.6 Fulton
- 11.2.6.1. Overview
- 11.2.6.2. Products
- 11.2.6.3. SWOT Analysis
- 11.2.6.4. Recent Developments
- 11.2.6.5. Financials (Based on Availability)
- 11.2.7 KESEE
- 11.2.7.1. Overview
- 11.2.7.2. Products
- 11.2.7.3. SWOT Analysis
- 11.2.7.4. Recent Developments
- 11.2.7.5. Financials (Based on Availability)
- 11.2.8 Helen
- 11.2.8.1. Overview
- 11.2.8.2. Products
- 11.2.8.3. SWOT Analysis
- 11.2.8.4. Recent Developments
- 11.2.8.5. Financials (Based on Availability)
- 11.2.9 Hangzhou Yisaka Paper
- 11.2.9.1. Overview
- 11.2.9.2. Products
- 11.2.9.3. SWOT Analysis
- 11.2.9.4. Recent Developments
- 11.2.9.5. Financials (Based on Availability)
- 11.2.10 Xinfei
- 11.2.10.1. Overview
- 11.2.10.2. Products
- 11.2.10.3. SWOT Analysis
- 11.2.10.4. Recent Developments
- 11.2.10.5. Financials (Based on Availability)
- 11.2.11 YUXUAN
- 11.2.11.1. Overview
- 11.2.11.2. Products
- 11.2.11.3. SWOT Analysis
- 11.2.11.4. Recent Developments
- 11.2.11.5. Financials (Based on Availability)
- 11.2.1 Hangzhou Guanglian Complex Paper
List of Figures
- Figure 1: Global Food Steam Paper Revenue Breakdown (million, %) by Region 2024 & 2032
- Figure 2: Global Food Steam Paper Volume Breakdown (K, %) by Region 2024 & 2032
- Figure 3: North America Food Steam Paper Revenue (million), by Application 2024 & 2032
- Figure 4: North America Food Steam Paper Volume (K), by Application 2024 & 2032
- Figure 5: North America Food Steam Paper Revenue Share (%), by Application 2024 & 2032
- Figure 6: North America Food Steam Paper Volume Share (%), by Application 2024 & 2032
- Figure 7: North America Food Steam Paper Revenue (million), by Types 2024 & 2032
- Figure 8: North America Food Steam Paper Volume (K), by Types 2024 & 2032
- Figure 9: North America Food Steam Paper Revenue Share (%), by Types 2024 & 2032
- Figure 10: North America Food Steam Paper Volume Share (%), by Types 2024 & 2032
- Figure 11: North America Food Steam Paper Revenue (million), by Country 2024 & 2032
- Figure 12: North America Food Steam Paper Volume (K), by Country 2024 & 2032
- Figure 13: North America Food Steam Paper Revenue Share (%), by Country 2024 & 2032
- Figure 14: North America Food Steam Paper Volume Share (%), by Country 2024 & 2032
- Figure 15: South America Food Steam Paper Revenue (million), by Application 2024 & 2032
- Figure 16: South America Food Steam Paper Volume (K), by Application 2024 & 2032
- Figure 17: South America Food Steam Paper Revenue Share (%), by Application 2024 & 2032
- Figure 18: South America Food Steam Paper Volume Share (%), by Application 2024 & 2032
- Figure 19: South America Food Steam Paper Revenue (million), by Types 2024 & 2032
- Figure 20: South America Food Steam Paper Volume (K), by Types 2024 & 2032
- Figure 21: South America Food Steam Paper Revenue Share (%), by Types 2024 & 2032
- Figure 22: South America Food Steam Paper Volume Share (%), by Types 2024 & 2032
- Figure 23: South America Food Steam Paper Revenue (million), by Country 2024 & 2032
- Figure 24: South America Food Steam Paper Volume (K), by Country 2024 & 2032
- Figure 25: South America Food Steam Paper Revenue Share (%), by Country 2024 & 2032
- Figure 26: South America Food Steam Paper Volume Share (%), by Country 2024 & 2032
- Figure 27: Europe Food Steam Paper Revenue (million), by Application 2024 & 2032
- Figure 28: Europe Food Steam Paper Volume (K), by Application 2024 & 2032
- Figure 29: Europe Food Steam Paper Revenue Share (%), by Application 2024 & 2032
- Figure 30: Europe Food Steam Paper Volume Share (%), by Application 2024 & 2032
- Figure 31: Europe Food Steam Paper Revenue (million), by Types 2024 & 2032
- Figure 32: Europe Food Steam Paper Volume (K), by Types 2024 & 2032
- Figure 33: Europe Food Steam Paper Revenue Share (%), by Types 2024 & 2032
- Figure 34: Europe Food Steam Paper Volume Share (%), by Types 2024 & 2032
- Figure 35: Europe Food Steam Paper Revenue (million), by Country 2024 & 2032
- Figure 36: Europe Food Steam Paper Volume (K), by Country 2024 & 2032
- Figure 37: Europe Food Steam Paper Revenue Share (%), by Country 2024 & 2032
- Figure 38: Europe Food Steam Paper Volume Share (%), by Country 2024 & 2032
- Figure 39: Middle East & Africa Food Steam Paper Revenue (million), by Application 2024 & 2032
- Figure 40: Middle East & Africa Food Steam Paper Volume (K), by Application 2024 & 2032
- Figure 41: Middle East & Africa Food Steam Paper Revenue Share (%), by Application 2024 & 2032
- Figure 42: Middle East & Africa Food Steam Paper Volume Share (%), by Application 2024 & 2032
- Figure 43: Middle East & Africa Food Steam Paper Revenue (million), by Types 2024 & 2032
- Figure 44: Middle East & Africa Food Steam Paper Volume (K), by Types 2024 & 2032
- Figure 45: Middle East & Africa Food Steam Paper Revenue Share (%), by Types 2024 & 2032
- Figure 46: Middle East & Africa Food Steam Paper Volume Share (%), by Types 2024 & 2032
- Figure 47: Middle East & Africa Food Steam Paper Revenue (million), by Country 2024 & 2032
- Figure 48: Middle East & Africa Food Steam Paper Volume (K), by Country 2024 & 2032
- Figure 49: Middle East & Africa Food Steam Paper Revenue Share (%), by Country 2024 & 2032
- Figure 50: Middle East & Africa Food Steam Paper Volume Share (%), by Country 2024 & 2032
- Figure 51: Asia Pacific Food Steam Paper Revenue (million), by Application 2024 & 2032
- Figure 52: Asia Pacific Food Steam Paper Volume (K), by Application 2024 & 2032
- Figure 53: Asia Pacific Food Steam Paper Revenue Share (%), by Application 2024 & 2032
- Figure 54: Asia Pacific Food Steam Paper Volume Share (%), by Application 2024 & 2032
- Figure 55: Asia Pacific Food Steam Paper Revenue (million), by Types 2024 & 2032
- Figure 56: Asia Pacific Food Steam Paper Volume (K), by Types 2024 & 2032
- Figure 57: Asia Pacific Food Steam Paper Revenue Share (%), by Types 2024 & 2032
- Figure 58: Asia Pacific Food Steam Paper Volume Share (%), by Types 2024 & 2032
- Figure 59: Asia Pacific Food Steam Paper Revenue (million), by Country 2024 & 2032
- Figure 60: Asia Pacific Food Steam Paper Volume (K), by Country 2024 & 2032
- Figure 61: Asia Pacific Food Steam Paper Revenue Share (%), by Country 2024 & 2032
- Figure 62: Asia Pacific Food Steam Paper Volume Share (%), by Country 2024 & 2032
List of Tables
- Table 1: Global Food Steam Paper Revenue million Forecast, by Region 2019 & 2032
- Table 2: Global Food Steam Paper Volume K Forecast, by Region 2019 & 2032
- Table 3: Global Food Steam Paper Revenue million Forecast, by Application 2019 & 2032
- Table 4: Global Food Steam Paper Volume K Forecast, by Application 2019 & 2032
- Table 5: Global Food Steam Paper Revenue million Forecast, by Types 2019 & 2032
- Table 6: Global Food Steam Paper Volume K Forecast, by Types 2019 & 2032
- Table 7: Global Food Steam Paper Revenue million Forecast, by Region 2019 & 2032
- Table 8: Global Food Steam Paper Volume K Forecast, by Region 2019 & 2032
- Table 9: Global Food Steam Paper Revenue million Forecast, by Application 2019 & 2032
- Table 10: Global Food Steam Paper Volume K Forecast, by Application 2019 & 2032
- Table 11: Global Food Steam Paper Revenue million Forecast, by Types 2019 & 2032
- Table 12: Global Food Steam Paper Volume K Forecast, by Types 2019 & 2032
- Table 13: Global Food Steam Paper Revenue million Forecast, by Country 2019 & 2032
- Table 14: Global Food Steam Paper Volume K Forecast, by Country 2019 & 2032
- Table 15: United States Food Steam Paper Revenue (million) Forecast, by Application 2019 & 2032
- Table 16: United States Food Steam Paper Volume (K) Forecast, by Application 2019 & 2032
- Table 17: Canada Food Steam Paper Revenue (million) Forecast, by Application 2019 & 2032
- Table 18: Canada Food Steam Paper Volume (K) Forecast, by Application 2019 & 2032
- Table 19: Mexico Food Steam Paper Revenue (million) Forecast, by Application 2019 & 2032
- Table 20: Mexico Food Steam Paper Volume (K) Forecast, by Application 2019 & 2032
- Table 21: Global Food Steam Paper Revenue million Forecast, by Application 2019 & 2032
- Table 22: Global Food Steam Paper Volume K Forecast, by Application 2019 & 2032
- Table 23: Global Food Steam Paper Revenue million Forecast, by Types 2019 & 2032
- Table 24: Global Food Steam Paper Volume K Forecast, by Types 2019 & 2032
- Table 25: Global Food Steam Paper Revenue million Forecast, by Country 2019 & 2032
- Table 26: Global Food Steam Paper Volume K Forecast, by Country 2019 & 2032
- Table 27: Brazil Food Steam Paper Revenue (million) Forecast, by Application 2019 & 2032
- Table 28: Brazil Food Steam Paper Volume (K) Forecast, by Application 2019 & 2032
- Table 29: Argentina Food Steam Paper Revenue (million) Forecast, by Application 2019 & 2032
- Table 30: Argentina Food Steam Paper Volume (K) Forecast, by Application 2019 & 2032
- Table 31: Rest of South America Food Steam Paper Revenue (million) Forecast, by Application 2019 & 2032
- Table 32: Rest of South America Food Steam Paper Volume (K) Forecast, by Application 2019 & 2032
- Table 33: Global Food Steam Paper Revenue million Forecast, by Application 2019 & 2032
- Table 34: Global Food Steam Paper Volume K Forecast, by Application 2019 & 2032
- Table 35: Global Food Steam Paper Revenue million Forecast, by Types 2019 & 2032
- Table 36: Global Food Steam Paper Volume K Forecast, by Types 2019 & 2032
- Table 37: Global Food Steam Paper Revenue million Forecast, by Country 2019 & 2032
- Table 38: Global Food Steam Paper Volume K Forecast, by Country 2019 & 2032
- Table 39: United Kingdom Food Steam Paper Revenue (million) Forecast, by Application 2019 & 2032
- Table 40: United Kingdom Food Steam Paper Volume (K) Forecast, by Application 2019 & 2032
- Table 41: Germany Food Steam Paper Revenue (million) Forecast, by Application 2019 & 2032
- Table 42: Germany Food Steam Paper Volume (K) Forecast, by Application 2019 & 2032
- Table 43: France Food Steam Paper Revenue (million) Forecast, by Application 2019 & 2032
- Table 44: France Food Steam Paper Volume (K) Forecast, by Application 2019 & 2032
- Table 45: Italy Food Steam Paper Revenue (million) Forecast, by Application 2019 & 2032
- Table 46: Italy Food Steam Paper Volume (K) Forecast, by Application 2019 & 2032
- Table 47: Spain Food Steam Paper Revenue (million) Forecast, by Application 2019 & 2032
- Table 48: Spain Food Steam Paper Volume (K) Forecast, by Application 2019 & 2032
- Table 49: Russia Food Steam Paper Revenue (million) Forecast, by Application 2019 & 2032
- Table 50: Russia Food Steam Paper Volume (K) Forecast, by Application 2019 & 2032
- Table 51: Benelux Food Steam Paper Revenue (million) Forecast, by Application 2019 & 2032
- Table 52: Benelux Food Steam Paper Volume (K) Forecast, by Application 2019 & 2032
- Table 53: Nordics Food Steam Paper Revenue (million) Forecast, by Application 2019 & 2032
- Table 54: Nordics Food Steam Paper Volume (K) Forecast, by Application 2019 & 2032
- Table 55: Rest of Europe Food Steam Paper Revenue (million) Forecast, by Application 2019 & 2032
- Table 56: Rest of Europe Food Steam Paper Volume (K) Forecast, by Application 2019 & 2032
- Table 57: Global Food Steam Paper Revenue million Forecast, by Application 2019 & 2032
- Table 58: Global Food Steam Paper Volume K Forecast, by Application 2019 & 2032
- Table 59: Global Food Steam Paper Revenue million Forecast, by Types 2019 & 2032
- Table 60: Global Food Steam Paper Volume K Forecast, by Types 2019 & 2032
- Table 61: Global Food Steam Paper Revenue million Forecast, by Country 2019 & 2032
- Table 62: Global Food Steam Paper Volume K Forecast, by Country 2019 & 2032
- Table 63: Turkey Food Steam Paper Revenue (million) Forecast, by Application 2019 & 2032
- Table 64: Turkey Food Steam Paper Volume (K) Forecast, by Application 2019 & 2032
- Table 65: Israel Food Steam Paper Revenue (million) Forecast, by Application 2019 & 2032
- Table 66: Israel Food Steam Paper Volume (K) Forecast, by Application 2019 & 2032
- Table 67: GCC Food Steam Paper Revenue (million) Forecast, by Application 2019 & 2032
- Table 68: GCC Food Steam Paper Volume (K) Forecast, by Application 2019 & 2032
- Table 69: North Africa Food Steam Paper Revenue (million) Forecast, by Application 2019 & 2032
- Table 70: North Africa Food Steam Paper Volume (K) Forecast, by Application 2019 & 2032
- Table 71: South Africa Food Steam Paper Revenue (million) Forecast, by Application 2019 & 2032
- Table 72: South Africa Food Steam Paper Volume (K) Forecast, by Application 2019 & 2032
- Table 73: Rest of Middle East & Africa Food Steam Paper Revenue (million) Forecast, by Application 2019 & 2032
- Table 74: Rest of Middle East & Africa Food Steam Paper Volume (K) Forecast, by Application 2019 & 2032
- Table 75: Global Food Steam Paper Revenue million Forecast, by Application 2019 & 2032
- Table 76: Global Food Steam Paper Volume K Forecast, by Application 2019 & 2032
- Table 77: Global Food Steam Paper Revenue million Forecast, by Types 2019 & 2032
- Table 78: Global Food Steam Paper Volume K Forecast, by Types 2019 & 2032
- Table 79: Global Food Steam Paper Revenue million Forecast, by Country 2019 & 2032
- Table 80: Global Food Steam Paper Volume K Forecast, by Country 2019 & 2032
- Table 81: China Food Steam Paper Revenue (million) Forecast, by Application 2019 & 2032
- Table 82: China Food Steam Paper Volume (K) Forecast, by Application 2019 & 2032
- Table 83: India Food Steam Paper Revenue (million) Forecast, by Application 2019 & 2032
- Table 84: India Food Steam Paper Volume (K) Forecast, by Application 2019 & 2032
- Table 85: Japan Food Steam Paper Revenue (million) Forecast, by Application 2019 & 2032
- Table 86: Japan Food Steam Paper Volume (K) Forecast, by Application 2019 & 2032
- Table 87: South Korea Food Steam Paper Revenue (million) Forecast, by Application 2019 & 2032
- Table 88: South Korea Food Steam Paper Volume (K) Forecast, by Application 2019 & 2032
- Table 89: ASEAN Food Steam Paper Revenue (million) Forecast, by Application 2019 & 2032
- Table 90: ASEAN Food Steam Paper Volume (K) Forecast, by Application 2019 & 2032
- Table 91: Oceania Food Steam Paper Revenue (million) Forecast, by Application 2019 & 2032
- Table 92: Oceania Food Steam Paper Volume (K) Forecast, by Application 2019 & 2032
- Table 93: Rest of Asia Pacific Food Steam Paper Revenue (million) Forecast, by Application 2019 & 2032
- Table 94: Rest of Asia Pacific Food Steam Paper Volume (K) Forecast, by Application 2019 & 2032
Frequently Asked Questions
1. What is the projected Compound Annual Growth Rate (CAGR) of the Food Steam Paper?
The projected CAGR is approximately 4.6%.
2. Which companies are prominent players in the Food Steam Paper?
Key companies in the market include Hangzhou Guanglian Complex Paper, Green Wrap, Hongchang Paper, Ahlstrom, Seaman Paper, Fulton, KESEE, Helen, Hangzhou Yisaka Paper, Xinfei, YUXUAN.
3. What are the main segments of the Food Steam Paper?
The market segments include Application, Types.
4. Can you provide details about the market size?
The market size is estimated to be USD 397 million as of 2022.
5. What are some drivers contributing to market growth?
N/A
6. What are the notable trends driving market growth?
N/A
7. Are there any restraints impacting market growth?
N/A
8. Can you provide examples of recent developments in the market?
N/A
9. What pricing options are available for accessing the report?
Pricing options include single-user, multi-user, and enterprise licenses priced at USD 4350.00, USD 6525.00, and USD 8700.00 respectively.
10. Is the market size provided in terms of value or volume?
The market size is provided in terms of value, measured in million and volume, measured in K.
11. Are there any specific market keywords associated with the report?
Yes, the market keyword associated with the report is "Food Steam Paper," which aids in identifying and referencing the specific market segment covered.
12. How do I determine which pricing option suits my needs best?
The pricing options vary based on user requirements and access needs. Individual users may opt for single-user licenses, while businesses requiring broader access may choose multi-user or enterprise licenses for cost-effective access to the report.
13. Are there any additional resources or data provided in the Food Steam Paper report?
While the report offers comprehensive insights, it's advisable to review the specific contents or supplementary materials provided to ascertain if additional resources or data are available.
14. How can I stay updated on further developments or reports in the Food Steam Paper?
To stay informed about further developments, trends, and reports in the Food Steam Paper, consider subscribing to industry newsletters, following relevant companies and organizations, or regularly checking reputable industry news sources and publications.
Methodology
Step 1 - Identification of Relevant Samples Size from Population Database


Step 2 - Approaches for Defining Global Market Size (Value, Volume* & Price*)

Note*: In applicable scenarios
Step 3 - Data Sources
Primary Research
- Web Analytics
- Survey Reports
- Research Institute
- Latest Research Reports
- Opinion Leaders
Secondary Research
- Annual Reports
- White Paper
- Latest Press Release
- Industry Association
- Paid Database
- Investor Presentations

Step 4 - Data Triangulation
Involves using different sources of information in order to increase the validity of a study
These sources are likely to be stakeholders in a program - participants, other researchers, program staff, other community members, and so on.
Then we put all data in single framework & apply various statistical tools to find out the dynamic on the market.
During the analysis stage, feedback from the stakeholder groups would be compared to determine areas of agreement as well as areas of divergence
