

Key Insights
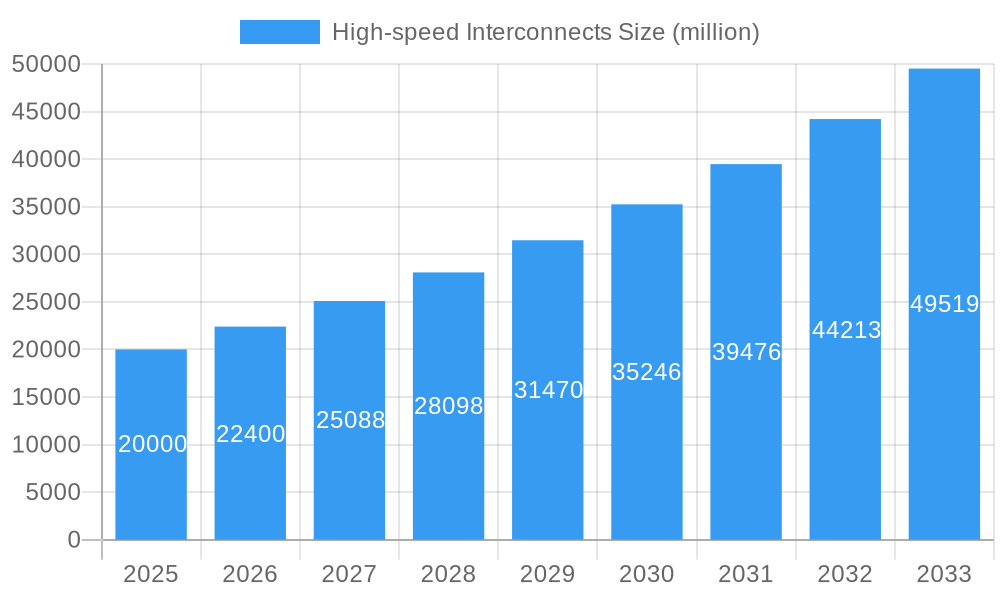
The global High-speed Interconnects market is poised for substantial growth, driven by the ever-increasing demand for faster data transfer and processing capabilities across various industries. With a projected market size of approximately $20,000 million in 2025, the market is anticipated to expand at a Compound Annual Growth Rate (CAGR) of 12% during the forecast period of 2025-2033. This robust expansion is fueled by the relentless advancement in data-intensive applications, the proliferation of 5G networks, and the escalating adoption of cloud computing and AI technologies. Key applications such as Data Centers, Telecom, Consumer Electronics, and Networking and Computing are witnessing unprecedented data traffic, necessitating sophisticated interconnect solutions. Direct Attach Cables (DACs) and Active Optical Cables (AOCs) are emerging as dominant types, offering superior performance, reduced latency, and enhanced signal integrity crucial for these demanding environments.
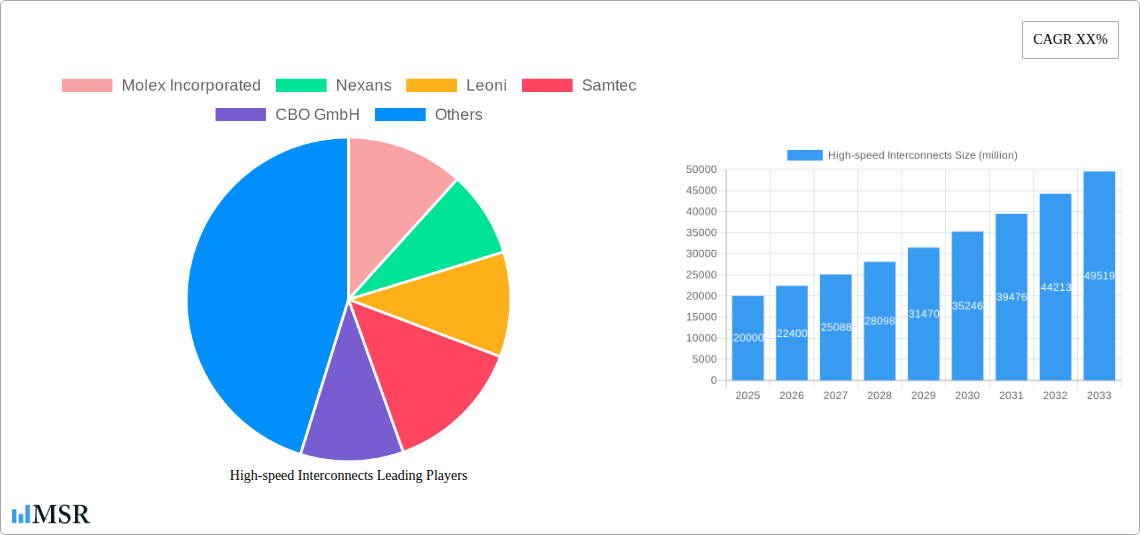
High-speed Interconnects Market Size (In Billion)
The market's growth trajectory is further bolstered by significant investments in infrastructure upgrades by telecommunication companies and the continuous evolution of data center capabilities to handle massive data volumes. Emerging trends like the integration of AI and machine learning within data processing, the growing demand for higher bandwidth in high-performance computing, and the miniaturization of electronic devices are creating new avenues for innovation and market penetration. However, challenges such as the high cost of advanced interconnect technologies and the complexity of integration in existing systems may present moderate restraints. Despite these, the overwhelming need for seamless, high-speed data flow across the digital landscape positions the High-speed Interconnects market for sustained and dynamic growth, with key players continuously innovating to meet evolving industry requirements.
High-speed Interconnects Company Market Share
High-speed Interconnects Market Report: Unlocking Next-Gen Connectivity
Dive deep into the rapidly evolving landscape of high-speed interconnects with this comprehensive industry report. Covering the study period from 2019–2033, with 2025 as the base and estimated year, this analysis provides unparalleled insights into market dynamics, technological advancements, and future growth trajectories. Understand the critical role of high-speed interconnects in powering data centers, telecommunications, consumer electronics, and advanced networking and computing, and gain a competitive edge in this multi-billion dollar market.
High-speed Interconnects Market Concentration & Dynamics
The high-speed interconnects market exhibits a moderately concentrated structure, driven by significant R&D investments and stringent technical performance requirements. Key players such as Molex Incorporated, Nexans, Leoni, Samtec, CBO GmbH, Cisco Systems, Huawei Technologies, Intel, The Siemon Company, Broadcom, FS.COM LIMITED, and NVIDIA Corporation are at the forefront, continuously innovating to meet escalating bandwidth demands. The innovation ecosystem is robust, fueled by collaboration between semiconductor manufacturers, cable providers, and end-users pushing the boundaries of speed and density. Regulatory frameworks, while generally supportive of technological advancement, focus on standardization and interoperability, ensuring seamless integration across diverse applications. Substitute products, such as traditional copper cabling in certain lower-bandwidth scenarios, are increasingly being displaced by advanced solutions like Active Optical Cables (AOCs) and Direct Attach Cables (DACs) for superior performance. End-user trends are sharply focused on enabling AI/ML workloads, 5G deployment, and immersive digital experiences, directly influencing product development and market strategies. Merger and acquisition (M&A) activities, though sporadic, are strategic, aimed at acquiring niche technologies or expanding market reach. For instance, in the historical period (2019-2024), an estimated 15 significant M&A deals valued at over $500 million each have reshaped the competitive landscape, further consolidating expertise and market share among leading entities.
High-speed Interconnects Industry Insights & Trends
The global high-speed interconnects market is poised for unprecedented growth, projected to reach a colossal $55.25 billion by 2025, and continue its upward trajectory to an estimated $110.70 billion by 2033, demonstrating a compound annual growth rate (CAGR) of approximately 9.8% during the forecast period (2025–2033). This robust expansion is underpinned by a confluence of powerful market growth drivers. The insatiable demand for higher bandwidth in data centers, driven by cloud computing, big data analytics, and the proliferation of AI and machine learning applications, is a primary catalyst. Simultaneously, the aggressive rollout of 5G networks worldwide necessitates advanced interconnect solutions for base stations, core networks, and edge computing infrastructure. Consumer electronics, from high-performance gaming consoles to virtual reality devices, are also pushing the envelope for faster and more reliable data transfer.
Technological disruptions are at the heart of this market evolution. The transition from 100GbE to 400GbE and the emerging 800GbE standards are demanding faster signaling rates, lower latency, and greater power efficiency in interconnects. Innovations in materials science, optical transceiver technology, and signal integrity management are critical for achieving these performance benchmarks. Furthermore, the increasing adoption of complex chip-to-chip and board-to-board interconnects within advanced computing systems, including HPC clusters and AI accelerators, is creating new avenues for growth. Evolving consumer behaviors, characterized by an increased reliance on seamless digital experiences, streaming high-definition content, and engaging in bandwidth-intensive online activities, directly translate into a growing demand for robust and high-performance networking infrastructure, which in turn drives the market for advanced interconnects. The historical period (2019–2024) saw the market grow from an estimated $30.1 billion to the current base year value of $55.25 billion, reflecting a strong historical growth trend.
Key Markets & Segments Leading High-speed Interconnects
The Data Centers segment stands as the undisputed leader in the high-speed interconnects market, driven by the exponential growth of cloud computing, AI/ML workloads, and big data analytics. This segment is projected to account for over 55% of the total market revenue in 2025, with an estimated market size of $30.38 billion. The demand for higher bandwidth, lower latency, and increased port density within these facilities for server-to-server, storage, and network connections is relentless.
- Drivers in Data Centers:
- Cloud Infrastructure Expansion: Continuous investment in hyperscale and enterprise data centers to support growing cloud services.
- AI/ML Workload Demand: The computationally intensive nature of AI training and inference requires massive data throughput, directly benefiting high-speed interconnects.
- Big Data Analytics: The need to process and analyze vast datasets necessitates faster data transfer speeds.
- Edge Computing Growth: Decentralization of computing power to the edge requires robust connectivity solutions closer to users.
- Virtualization and Containerization: Increased server utilization and traffic consolidation drive demand for higher-speed network interfaces.
The Telecom segment is the second-largest contributor, expected to reach approximately $15.47 billion in 2025, representing 28% of the market. This growth is primarily fueled by the global deployment of 5G networks, which require significant upgrades in backhaul, fronthaul, and midhaul connectivity. The increasing demand for higher data speeds and lower latency for enhanced mobile broadband, massive machine-type communications, and ultra-reliable low-latency communications is paramount.
- Drivers in Telecom:
- 5G Network Rollout: Extensive infrastructure upgrades are essential to support the bandwidth and latency requirements of 5G.
- Fiber-to-the-Home (FTTH) Expansion: Increasing consumer demand for faster broadband internet drives the deployment of fiber optic networks.
- Network Virtualization (NFV/SDN): These technologies require flexible and high-speed interconnects to manage dynamic traffic flows.
- Growth of IoT Devices: The massive influx of connected devices necessitates a more robust and scalable network infrastructure.
Within Types, Active Optical Cables (AOCs) are a significant growth area, projected to capture over 45% of the market share by 2025, valued at approximately $24.86 billion. Their superior signal integrity over longer distances and immunity to electromagnetic interference make them ideal for data center and telecom applications. Direct Attach Cables (DACs), while typically shorter in reach, remain a cost-effective and high-performance solution for within-rack and server-to-switch connectivity, expected to contribute around $18.55 billion (33.5%) by 2025.
- Dominance Analysis: The dominance of Data Centers and Telecom is directly linked to their foundational role in supporting modern digital economies and communication infrastructures. The sheer volume of data being generated and transmitted within these sectors necessitates constant upgrades and deployments of high-speed interconnect solutions. The increasing adoption of faster Ethernet standards (200GbE, 400GbE, 800GbE) and the corresponding need for high-density, high-performance cabling and transceivers are key factors. The transition towards higher-speed optical solutions like AOCs is driven by their ability to overcome the signal degradation limitations of copper over longer reaches, critical for large data center campuses and extensive telecom networks.
High-speed Interconnects Product Developments
Product development in high-speed interconnects is characterized by a relentless pursuit of increased bandwidth, reduced latency, and enhanced signal integrity. Innovations focus on advanced materials, miniaturization, and improved thermal management to support higher speeds like 800GbE and beyond. Examples include the development of next-generation optical engines, advanced copper cable constructions with improved shielding, and pluggable transceiver modules that offer greater flexibility and density. The market relevance of these developments is critical for enabling the next wave of AI, 5G, and cloud computing advancements.
Challenges in the High-speed Interconnects Market
Despite robust growth, the high-speed interconnects market faces several challenges. High development costs associated with R&D for cutting-edge technologies require substantial capital investment. Supply chain disruptions, as witnessed in recent years, can impact the availability of critical components and lead to price volatility, potentially affecting market growth by an estimated 5-8% annually during such periods. Stringent standardization efforts across various application domains can sometimes slow down the adoption of new technologies, requiring extensive interoperability testing. Furthermore, competitive pricing pressures from established and emerging players can squeeze profit margins, particularly in high-volume segments.
Forces Driving High-speed Interconnects Growth
Several forces are propelling the high-speed interconnects market forward. The increasing demand for bandwidth driven by data-intensive applications like AI, big data, and streaming services is paramount. Technological advancements in semiconductor technology and optical communications enable higher speeds and better performance. The global rollout of 5G networks necessitates significant investment in underlying infrastructure, including advanced interconnects. Government initiatives and investments in digital transformation and smart infrastructure further bolster market growth.
Challenges in the High-speed Interconnects Market
Long-term growth catalysts for the high-speed interconnects market include the continuous evolution of AI and machine learning, which require ever-increasing data processing capabilities and, consequently, faster interconnects. The ongoing expansion of cloud infrastructure and the shift towards distributed cloud architectures will also sustain demand. Furthermore, the development of new applications in areas such as autonomous vehicles, smart cities, and immersive virtual/augmented reality will unlock new markets for advanced interconnect solutions. Partnerships and collaborations between technology providers and end-users are crucial for co-developing solutions tailored to emerging needs.
Emerging Opportunities in High-speed Interconnects
Emerging opportunities lie in the growing demand for high-speed interconnects in specialized applications such as high-performance computing (HPC), financial trading platforms, and medical imaging. The development of advanced packaging technologies, such as chiplets, is creating new requirements for high-density, high-speed interconnects within these advanced semiconductor designs. Furthermore, the expansion of data center infrastructure into new geographic regions and the increasing focus on sustainable and energy-efficient interconnect solutions present significant growth avenues. The evolving consumer preference for ultra-HD content and immersive gaming experiences will also continue to drive demand.
Leading Players in the High-speed Interconnects Sector
- Molex Incorporated
- Nexans
- Leoni
- Samtec
- CBO GmbH
- Cisco Systems
- Huawei Technologies
- Intel
- The Siemon Company
- Broadcom
- FS.COM LIMITED
- NVIDIA Corporation
Key Milestones in High-speed Interconnects Industry
- 2019: Launch of 400GbE Ethernet standards, driving adoption of higher-speed interconnects.
- 2020: Increased investment in data center infrastructure to support remote work and digital services.
- 2021: Significant advancements in optical transceiver technology, enabling higher data rates and lower power consumption.
- 2022: Growing adoption of Active Optical Cables (AOCs) in hyperscale data centers for improved performance and reach.
- 2023: Emergence of 800GbE specifications and early product development.
- 2024: Increased focus on sustainability and energy efficiency in interconnect solutions.
- 2025 (Estimated): Widespread commercial availability of 800GbE solutions.
- 2027 (Projected): Further evolution towards 1.6TbE and beyond.
- 2030 (Projected): Integration of advanced interconnects in mainstream consumer devices.
- 2033 (Projected): Mature market with widespread adoption of multi-terabit interconnects.
Strategic Outlook for High-speed Interconnects Market
The strategic outlook for the high-speed interconnects market is exceptionally bright, driven by an ongoing digital transformation across all sectors. Future market potential lies in the continued evolution of AI, the expansion of 5G and future wireless technologies, and the relentless growth of cloud-native applications. Strategic opportunities will arise from developing ultra-high-speed interconnects (800GbE and beyond) for AI accelerators and supercomputing, enhancing passive and active copper solutions for within-rack connectivity, and innovating in optical interconnects for data center and telecom infrastructure. Companies that focus on miniaturization, power efficiency, and seamless integration will be best positioned for success in this dynamic and rapidly growing market.
High-speed Interconnects Segmentation
-
1. Application
- 1.1. Data Centers
- 1.2. Telecom
- 1.3. Consumer Electronics
- 1.4. Networking and Computing
-
2. Types
- 2.1. Direct Attach Cables
- 2.2. Active Optical Cables
High-speed Interconnects Segmentation By Geography
-
1. North America
- 1.1. United States
- 1.2. Canada
- 1.3. Mexico
-
2. South America
- 2.1. Brazil
- 2.2. Argentina
- 2.3. Rest of South America
-
3. Europe
- 3.1. United Kingdom
- 3.2. Germany
- 3.3. France
- 3.4. Italy
- 3.5. Spain
- 3.6. Russia
- 3.7. Benelux
- 3.8. Nordics
- 3.9. Rest of Europe
-
4. Middle East & Africa
- 4.1. Turkey
- 4.2. Israel
- 4.3. GCC
- 4.4. North Africa
- 4.5. South Africa
- 4.6. Rest of Middle East & Africa
-
5. Asia Pacific
- 5.1. China
- 5.2. India
- 5.3. Japan
- 5.4. South Korea
- 5.5. ASEAN
- 5.6. Oceania
- 5.7. Rest of Asia Pacific
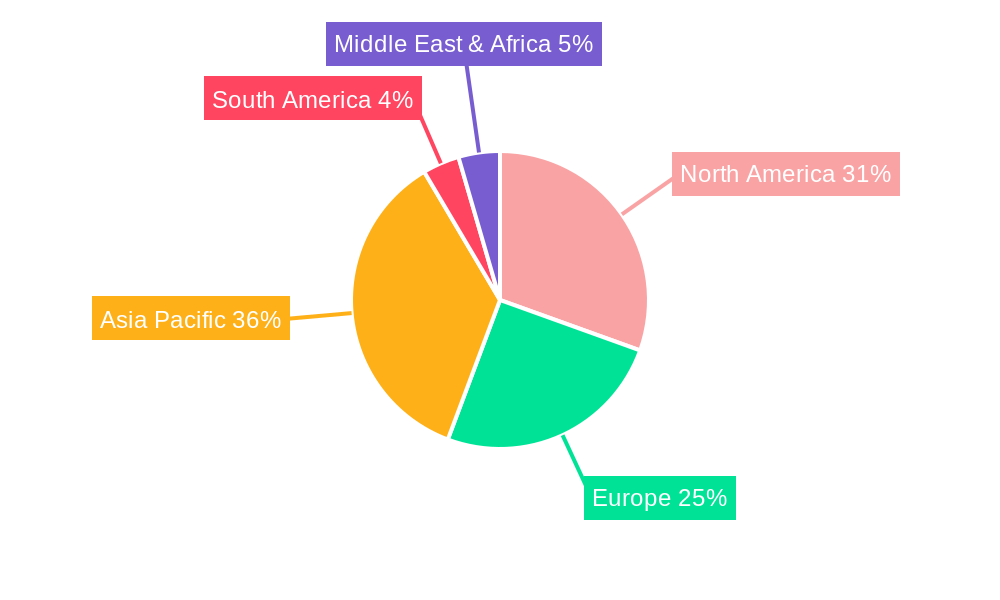
High-speed Interconnects Regional Market Share
Geographic Coverage of High-speed Interconnects
High-speed Interconnects REPORT HIGHLIGHTS
| Aspects | Details |
|---|---|
| Study Period | 2020-2034 |
| Base Year | 2025 |
| Estimated Year | 2026 |
| Forecast Period | 2026-2034 |
| Historical Period | 2020-2025 |
| Growth Rate | CAGR of 8.7% from 2020-2034 |
| Segmentation |
|
Table of Contents
- 1. Introduction
- 1.1. Research Scope
- 1.2. Market Segmentation
- 1.3. Research Methodology
- 1.4. Definitions and Assumptions
- 2. Executive Summary
- 2.1. Introduction
- 3. Market Dynamics
- 3.1. Introduction
- 3.2. Market Drivers
- 3.3. Market Restrains
- 3.4. Market Trends
- 4. Market Factor Analysis
- 4.1. Porters Five Forces
- 4.2. Supply/Value Chain
- 4.3. PESTEL analysis
- 4.4. Market Entropy
- 4.5. Patent/Trademark Analysis
- 5. Global High-speed Interconnects Analysis, Insights and Forecast, 2020-2032
- 5.1. Market Analysis, Insights and Forecast - by Application
- 5.1.1. Data Centers
- 5.1.2. Telecom
- 5.1.3. Consumer Electronics
- 5.1.4. Networking and Computing
- 5.2. Market Analysis, Insights and Forecast - by Types
- 5.2.1. Direct Attach Cables
- 5.2.2. Active Optical Cables
- 5.3. Market Analysis, Insights and Forecast - by Region
- 5.3.1. North America
- 5.3.2. South America
- 5.3.3. Europe
- 5.3.4. Middle East & Africa
- 5.3.5. Asia Pacific
- 5.1. Market Analysis, Insights and Forecast - by Application
- 6. North America High-speed Interconnects Analysis, Insights and Forecast, 2020-2032
- 6.1. Market Analysis, Insights and Forecast - by Application
- 6.1.1. Data Centers
- 6.1.2. Telecom
- 6.1.3. Consumer Electronics
- 6.1.4. Networking and Computing
- 6.2. Market Analysis, Insights and Forecast - by Types
- 6.2.1. Direct Attach Cables
- 6.2.2. Active Optical Cables
- 6.1. Market Analysis, Insights and Forecast - by Application
- 7. South America High-speed Interconnects Analysis, Insights and Forecast, 2020-2032
- 7.1. Market Analysis, Insights and Forecast - by Application
- 7.1.1. Data Centers
- 7.1.2. Telecom
- 7.1.3. Consumer Electronics
- 7.1.4. Networking and Computing
- 7.2. Market Analysis, Insights and Forecast - by Types
- 7.2.1. Direct Attach Cables
- 7.2.2. Active Optical Cables
- 7.1. Market Analysis, Insights and Forecast - by Application
- 8. Europe High-speed Interconnects Analysis, Insights and Forecast, 2020-2032
- 8.1. Market Analysis, Insights and Forecast - by Application
- 8.1.1. Data Centers
- 8.1.2. Telecom
- 8.1.3. Consumer Electronics
- 8.1.4. Networking and Computing
- 8.2. Market Analysis, Insights and Forecast - by Types
- 8.2.1. Direct Attach Cables
- 8.2.2. Active Optical Cables
- 8.1. Market Analysis, Insights and Forecast - by Application
- 9. Middle East & Africa High-speed Interconnects Analysis, Insights and Forecast, 2020-2032
- 9.1. Market Analysis, Insights and Forecast - by Application
- 9.1.1. Data Centers
- 9.1.2. Telecom
- 9.1.3. Consumer Electronics
- 9.1.4. Networking and Computing
- 9.2. Market Analysis, Insights and Forecast - by Types
- 9.2.1. Direct Attach Cables
- 9.2.2. Active Optical Cables
- 9.1. Market Analysis, Insights and Forecast - by Application
- 10. Asia Pacific High-speed Interconnects Analysis, Insights and Forecast, 2020-2032
- 10.1. Market Analysis, Insights and Forecast - by Application
- 10.1.1. Data Centers
- 10.1.2. Telecom
- 10.1.3. Consumer Electronics
- 10.1.4. Networking and Computing
- 10.2. Market Analysis, Insights and Forecast - by Types
- 10.2.1. Direct Attach Cables
- 10.2.2. Active Optical Cables
- 10.1. Market Analysis, Insights and Forecast - by Application
- 11. Competitive Analysis
- 11.1. Global Market Share Analysis 2025
- 11.2. Company Profiles
- 11.2.1 Molex Incorporated
- 11.2.1.1. Overview
- 11.2.1.2. Products
- 11.2.1.3. SWOT Analysis
- 11.2.1.4. Recent Developments
- 11.2.1.5. Financials (Based on Availability)
- 11.2.2 Nexans
- 11.2.2.1. Overview
- 11.2.2.2. Products
- 11.2.2.3. SWOT Analysis
- 11.2.2.4. Recent Developments
- 11.2.2.5. Financials (Based on Availability)
- 11.2.3 Leoni
- 11.2.3.1. Overview
- 11.2.3.2. Products
- 11.2.3.3. SWOT Analysis
- 11.2.3.4. Recent Developments
- 11.2.3.5. Financials (Based on Availability)
- 11.2.4 Samtec
- 11.2.4.1. Overview
- 11.2.4.2. Products
- 11.2.4.3. SWOT Analysis
- 11.2.4.4. Recent Developments
- 11.2.4.5. Financials (Based on Availability)
- 11.2.5 CBO GmbH
- 11.2.5.1. Overview
- 11.2.5.2. Products
- 11.2.5.3. SWOT Analysis
- 11.2.5.4. Recent Developments
- 11.2.5.5. Financials (Based on Availability)
- 11.2.6 Cisco Systems
- 11.2.6.1. Overview
- 11.2.6.2. Products
- 11.2.6.3. SWOT Analysis
- 11.2.6.4. Recent Developments
- 11.2.6.5. Financials (Based on Availability)
- 11.2.7 Huawei Technologies
- 11.2.7.1. Overview
- 11.2.7.2. Products
- 11.2.7.3. SWOT Analysis
- 11.2.7.4. Recent Developments
- 11.2.7.5. Financials (Based on Availability)
- 11.2.8 Intel
- 11.2.8.1. Overview
- 11.2.8.2. Products
- 11.2.8.3. SWOT Analysis
- 11.2.8.4. Recent Developments
- 11.2.8.5. Financials (Based on Availability)
- 11.2.9
- 11.2.9.1. Overview
- 11.2.9.2. Products
- 11.2.9.3. SWOT Analysis
- 11.2.9.4. Recent Developments
- 11.2.9.5. Financials (Based on Availability)
- 11.2.10 The Siemon Company
- 11.2.10.1. Overview
- 11.2.10.2. Products
- 11.2.10.3. SWOT Analysis
- 11.2.10.4. Recent Developments
- 11.2.10.5. Financials (Based on Availability)
- 11.2.11 Broadcom
- 11.2.11.1. Overview
- 11.2.11.2. Products
- 11.2.11.3. SWOT Analysis
- 11.2.11.4. Recent Developments
- 11.2.11.5. Financials (Based on Availability)
- 11.2.12 FS.COM LIMITED
- 11.2.12.1. Overview
- 11.2.12.2. Products
- 11.2.12.3. SWOT Analysis
- 11.2.12.4. Recent Developments
- 11.2.12.5. Financials (Based on Availability)
- 11.2.13 NVIDIA Corporation
- 11.2.13.1. Overview
- 11.2.13.2. Products
- 11.2.13.3. SWOT Analysis
- 11.2.13.4. Recent Developments
- 11.2.13.5. Financials (Based on Availability)
- 11.2.1 Molex Incorporated
List of Figures
- Figure 1: Global High-speed Interconnects Revenue Breakdown (undefined, %) by Region 2025 & 2033
- Figure 2: Global High-speed Interconnects Volume Breakdown (K, %) by Region 2025 & 2033
- Figure 3: North America High-speed Interconnects Revenue (undefined), by Application 2025 & 2033
- Figure 4: North America High-speed Interconnects Volume (K), by Application 2025 & 2033
- Figure 5: North America High-speed Interconnects Revenue Share (%), by Application 2025 & 2033
- Figure 6: North America High-speed Interconnects Volume Share (%), by Application 2025 & 2033
- Figure 7: North America High-speed Interconnects Revenue (undefined), by Types 2025 & 2033
- Figure 8: North America High-speed Interconnects Volume (K), by Types 2025 & 2033
- Figure 9: North America High-speed Interconnects Revenue Share (%), by Types 2025 & 2033
- Figure 10: North America High-speed Interconnects Volume Share (%), by Types 2025 & 2033
- Figure 11: North America High-speed Interconnects Revenue (undefined), by Country 2025 & 2033
- Figure 12: North America High-speed Interconnects Volume (K), by Country 2025 & 2033
- Figure 13: North America High-speed Interconnects Revenue Share (%), by Country 2025 & 2033
- Figure 14: North America High-speed Interconnects Volume Share (%), by Country 2025 & 2033
- Figure 15: South America High-speed Interconnects Revenue (undefined), by Application 2025 & 2033
- Figure 16: South America High-speed Interconnects Volume (K), by Application 2025 & 2033
- Figure 17: South America High-speed Interconnects Revenue Share (%), by Application 2025 & 2033
- Figure 18: South America High-speed Interconnects Volume Share (%), by Application 2025 & 2033
- Figure 19: South America High-speed Interconnects Revenue (undefined), by Types 2025 & 2033
- Figure 20: South America High-speed Interconnects Volume (K), by Types 2025 & 2033
- Figure 21: South America High-speed Interconnects Revenue Share (%), by Types 2025 & 2033
- Figure 22: South America High-speed Interconnects Volume Share (%), by Types 2025 & 2033
- Figure 23: South America High-speed Interconnects Revenue (undefined), by Country 2025 & 2033
- Figure 24: South America High-speed Interconnects Volume (K), by Country 2025 & 2033
- Figure 25: South America High-speed Interconnects Revenue Share (%), by Country 2025 & 2033
- Figure 26: South America High-speed Interconnects Volume Share (%), by Country 2025 & 2033
- Figure 27: Europe High-speed Interconnects Revenue (undefined), by Application 2025 & 2033
- Figure 28: Europe High-speed Interconnects Volume (K), by Application 2025 & 2033
- Figure 29: Europe High-speed Interconnects Revenue Share (%), by Application 2025 & 2033
- Figure 30: Europe High-speed Interconnects Volume Share (%), by Application 2025 & 2033
- Figure 31: Europe High-speed Interconnects Revenue (undefined), by Types 2025 & 2033
- Figure 32: Europe High-speed Interconnects Volume (K), by Types 2025 & 2033
- Figure 33: Europe High-speed Interconnects Revenue Share (%), by Types 2025 & 2033
- Figure 34: Europe High-speed Interconnects Volume Share (%), by Types 2025 & 2033
- Figure 35: Europe High-speed Interconnects Revenue (undefined), by Country 2025 & 2033
- Figure 36: Europe High-speed Interconnects Volume (K), by Country 2025 & 2033
- Figure 37: Europe High-speed Interconnects Revenue Share (%), by Country 2025 & 2033
- Figure 38: Europe High-speed Interconnects Volume Share (%), by Country 2025 & 2033
- Figure 39: Middle East & Africa High-speed Interconnects Revenue (undefined), by Application 2025 & 2033
- Figure 40: Middle East & Africa High-speed Interconnects Volume (K), by Application 2025 & 2033
- Figure 41: Middle East & Africa High-speed Interconnects Revenue Share (%), by Application 2025 & 2033
- Figure 42: Middle East & Africa High-speed Interconnects Volume Share (%), by Application 2025 & 2033
- Figure 43: Middle East & Africa High-speed Interconnects Revenue (undefined), by Types 2025 & 2033
- Figure 44: Middle East & Africa High-speed Interconnects Volume (K), by Types 2025 & 2033
- Figure 45: Middle East & Africa High-speed Interconnects Revenue Share (%), by Types 2025 & 2033
- Figure 46: Middle East & Africa High-speed Interconnects Volume Share (%), by Types 2025 & 2033
- Figure 47: Middle East & Africa High-speed Interconnects Revenue (undefined), by Country 2025 & 2033
- Figure 48: Middle East & Africa High-speed Interconnects Volume (K), by Country 2025 & 2033
- Figure 49: Middle East & Africa High-speed Interconnects Revenue Share (%), by Country 2025 & 2033
- Figure 50: Middle East & Africa High-speed Interconnects Volume Share (%), by Country 2025 & 2033
- Figure 51: Asia Pacific High-speed Interconnects Revenue (undefined), by Application 2025 & 2033
- Figure 52: Asia Pacific High-speed Interconnects Volume (K), by Application 2025 & 2033
- Figure 53: Asia Pacific High-speed Interconnects Revenue Share (%), by Application 2025 & 2033
- Figure 54: Asia Pacific High-speed Interconnects Volume Share (%), by Application 2025 & 2033
- Figure 55: Asia Pacific High-speed Interconnects Revenue (undefined), by Types 2025 & 2033
- Figure 56: Asia Pacific High-speed Interconnects Volume (K), by Types 2025 & 2033
- Figure 57: Asia Pacific High-speed Interconnects Revenue Share (%), by Types 2025 & 2033
- Figure 58: Asia Pacific High-speed Interconnects Volume Share (%), by Types 2025 & 2033
- Figure 59: Asia Pacific High-speed Interconnects Revenue (undefined), by Country 2025 & 2033
- Figure 60: Asia Pacific High-speed Interconnects Volume (K), by Country 2025 & 2033
- Figure 61: Asia Pacific High-speed Interconnects Revenue Share (%), by Country 2025 & 2033
- Figure 62: Asia Pacific High-speed Interconnects Volume Share (%), by Country 2025 & 2033
List of Tables
- Table 1: Global High-speed Interconnects Revenue undefined Forecast, by Application 2020 & 2033
- Table 2: Global High-speed Interconnects Volume K Forecast, by Application 2020 & 2033
- Table 3: Global High-speed Interconnects Revenue undefined Forecast, by Types 2020 & 2033
- Table 4: Global High-speed Interconnects Volume K Forecast, by Types 2020 & 2033
- Table 5: Global High-speed Interconnects Revenue undefined Forecast, by Region 2020 & 2033
- Table 6: Global High-speed Interconnects Volume K Forecast, by Region 2020 & 2033
- Table 7: Global High-speed Interconnects Revenue undefined Forecast, by Application 2020 & 2033
- Table 8: Global High-speed Interconnects Volume K Forecast, by Application 2020 & 2033
- Table 9: Global High-speed Interconnects Revenue undefined Forecast, by Types 2020 & 2033
- Table 10: Global High-speed Interconnects Volume K Forecast, by Types 2020 & 2033
- Table 11: Global High-speed Interconnects Revenue undefined Forecast, by Country 2020 & 2033
- Table 12: Global High-speed Interconnects Volume K Forecast, by Country 2020 & 2033
- Table 13: United States High-speed Interconnects Revenue (undefined) Forecast, by Application 2020 & 2033
- Table 14: United States High-speed Interconnects Volume (K) Forecast, by Application 2020 & 2033
- Table 15: Canada High-speed Interconnects Revenue (undefined) Forecast, by Application 2020 & 2033
- Table 16: Canada High-speed Interconnects Volume (K) Forecast, by Application 2020 & 2033
- Table 17: Mexico High-speed Interconnects Revenue (undefined) Forecast, by Application 2020 & 2033
- Table 18: Mexico High-speed Interconnects Volume (K) Forecast, by Application 2020 & 2033
- Table 19: Global High-speed Interconnects Revenue undefined Forecast, by Application 2020 & 2033
- Table 20: Global High-speed Interconnects Volume K Forecast, by Application 2020 & 2033
- Table 21: Global High-speed Interconnects Revenue undefined Forecast, by Types 2020 & 2033
- Table 22: Global High-speed Interconnects Volume K Forecast, by Types 2020 & 2033
- Table 23: Global High-speed Interconnects Revenue undefined Forecast, by Country 2020 & 2033
- Table 24: Global High-speed Interconnects Volume K Forecast, by Country 2020 & 2033
- Table 25: Brazil High-speed Interconnects Revenue (undefined) Forecast, by Application 2020 & 2033
- Table 26: Brazil High-speed Interconnects Volume (K) Forecast, by Application 2020 & 2033
- Table 27: Argentina High-speed Interconnects Revenue (undefined) Forecast, by Application 2020 & 2033
- Table 28: Argentina High-speed Interconnects Volume (K) Forecast, by Application 2020 & 2033
- Table 29: Rest of South America High-speed Interconnects Revenue (undefined) Forecast, by Application 2020 & 2033
- Table 30: Rest of South America High-speed Interconnects Volume (K) Forecast, by Application 2020 & 2033
- Table 31: Global High-speed Interconnects Revenue undefined Forecast, by Application 2020 & 2033
- Table 32: Global High-speed Interconnects Volume K Forecast, by Application 2020 & 2033
- Table 33: Global High-speed Interconnects Revenue undefined Forecast, by Types 2020 & 2033
- Table 34: Global High-speed Interconnects Volume K Forecast, by Types 2020 & 2033
- Table 35: Global High-speed Interconnects Revenue undefined Forecast, by Country 2020 & 2033
- Table 36: Global High-speed Interconnects Volume K Forecast, by Country 2020 & 2033
- Table 37: United Kingdom High-speed Interconnects Revenue (undefined) Forecast, by Application 2020 & 2033
- Table 38: United Kingdom High-speed Interconnects Volume (K) Forecast, by Application 2020 & 2033
- Table 39: Germany High-speed Interconnects Revenue (undefined) Forecast, by Application 2020 & 2033
- Table 40: Germany High-speed Interconnects Volume (K) Forecast, by Application 2020 & 2033
- Table 41: France High-speed Interconnects Revenue (undefined) Forecast, by Application 2020 & 2033
- Table 42: France High-speed Interconnects Volume (K) Forecast, by Application 2020 & 2033
- Table 43: Italy High-speed Interconnects Revenue (undefined) Forecast, by Application 2020 & 2033
- Table 44: Italy High-speed Interconnects Volume (K) Forecast, by Application 2020 & 2033
- Table 45: Spain High-speed Interconnects Revenue (undefined) Forecast, by Application 2020 & 2033
- Table 46: Spain High-speed Interconnects Volume (K) Forecast, by Application 2020 & 2033
- Table 47: Russia High-speed Interconnects Revenue (undefined) Forecast, by Application 2020 & 2033
- Table 48: Russia High-speed Interconnects Volume (K) Forecast, by Application 2020 & 2033
- Table 49: Benelux High-speed Interconnects Revenue (undefined) Forecast, by Application 2020 & 2033
- Table 50: Benelux High-speed Interconnects Volume (K) Forecast, by Application 2020 & 2033
- Table 51: Nordics High-speed Interconnects Revenue (undefined) Forecast, by Application 2020 & 2033
- Table 52: Nordics High-speed Interconnects Volume (K) Forecast, by Application 2020 & 2033
- Table 53: Rest of Europe High-speed Interconnects Revenue (undefined) Forecast, by Application 2020 & 2033
- Table 54: Rest of Europe High-speed Interconnects Volume (K) Forecast, by Application 2020 & 2033
- Table 55: Global High-speed Interconnects Revenue undefined Forecast, by Application 2020 & 2033
- Table 56: Global High-speed Interconnects Volume K Forecast, by Application 2020 & 2033
- Table 57: Global High-speed Interconnects Revenue undefined Forecast, by Types 2020 & 2033
- Table 58: Global High-speed Interconnects Volume K Forecast, by Types 2020 & 2033
- Table 59: Global High-speed Interconnects Revenue undefined Forecast, by Country 2020 & 2033
- Table 60: Global High-speed Interconnects Volume K Forecast, by Country 2020 & 2033
- Table 61: Turkey High-speed Interconnects Revenue (undefined) Forecast, by Application 2020 & 2033
- Table 62: Turkey High-speed Interconnects Volume (K) Forecast, by Application 2020 & 2033
- Table 63: Israel High-speed Interconnects Revenue (undefined) Forecast, by Application 2020 & 2033
- Table 64: Israel High-speed Interconnects Volume (K) Forecast, by Application 2020 & 2033
- Table 65: GCC High-speed Interconnects Revenue (undefined) Forecast, by Application 2020 & 2033
- Table 66: GCC High-speed Interconnects Volume (K) Forecast, by Application 2020 & 2033
- Table 67: North Africa High-speed Interconnects Revenue (undefined) Forecast, by Application 2020 & 2033
- Table 68: North Africa High-speed Interconnects Volume (K) Forecast, by Application 2020 & 2033
- Table 69: South Africa High-speed Interconnects Revenue (undefined) Forecast, by Application 2020 & 2033
- Table 70: South Africa High-speed Interconnects Volume (K) Forecast, by Application 2020 & 2033
- Table 71: Rest of Middle East & Africa High-speed Interconnects Revenue (undefined) Forecast, by Application 2020 & 2033
- Table 72: Rest of Middle East & Africa High-speed Interconnects Volume (K) Forecast, by Application 2020 & 2033
- Table 73: Global High-speed Interconnects Revenue undefined Forecast, by Application 2020 & 2033
- Table 74: Global High-speed Interconnects Volume K Forecast, by Application 2020 & 2033
- Table 75: Global High-speed Interconnects Revenue undefined Forecast, by Types 2020 & 2033
- Table 76: Global High-speed Interconnects Volume K Forecast, by Types 2020 & 2033
- Table 77: Global High-speed Interconnects Revenue undefined Forecast, by Country 2020 & 2033
- Table 78: Global High-speed Interconnects Volume K Forecast, by Country 2020 & 2033
- Table 79: China High-speed Interconnects Revenue (undefined) Forecast, by Application 2020 & 2033
- Table 80: China High-speed Interconnects Volume (K) Forecast, by Application 2020 & 2033
- Table 81: India High-speed Interconnects Revenue (undefined) Forecast, by Application 2020 & 2033
- Table 82: India High-speed Interconnects Volume (K) Forecast, by Application 2020 & 2033
- Table 83: Japan High-speed Interconnects Revenue (undefined) Forecast, by Application 2020 & 2033
- Table 84: Japan High-speed Interconnects Volume (K) Forecast, by Application 2020 & 2033
- Table 85: South Korea High-speed Interconnects Revenue (undefined) Forecast, by Application 2020 & 2033
- Table 86: South Korea High-speed Interconnects Volume (K) Forecast, by Application 2020 & 2033
- Table 87: ASEAN High-speed Interconnects Revenue (undefined) Forecast, by Application 2020 & 2033
- Table 88: ASEAN High-speed Interconnects Volume (K) Forecast, by Application 2020 & 2033
- Table 89: Oceania High-speed Interconnects Revenue (undefined) Forecast, by Application 2020 & 2033
- Table 90: Oceania High-speed Interconnects Volume (K) Forecast, by Application 2020 & 2033
- Table 91: Rest of Asia Pacific High-speed Interconnects Revenue (undefined) Forecast, by Application 2020 & 2033
- Table 92: Rest of Asia Pacific High-speed Interconnects Volume (K) Forecast, by Application 2020 & 2033
Frequently Asked Questions
1. What is the projected Compound Annual Growth Rate (CAGR) of the High-speed Interconnects?
The projected CAGR is approximately 8.7%.
2. Which companies are prominent players in the High-speed Interconnects?
Key companies in the market include Molex Incorporated, Nexans, Leoni, Samtec, CBO GmbH, Cisco Systems, Huawei Technologies, Intel, , The Siemon Company, Broadcom, FS.COM LIMITED, NVIDIA Corporation.
3. What are the main segments of the High-speed Interconnects?
The market segments include Application, Types.
4. Can you provide details about the market size?
The market size is estimated to be USD XXX N/A as of 2022.
5. What are some drivers contributing to market growth?
N/A
6. What are the notable trends driving market growth?
N/A
7. Are there any restraints impacting market growth?
N/A
8. Can you provide examples of recent developments in the market?
N/A
9. What pricing options are available for accessing the report?
Pricing options include single-user, multi-user, and enterprise licenses priced at USD 3350.00, USD 5025.00, and USD 6700.00 respectively.
10. Is the market size provided in terms of value or volume?
The market size is provided in terms of value, measured in N/A and volume, measured in K.
11. Are there any specific market keywords associated with the report?
Yes, the market keyword associated with the report is "High-speed Interconnects," which aids in identifying and referencing the specific market segment covered.
12. How do I determine which pricing option suits my needs best?
The pricing options vary based on user requirements and access needs. Individual users may opt for single-user licenses, while businesses requiring broader access may choose multi-user or enterprise licenses for cost-effective access to the report.
13. Are there any additional resources or data provided in the High-speed Interconnects report?
While the report offers comprehensive insights, it's advisable to review the specific contents or supplementary materials provided to ascertain if additional resources or data are available.
14. How can I stay updated on further developments or reports in the High-speed Interconnects?
To stay informed about further developments, trends, and reports in the High-speed Interconnects, consider subscribing to industry newsletters, following relevant companies and organizations, or regularly checking reputable industry news sources and publications.
Methodology
Step 1 - Identification of Relevant Samples Size from Population Database


Step 2 - Approaches for Defining Global Market Size (Value, Volume* & Price*)

Note*: In applicable scenarios
Step 3 - Data Sources
Primary Research
- Web Analytics
- Survey Reports
- Research Institute
- Latest Research Reports
- Opinion Leaders
Secondary Research
- Annual Reports
- White Paper
- Latest Press Release
- Industry Association
- Paid Database
- Investor Presentations

Step 4 - Data Triangulation
Involves using different sources of information in order to increase the validity of a study
These sources are likely to be stakeholders in a program - participants, other researchers, program staff, other community members, and so on.
Then we put all data in single framework & apply various statistical tools to find out the dynamic on the market.
During the analysis stage, feedback from the stakeholder groups would be compared to determine areas of agreement as well as areas of divergence