

Key Insights
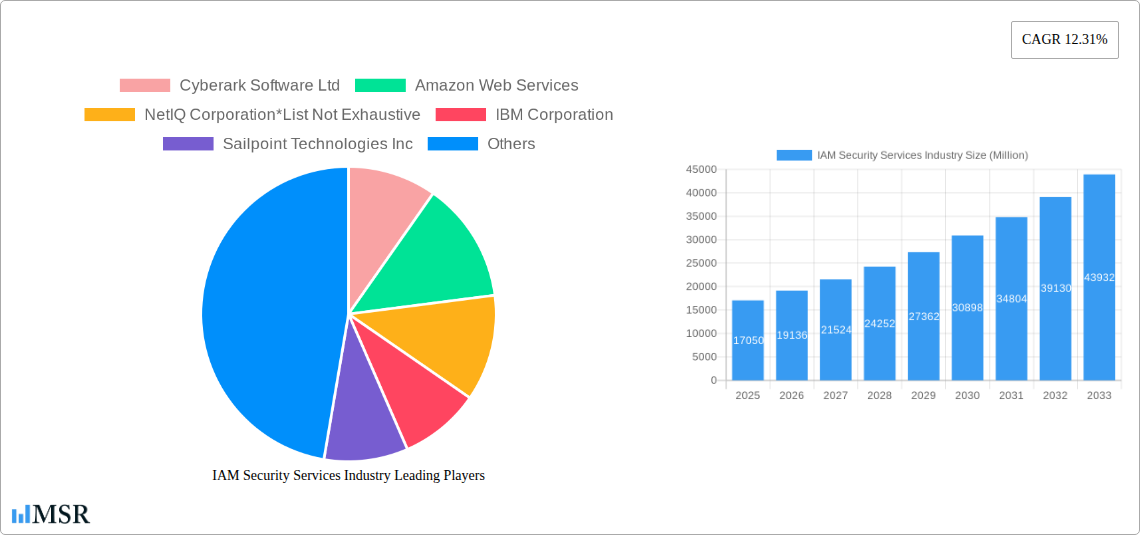
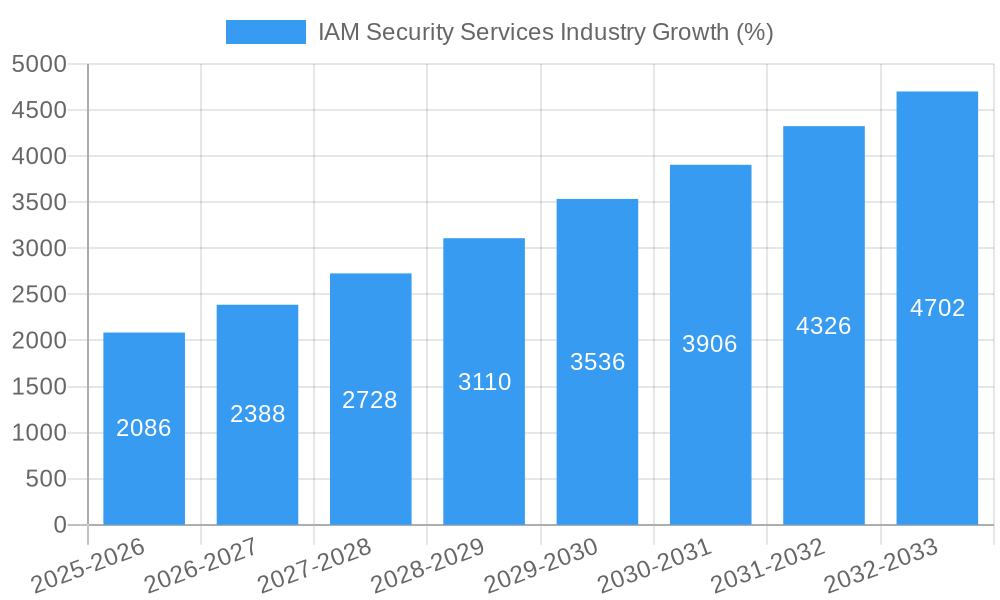
The Identity and Access Management (IAM) security services market is experiencing robust growth, projected to reach \$17.05 billion in 2025 and maintain a Compound Annual Growth Rate (CAGR) of 12.31% from 2025 to 2033. This expansion is driven by the increasing prevalence of cyber threats, stringent data privacy regulations (like GDPR and CCPA), and the rising adoption of cloud computing and remote work models. Businesses across all sectors, particularly BFSI, IT & Telecom, and Healthcare, are prioritizing IAM solutions to secure their digital assets and comply with regulatory mandates. The market is segmented by organization size (large enterprises and SMEs), end-user vertical, solution type (Identity Cloud, Identity Governance and Administration (IGA), Access Management, Directory Services), and deployment type (on-premise, hybrid, and cloud-based). The shift towards cloud-based deployments is a significant trend, fueled by its scalability, cost-effectiveness, and ease of management. Competition is fierce, with established players like Microsoft, IBM, and Okta alongside specialized vendors like CyberArk and Sailpoint vying for market share. While the market faces some restraints, such as the complexity of implementation and integration with existing systems, and the skills gap in IAM expertise, the overall growth trajectory remains positive, driven by the enduring need for robust cybersecurity in an increasingly digital world.
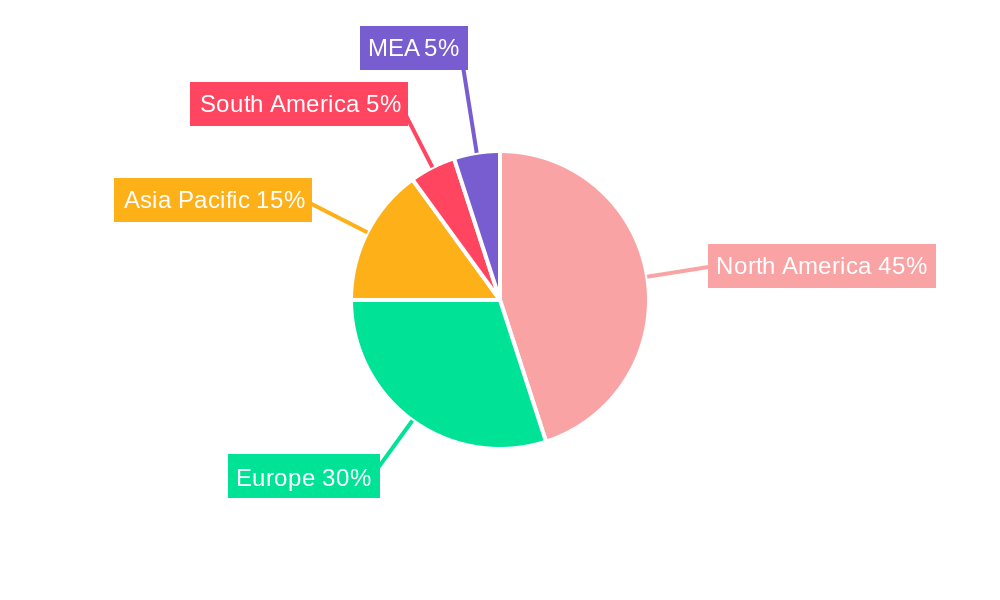
The North American market currently holds a significant share, driven by early adoption of advanced technologies and stringent regulatory frameworks. However, the Asia-Pacific region is expected to witness substantial growth over the forecast period, fueled by increasing digitalization and government initiatives promoting cybersecurity. The continued evolution of IAM solutions, including the integration of artificial intelligence (AI) and machine learning (ML) for improved threat detection and automation, will further fuel market expansion. Furthermore, the increasing demand for secure access to applications and data from diverse devices and locations is driving innovation and the adoption of more sophisticated IAM solutions. The market's long-term outlook remains promising, with continued investment in R&D and a heightened focus on enhancing security posture across various industries.
IAM Security Services Industry Market Report: 2019-2033
This comprehensive report provides a detailed analysis of the Identity and Access Management (IAM) Security Services market, projecting a robust growth trajectory over the forecast period (2025-2033). The report covers market sizing, segmentation, key players, technological advancements, and future opportunities, offering invaluable insights for stakeholders across the IAM security landscape. With a study period spanning 2019-2033 and a base year of 2025, this report is essential for strategic decision-making and investment planning within the $xx Million IAM security services sector.
IAM Security Services Industry Market Concentration & Dynamics
The IAM security services market exhibits a moderately concentrated landscape, with several major players holding significant market share. Companies like CyberArk Software Ltd, Amazon Web Services, Broadcom Inc, Microsoft Corporation, Oracle Corporation, Okta Inc, IBM Corporation, and Sailpoint Technologies Inc dominate the market. However, the presence of numerous smaller players and continuous innovation fosters a dynamic competitive environment.
The market's growth is fueled by increasing cyber threats, stringent data privacy regulations (like GDPR and CCPA), and the growing adoption of cloud computing and remote work. Market share is influenced by factors such as technological innovation, customer support, pricing strategies, and strategic partnerships. Recent M&A activities, as highlighted by the Simeio acquisition of PathMaker Group, showcase the ongoing consolidation and expansion within the sector. The average annual number of M&A deals in the IAM sector during the historical period (2019-2024) was xx, indicating a robust level of consolidation. This trend is expected to continue, driven by the need for expanded capabilities and market reach. Substitute products, such as basic authentication methods, exist, but their limitations in terms of security and scalability are driving adoption of comprehensive IAM solutions. End-user trends indicate a shift toward cloud-based solutions and a growing demand for integrated IAM platforms. The regulatory landscape is constantly evolving, introducing both challenges and opportunities for IAM providers.
IAM Security Services Industry Industry Insights & Trends
The global IAM security services market is experiencing significant growth, with a Compound Annual Growth Rate (CAGR) of xx% during the forecast period (2025-2033). The estimated market size in 2025 is $xx Million, expected to reach $xx Million by 2033. This expansion is primarily driven by several key factors. The increasing prevalence of cyberattacks and data breaches is a major catalyst, forcing organizations to invest heavily in robust IAM solutions to protect their sensitive data. The rising adoption of cloud computing, the proliferation of mobile devices, and the expanding remote workforce are further accelerating market growth. Technological disruptions, such as the adoption of artificial intelligence (AI) and machine learning (ML) for advanced threat detection and automation, are reshaping the IAM landscape. Evolving consumer behaviors, including increased awareness of data privacy and security, are also pushing the demand for sophisticated IAM solutions. The rising adoption of Zero Trust security architecture is playing a crucial role in driving growth. The increasing adoption of multi-factor authentication (MFA) and single sign-on (SSO) technologies continues to improve security posture and enhance user experience.
Key Markets & Segments Leading IAM Security Services Industry
By Organization Size: The large enterprises segment dominates the market, owing to their higher budgets and complex security requirements. SMEs are also showing significant growth, driven by increasing awareness of cybersecurity threats and the availability of cost-effective IAM solutions.
By End-user Vertical: The BFSI (Banking, Financial Services, and Insurance) sector holds the largest market share due to strict regulatory compliance requirements and the high value of financial data. However, other verticals, such as IT & Telecom, Healthcare, and Retail, are also exhibiting substantial growth, reflecting the broad applicability of IAM security services. Drivers for growth within specific verticals include:
- BFSI: Stringent regulatory compliance, high value of financial data.
- IT & Telecom: Protection of sensitive customer data and infrastructure.
- Healthcare: Compliance with HIPAA and other regulations, protection of patient data.
- Retail: Protection of customer data and payment information.
- Energy: Securing critical infrastructure and operational data.
- Manufacturing: Protection of intellectual property and operational data.
By Type of Solutions: Identity Governance and Access Management (IGAM) solutions currently hold the largest market share due to their comprehensive functionality. However, Identity Cloud solutions are rapidly gaining traction due to their scalability and flexibility. Directory Services continue to play a crucial role in the IAM ecosystem.
By Type of Deployment: Cloud-based deployments are gaining significant popularity due to their cost-effectiveness and scalability. However, on-premise and hybrid deployments remain relevant for organizations with specific security or compliance requirements.
IAM Security Services Industry Product Developments
Recent product innovations have focused on enhancing security, improving user experience, and simplifying deployment. The integration of AI and ML for threat detection and automation is a key trend, enabling more proactive and efficient security management. The rise of passwordless authentication and behavioral biometrics also improves security and usability. These advancements provide competitive advantages by offering enhanced security, improved usability, and better integration with other security solutions.
Challenges in the IAM Security Services Industry Market
The IAM security services market faces several challenges. Regulatory compliance requirements vary across different jurisdictions, posing complexities for global providers. Supply chain disruptions can affect the availability of hardware and software components. Intense competition from established players and new entrants creates price pressures and necessitates continuous innovation. These factors collectively impact market growth and profitability, requiring companies to adapt strategically.
Forces Driving IAM Security Services Industry Growth
Technological advancements, such as AI and ML, are driving significant growth in the IAM security services market. Economic factors, including increased investment in cybersecurity and digital transformation, are also contributing to market expansion. Furthermore, evolving regulatory landscapes and heightened data privacy concerns are pushing organizations to adopt more robust IAM solutions. The growth of cloud computing and the adoption of Zero Trust security models are also major drivers.
Long-Term Growth Catalysts in the IAM Security Services Industry
Long-term growth in the IAM security services industry is catalyzed by continuous innovation in authentication technologies, expanded partnerships between IAM providers and other security vendors, and the market expansion into new and emerging regions with growing digital adoption rates. The increased demand for advanced security capabilities and user experience will drive development and adoption of new solutions.
Emerging Opportunities in IAM Security Services Industry
Emerging opportunities lie in the expanding adoption of passwordless authentication technologies, the integration of IAM solutions with other security tools (e.g., SIEM, SOAR), and the growth of the IoT (Internet of Things) security market, requiring innovative IAM solutions to manage access control across a wider range of devices. Expanding into less developed markets also holds significant potential.
Leading Players in the IAM Security Services Industry Sector
- CyberArk Software Ltd
- Amazon Web Services
- NetIQ Corporation
- IBM Corporation
- Sailpoint Technologies Inc
- Broadcom Inc
- Microsoft Corporation
- HID Global Corporation
- Oracle Corporation
- Centrify Corporation
- Okta Inc
Key Milestones in IAM Security Services Industry Industry
January 2023: Saviynt raised USD 205 Million in growth financing, signaling strong investor confidence in the converged identity platform market and its future growth.
January 2023: Simeio's acquisition of PathMaker Group expands Simeio's market reach and capabilities in identity orchestration and automation, consolidating the market further.
Strategic Outlook for IAM Security Services Industry Market
The IAM security services market is poised for continued strong growth, driven by increasing cybersecurity threats, regulatory pressures, and the expanding adoption of cloud and mobile technologies. Strategic opportunities lie in developing innovative solutions that address emerging security challenges, such as those posed by quantum computing and AI-driven attacks. Partnerships and collaborations will be crucial for success, allowing companies to leverage complementary technologies and expand their market reach. Focus on user experience and seamless integration with other security tools will also be key to capturing market share.
IAM Security Services Industry Segmentation
-
1. Type of Solutions
- 1.1. Identity Cloud
- 1.2. Identity Governance
- 1.3. Access Management
- 1.4. Directory Services
- 1.5. Other Type of Solutions
-
2. Type of Deployment
- 2.1. On-premise
- 2.2. Hybrid
- 2.3. Cloud-based
-
3. Organization Size
- 3.1. Large Enterprises
- 3.2. Small & Medium Enterprises (SMEs)
-
4. End-user Vertical
- 4.1. BFSI
- 4.2. IT & Telecom
- 4.3. Education
- 4.4. Healthcare
- 4.5. Retail
- 4.6. Energy
- 4.7. Manufacturing
- 4.8. Other End-user Vertical
IAM Security Services Industry Segmentation By Geography
-
1. North America
- 1.1. US
- 1.2. Canada
-
2. Europe
- 2.1. UK
- 2.2. Germany
- 2.3. France
- 2.4. Rest of Europe
-
3. Asia Pacific
- 3.1. China
- 3.2. Japan
- 3.3. India
- 3.4. Rest of Asia Pacific
-
4. Latin America
- 4.1. Brazil
- 4.2. Mexico
- 4.3. Rest of Latin America
-
5. Middle East and Africa
- 5.1. Saudi Arabia
- 5.2. UAE
- 5.3. Rest of Middle East and Africa
IAM Security Services Industry REPORT HIGHLIGHTS
| Aspects | Details |
|---|---|
| Study Period | 2019-2033 |
| Base Year | 2024 |
| Estimated Year | 2025 |
| Forecast Period | 2025-2033 |
| Historical Period | 2019-2024 |
| Growth Rate | CAGR of 12.31% from 2019-2033 |
| Segmentation |
|
Table of Contents
- 1. Introduction
- 1.1. Research Scope
- 1.2. Market Segmentation
- 1.3. Research Methodology
- 1.4. Definitions and Assumptions
- 2. Executive Summary
- 2.1. Introduction
- 3. Market Dynamics
- 3.1. Introduction
- 3.2. Market Drivers
- 3.2.1. Increasing Security Concerns; Increasing Number of Cyber Data Breaches
- 3.3. Market Restrains
- 3.3.1. High Costs of Security Solution; Complexity in Integration with Existing Network
- 3.4. Market Trends
- 3.4.1. The IT & Telecom Segment is Expected to Register a Strong Growth
- 4. Market Factor Analysis
- 4.1. Porters Five Forces
- 4.2. Supply/Value Chain
- 4.3. PESTEL analysis
- 4.4. Market Entropy
- 4.5. Patent/Trademark Analysis
- 5. Global IAM Security Services Industry Analysis, Insights and Forecast, 2019-2031
- 5.1. Market Analysis, Insights and Forecast - by Type of Solutions
- 5.1.1. Identity Cloud
- 5.1.2. Identity Governance
- 5.1.3. Access Management
- 5.1.4. Directory Services
- 5.1.5. Other Type of Solutions
- 5.2. Market Analysis, Insights and Forecast - by Type of Deployment
- 5.2.1. On-premise
- 5.2.2. Hybrid
- 5.2.3. Cloud-based
- 5.3. Market Analysis, Insights and Forecast - by Organization Size
- 5.3.1. Large Enterprises
- 5.3.2. Small & Medium Enterprises (SMEs)
- 5.4. Market Analysis, Insights and Forecast - by End-user Vertical
- 5.4.1. BFSI
- 5.4.2. IT & Telecom
- 5.4.3. Education
- 5.4.4. Healthcare
- 5.4.5. Retail
- 5.4.6. Energy
- 5.4.7. Manufacturing
- 5.4.8. Other End-user Vertical
- 5.5. Market Analysis, Insights and Forecast - by Region
- 5.5.1. North America
- 5.5.2. Europe
- 5.5.3. Asia Pacific
- 5.5.4. Latin America
- 5.5.5. Middle East and Africa
- 5.1. Market Analysis, Insights and Forecast - by Type of Solutions
- 6. North America IAM Security Services Industry Analysis, Insights and Forecast, 2019-2031
- 6.1. Market Analysis, Insights and Forecast - by Type of Solutions
- 6.1.1. Identity Cloud
- 6.1.2. Identity Governance
- 6.1.3. Access Management
- 6.1.4. Directory Services
- 6.1.5. Other Type of Solutions
- 6.2. Market Analysis, Insights and Forecast - by Type of Deployment
- 6.2.1. On-premise
- 6.2.2. Hybrid
- 6.2.3. Cloud-based
- 6.3. Market Analysis, Insights and Forecast - by Organization Size
- 6.3.1. Large Enterprises
- 6.3.2. Small & Medium Enterprises (SMEs)
- 6.4. Market Analysis, Insights and Forecast - by End-user Vertical
- 6.4.1. BFSI
- 6.4.2. IT & Telecom
- 6.4.3. Education
- 6.4.4. Healthcare
- 6.4.5. Retail
- 6.4.6. Energy
- 6.4.7. Manufacturing
- 6.4.8. Other End-user Vertical
- 6.1. Market Analysis, Insights and Forecast - by Type of Solutions
- 7. Europe IAM Security Services Industry Analysis, Insights and Forecast, 2019-2031
- 7.1. Market Analysis, Insights and Forecast - by Type of Solutions
- 7.1.1. Identity Cloud
- 7.1.2. Identity Governance
- 7.1.3. Access Management
- 7.1.4. Directory Services
- 7.1.5. Other Type of Solutions
- 7.2. Market Analysis, Insights and Forecast - by Type of Deployment
- 7.2.1. On-premise
- 7.2.2. Hybrid
- 7.2.3. Cloud-based
- 7.3. Market Analysis, Insights and Forecast - by Organization Size
- 7.3.1. Large Enterprises
- 7.3.2. Small & Medium Enterprises (SMEs)
- 7.4. Market Analysis, Insights and Forecast - by End-user Vertical
- 7.4.1. BFSI
- 7.4.2. IT & Telecom
- 7.4.3. Education
- 7.4.4. Healthcare
- 7.4.5. Retail
- 7.4.6. Energy
- 7.4.7. Manufacturing
- 7.4.8. Other End-user Vertical
- 7.1. Market Analysis, Insights and Forecast - by Type of Solutions
- 8. Asia Pacific IAM Security Services Industry Analysis, Insights and Forecast, 2019-2031
- 8.1. Market Analysis, Insights and Forecast - by Type of Solutions
- 8.1.1. Identity Cloud
- 8.1.2. Identity Governance
- 8.1.3. Access Management
- 8.1.4. Directory Services
- 8.1.5. Other Type of Solutions
- 8.2. Market Analysis, Insights and Forecast - by Type of Deployment
- 8.2.1. On-premise
- 8.2.2. Hybrid
- 8.2.3. Cloud-based
- 8.3. Market Analysis, Insights and Forecast - by Organization Size
- 8.3.1. Large Enterprises
- 8.3.2. Small & Medium Enterprises (SMEs)
- 8.4. Market Analysis, Insights and Forecast - by End-user Vertical
- 8.4.1. BFSI
- 8.4.2. IT & Telecom
- 8.4.3. Education
- 8.4.4. Healthcare
- 8.4.5. Retail
- 8.4.6. Energy
- 8.4.7. Manufacturing
- 8.4.8. Other End-user Vertical
- 8.1. Market Analysis, Insights and Forecast - by Type of Solutions
- 9. Latin America IAM Security Services Industry Analysis, Insights and Forecast, 2019-2031
- 9.1. Market Analysis, Insights and Forecast - by Type of Solutions
- 9.1.1. Identity Cloud
- 9.1.2. Identity Governance
- 9.1.3. Access Management
- 9.1.4. Directory Services
- 9.1.5. Other Type of Solutions
- 9.2. Market Analysis, Insights and Forecast - by Type of Deployment
- 9.2.1. On-premise
- 9.2.2. Hybrid
- 9.2.3. Cloud-based
- 9.3. Market Analysis, Insights and Forecast - by Organization Size
- 9.3.1. Large Enterprises
- 9.3.2. Small & Medium Enterprises (SMEs)
- 9.4. Market Analysis, Insights and Forecast - by End-user Vertical
- 9.4.1. BFSI
- 9.4.2. IT & Telecom
- 9.4.3. Education
- 9.4.4. Healthcare
- 9.4.5. Retail
- 9.4.6. Energy
- 9.4.7. Manufacturing
- 9.4.8. Other End-user Vertical
- 9.1. Market Analysis, Insights and Forecast - by Type of Solutions
- 10. Middle East and Africa IAM Security Services Industry Analysis, Insights and Forecast, 2019-2031
- 10.1. Market Analysis, Insights and Forecast - by Type of Solutions
- 10.1.1. Identity Cloud
- 10.1.2. Identity Governance
- 10.1.3. Access Management
- 10.1.4. Directory Services
- 10.1.5. Other Type of Solutions
- 10.2. Market Analysis, Insights and Forecast - by Type of Deployment
- 10.2.1. On-premise
- 10.2.2. Hybrid
- 10.2.3. Cloud-based
- 10.3. Market Analysis, Insights and Forecast - by Organization Size
- 10.3.1. Large Enterprises
- 10.3.2. Small & Medium Enterprises (SMEs)
- 10.4. Market Analysis, Insights and Forecast - by End-user Vertical
- 10.4.1. BFSI
- 10.4.2. IT & Telecom
- 10.4.3. Education
- 10.4.4. Healthcare
- 10.4.5. Retail
- 10.4.6. Energy
- 10.4.7. Manufacturing
- 10.4.8. Other End-user Vertical
- 10.1. Market Analysis, Insights and Forecast - by Type of Solutions
- 11. North America IAM Security Services Industry Analysis, Insights and Forecast, 2019-2031
- 11.1. Market Analysis, Insights and Forecast - By Country/Sub-region
- 11.1.1 United States
- 11.1.2 Canada
- 11.1.3 Mexico
- 12. Europe IAM Security Services Industry Analysis, Insights and Forecast, 2019-2031
- 12.1. Market Analysis, Insights and Forecast - By Country/Sub-region
- 12.1.1 Germany
- 12.1.2 United Kingdom
- 12.1.3 France
- 12.1.4 Spain
- 12.1.5 Italy
- 12.1.6 Spain
- 12.1.7 Belgium
- 12.1.8 Netherland
- 12.1.9 Nordics
- 12.1.10 Rest of Europe
- 13. Asia Pacific IAM Security Services Industry Analysis, Insights and Forecast, 2019-2031
- 13.1. Market Analysis, Insights and Forecast - By Country/Sub-region
- 13.1.1 China
- 13.1.2 Japan
- 13.1.3 India
- 13.1.4 South Korea
- 13.1.5 Southeast Asia
- 13.1.6 Australia
- 13.1.7 Indonesia
- 13.1.8 Phillipes
- 13.1.9 Singapore
- 13.1.10 Thailandc
- 13.1.11 Rest of Asia Pacific
- 14. South America IAM Security Services Industry Analysis, Insights and Forecast, 2019-2031
- 14.1. Market Analysis, Insights and Forecast - By Country/Sub-region
- 14.1.1 Brazil
- 14.1.2 Argentina
- 14.1.3 Peru
- 14.1.4 Chile
- 14.1.5 Colombia
- 14.1.6 Ecuador
- 14.1.7 Venezuela
- 14.1.8 Rest of South America
- 15. North America IAM Security Services Industry Analysis, Insights and Forecast, 2019-2031
- 15.1. Market Analysis, Insights and Forecast - By Country/Sub-region
- 15.1.1 United States
- 15.1.2 Canada
- 15.1.3 Mexico
- 16. MEA IAM Security Services Industry Analysis, Insights and Forecast, 2019-2031
- 16.1. Market Analysis, Insights and Forecast - By Country/Sub-region
- 16.1.1 United Arab Emirates
- 16.1.2 Saudi Arabia
- 16.1.3 South Africa
- 16.1.4 Rest of Middle East and Africa
- 17. Competitive Analysis
- 17.1. Global Market Share Analysis 2024
- 17.2. Company Profiles
- 17.2.1 Cyberark Software Ltd
- 17.2.1.1. Overview
- 17.2.1.2. Products
- 17.2.1.3. SWOT Analysis
- 17.2.1.4. Recent Developments
- 17.2.1.5. Financials (Based on Availability)
- 17.2.2 Amazon Web Services
- 17.2.2.1. Overview
- 17.2.2.2. Products
- 17.2.2.3. SWOT Analysis
- 17.2.2.4. Recent Developments
- 17.2.2.5. Financials (Based on Availability)
- 17.2.3 NetIQ Corporation*List Not Exhaustive
- 17.2.3.1. Overview
- 17.2.3.2. Products
- 17.2.3.3. SWOT Analysis
- 17.2.3.4. Recent Developments
- 17.2.3.5. Financials (Based on Availability)
- 17.2.4 IBM Corporation
- 17.2.4.1. Overview
- 17.2.4.2. Products
- 17.2.4.3. SWOT Analysis
- 17.2.4.4. Recent Developments
- 17.2.4.5. Financials (Based on Availability)
- 17.2.5 Sailpoint Technologies Inc
- 17.2.5.1. Overview
- 17.2.5.2. Products
- 17.2.5.3. SWOT Analysis
- 17.2.5.4. Recent Developments
- 17.2.5.5. Financials (Based on Availability)
- 17.2.6 Broadcom Inc
- 17.2.6.1. Overview
- 17.2.6.2. Products
- 17.2.6.3. SWOT Analysis
- 17.2.6.4. Recent Developments
- 17.2.6.5. Financials (Based on Availability)
- 17.2.7 Microsoft Corporation
- 17.2.7.1. Overview
- 17.2.7.2. Products
- 17.2.7.3. SWOT Analysis
- 17.2.7.4. Recent Developments
- 17.2.7.5. Financials (Based on Availability)
- 17.2.8 HID Global Corporation
- 17.2.8.1. Overview
- 17.2.8.2. Products
- 17.2.8.3. SWOT Analysis
- 17.2.8.4. Recent Developments
- 17.2.8.5. Financials (Based on Availability)
- 17.2.9 Oracle Corporation
- 17.2.9.1. Overview
- 17.2.9.2. Products
- 17.2.9.3. SWOT Analysis
- 17.2.9.4. Recent Developments
- 17.2.9.5. Financials (Based on Availability)
- 17.2.10 Centrify Corporation
- 17.2.10.1. Overview
- 17.2.10.2. Products
- 17.2.10.3. SWOT Analysis
- 17.2.10.4. Recent Developments
- 17.2.10.5. Financials (Based on Availability)
- 17.2.11 Okta Inc
- 17.2.11.1. Overview
- 17.2.11.2. Products
- 17.2.11.3. SWOT Analysis
- 17.2.11.4. Recent Developments
- 17.2.11.5. Financials (Based on Availability)
- 17.2.1 Cyberark Software Ltd
List of Figures
- Figure 1: Global IAM Security Services Industry Revenue Breakdown (Million, %) by Region 2024 & 2032
- Figure 2: North America IAM Security Services Industry Revenue (Million), by Country 2024 & 2032
- Figure 3: North America IAM Security Services Industry Revenue Share (%), by Country 2024 & 2032
- Figure 4: Europe IAM Security Services Industry Revenue (Million), by Country 2024 & 2032
- Figure 5: Europe IAM Security Services Industry Revenue Share (%), by Country 2024 & 2032
- Figure 6: Asia Pacific IAM Security Services Industry Revenue (Million), by Country 2024 & 2032
- Figure 7: Asia Pacific IAM Security Services Industry Revenue Share (%), by Country 2024 & 2032
- Figure 8: South America IAM Security Services Industry Revenue (Million), by Country 2024 & 2032
- Figure 9: South America IAM Security Services Industry Revenue Share (%), by Country 2024 & 2032
- Figure 10: North America IAM Security Services Industry Revenue (Million), by Country 2024 & 2032
- Figure 11: North America IAM Security Services Industry Revenue Share (%), by Country 2024 & 2032
- Figure 12: MEA IAM Security Services Industry Revenue (Million), by Country 2024 & 2032
- Figure 13: MEA IAM Security Services Industry Revenue Share (%), by Country 2024 & 2032
- Figure 14: North America IAM Security Services Industry Revenue (Million), by Type of Solutions 2024 & 2032
- Figure 15: North America IAM Security Services Industry Revenue Share (%), by Type of Solutions 2024 & 2032
- Figure 16: North America IAM Security Services Industry Revenue (Million), by Type of Deployment 2024 & 2032
- Figure 17: North America IAM Security Services Industry Revenue Share (%), by Type of Deployment 2024 & 2032
- Figure 18: North America IAM Security Services Industry Revenue (Million), by Organization Size 2024 & 2032
- Figure 19: North America IAM Security Services Industry Revenue Share (%), by Organization Size 2024 & 2032
- Figure 20: North America IAM Security Services Industry Revenue (Million), by End-user Vertical 2024 & 2032
- Figure 21: North America IAM Security Services Industry Revenue Share (%), by End-user Vertical 2024 & 2032
- Figure 22: North America IAM Security Services Industry Revenue (Million), by Country 2024 & 2032
- Figure 23: North America IAM Security Services Industry Revenue Share (%), by Country 2024 & 2032
- Figure 24: Europe IAM Security Services Industry Revenue (Million), by Type of Solutions 2024 & 2032
- Figure 25: Europe IAM Security Services Industry Revenue Share (%), by Type of Solutions 2024 & 2032
- Figure 26: Europe IAM Security Services Industry Revenue (Million), by Type of Deployment 2024 & 2032
- Figure 27: Europe IAM Security Services Industry Revenue Share (%), by Type of Deployment 2024 & 2032
- Figure 28: Europe IAM Security Services Industry Revenue (Million), by Organization Size 2024 & 2032
- Figure 29: Europe IAM Security Services Industry Revenue Share (%), by Organization Size 2024 & 2032
- Figure 30: Europe IAM Security Services Industry Revenue (Million), by End-user Vertical 2024 & 2032
- Figure 31: Europe IAM Security Services Industry Revenue Share (%), by End-user Vertical 2024 & 2032
- Figure 32: Europe IAM Security Services Industry Revenue (Million), by Country 2024 & 2032
- Figure 33: Europe IAM Security Services Industry Revenue Share (%), by Country 2024 & 2032
- Figure 34: Asia Pacific IAM Security Services Industry Revenue (Million), by Type of Solutions 2024 & 2032
- Figure 35: Asia Pacific IAM Security Services Industry Revenue Share (%), by Type of Solutions 2024 & 2032
- Figure 36: Asia Pacific IAM Security Services Industry Revenue (Million), by Type of Deployment 2024 & 2032
- Figure 37: Asia Pacific IAM Security Services Industry Revenue Share (%), by Type of Deployment 2024 & 2032
- Figure 38: Asia Pacific IAM Security Services Industry Revenue (Million), by Organization Size 2024 & 2032
- Figure 39: Asia Pacific IAM Security Services Industry Revenue Share (%), by Organization Size 2024 & 2032
- Figure 40: Asia Pacific IAM Security Services Industry Revenue (Million), by End-user Vertical 2024 & 2032
- Figure 41: Asia Pacific IAM Security Services Industry Revenue Share (%), by End-user Vertical 2024 & 2032
- Figure 42: Asia Pacific IAM Security Services Industry Revenue (Million), by Country 2024 & 2032
- Figure 43: Asia Pacific IAM Security Services Industry Revenue Share (%), by Country 2024 & 2032
- Figure 44: Latin America IAM Security Services Industry Revenue (Million), by Type of Solutions 2024 & 2032
- Figure 45: Latin America IAM Security Services Industry Revenue Share (%), by Type of Solutions 2024 & 2032
- Figure 46: Latin America IAM Security Services Industry Revenue (Million), by Type of Deployment 2024 & 2032
- Figure 47: Latin America IAM Security Services Industry Revenue Share (%), by Type of Deployment 2024 & 2032
- Figure 48: Latin America IAM Security Services Industry Revenue (Million), by Organization Size 2024 & 2032
- Figure 49: Latin America IAM Security Services Industry Revenue Share (%), by Organization Size 2024 & 2032
- Figure 50: Latin America IAM Security Services Industry Revenue (Million), by End-user Vertical 2024 & 2032
- Figure 51: Latin America IAM Security Services Industry Revenue Share (%), by End-user Vertical 2024 & 2032
- Figure 52: Latin America IAM Security Services Industry Revenue (Million), by Country 2024 & 2032
- Figure 53: Latin America IAM Security Services Industry Revenue Share (%), by Country 2024 & 2032
- Figure 54: Middle East and Africa IAM Security Services Industry Revenue (Million), by Type of Solutions 2024 & 2032
- Figure 55: Middle East and Africa IAM Security Services Industry Revenue Share (%), by Type of Solutions 2024 & 2032
- Figure 56: Middle East and Africa IAM Security Services Industry Revenue (Million), by Type of Deployment 2024 & 2032
- Figure 57: Middle East and Africa IAM Security Services Industry Revenue Share (%), by Type of Deployment 2024 & 2032
- Figure 58: Middle East and Africa IAM Security Services Industry Revenue (Million), by Organization Size 2024 & 2032
- Figure 59: Middle East and Africa IAM Security Services Industry Revenue Share (%), by Organization Size 2024 & 2032
- Figure 60: Middle East and Africa IAM Security Services Industry Revenue (Million), by End-user Vertical 2024 & 2032
- Figure 61: Middle East and Africa IAM Security Services Industry Revenue Share (%), by End-user Vertical 2024 & 2032
- Figure 62: Middle East and Africa IAM Security Services Industry Revenue (Million), by Country 2024 & 2032
- Figure 63: Middle East and Africa IAM Security Services Industry Revenue Share (%), by Country 2024 & 2032
List of Tables
- Table 1: Global IAM Security Services Industry Revenue Million Forecast, by Region 2019 & 2032
- Table 2: Global IAM Security Services Industry Revenue Million Forecast, by Type of Solutions 2019 & 2032
- Table 3: Global IAM Security Services Industry Revenue Million Forecast, by Type of Deployment 2019 & 2032
- Table 4: Global IAM Security Services Industry Revenue Million Forecast, by Organization Size 2019 & 2032
- Table 5: Global IAM Security Services Industry Revenue Million Forecast, by End-user Vertical 2019 & 2032
- Table 6: Global IAM Security Services Industry Revenue Million Forecast, by Region 2019 & 2032
- Table 7: Global IAM Security Services Industry Revenue Million Forecast, by Country 2019 & 2032
- Table 8: United States IAM Security Services Industry Revenue (Million) Forecast, by Application 2019 & 2032
- Table 9: Canada IAM Security Services Industry Revenue (Million) Forecast, by Application 2019 & 2032
- Table 10: Mexico IAM Security Services Industry Revenue (Million) Forecast, by Application 2019 & 2032
- Table 11: Global IAM Security Services Industry Revenue Million Forecast, by Country 2019 & 2032
- Table 12: Germany IAM Security Services Industry Revenue (Million) Forecast, by Application 2019 & 2032
- Table 13: United Kingdom IAM Security Services Industry Revenue (Million) Forecast, by Application 2019 & 2032
- Table 14: France IAM Security Services Industry Revenue (Million) Forecast, by Application 2019 & 2032
- Table 15: Spain IAM Security Services Industry Revenue (Million) Forecast, by Application 2019 & 2032
- Table 16: Italy IAM Security Services Industry Revenue (Million) Forecast, by Application 2019 & 2032
- Table 17: Spain IAM Security Services Industry Revenue (Million) Forecast, by Application 2019 & 2032
- Table 18: Belgium IAM Security Services Industry Revenue (Million) Forecast, by Application 2019 & 2032
- Table 19: Netherland IAM Security Services Industry Revenue (Million) Forecast, by Application 2019 & 2032
- Table 20: Nordics IAM Security Services Industry Revenue (Million) Forecast, by Application 2019 & 2032
- Table 21: Rest of Europe IAM Security Services Industry Revenue (Million) Forecast, by Application 2019 & 2032
- Table 22: Global IAM Security Services Industry Revenue Million Forecast, by Country 2019 & 2032
- Table 23: China IAM Security Services Industry Revenue (Million) Forecast, by Application 2019 & 2032
- Table 24: Japan IAM Security Services Industry Revenue (Million) Forecast, by Application 2019 & 2032
- Table 25: India IAM Security Services Industry Revenue (Million) Forecast, by Application 2019 & 2032
- Table 26: South Korea IAM Security Services Industry Revenue (Million) Forecast, by Application 2019 & 2032
- Table 27: Southeast Asia IAM Security Services Industry Revenue (Million) Forecast, by Application 2019 & 2032
- Table 28: Australia IAM Security Services Industry Revenue (Million) Forecast, by Application 2019 & 2032
- Table 29: Indonesia IAM Security Services Industry Revenue (Million) Forecast, by Application 2019 & 2032
- Table 30: Phillipes IAM Security Services Industry Revenue (Million) Forecast, by Application 2019 & 2032
- Table 31: Singapore IAM Security Services Industry Revenue (Million) Forecast, by Application 2019 & 2032
- Table 32: Thailandc IAM Security Services Industry Revenue (Million) Forecast, by Application 2019 & 2032
- Table 33: Rest of Asia Pacific IAM Security Services Industry Revenue (Million) Forecast, by Application 2019 & 2032
- Table 34: Global IAM Security Services Industry Revenue Million Forecast, by Country 2019 & 2032
- Table 35: Brazil IAM Security Services Industry Revenue (Million) Forecast, by Application 2019 & 2032
- Table 36: Argentina IAM Security Services Industry Revenue (Million) Forecast, by Application 2019 & 2032
- Table 37: Peru IAM Security Services Industry Revenue (Million) Forecast, by Application 2019 & 2032
- Table 38: Chile IAM Security Services Industry Revenue (Million) Forecast, by Application 2019 & 2032
- Table 39: Colombia IAM Security Services Industry Revenue (Million) Forecast, by Application 2019 & 2032
- Table 40: Ecuador IAM Security Services Industry Revenue (Million) Forecast, by Application 2019 & 2032
- Table 41: Venezuela IAM Security Services Industry Revenue (Million) Forecast, by Application 2019 & 2032
- Table 42: Rest of South America IAM Security Services Industry Revenue (Million) Forecast, by Application 2019 & 2032
- Table 43: Global IAM Security Services Industry Revenue Million Forecast, by Country 2019 & 2032
- Table 44: United States IAM Security Services Industry Revenue (Million) Forecast, by Application 2019 & 2032
- Table 45: Canada IAM Security Services Industry Revenue (Million) Forecast, by Application 2019 & 2032
- Table 46: Mexico IAM Security Services Industry Revenue (Million) Forecast, by Application 2019 & 2032
- Table 47: Global IAM Security Services Industry Revenue Million Forecast, by Country 2019 & 2032
- Table 48: United Arab Emirates IAM Security Services Industry Revenue (Million) Forecast, by Application 2019 & 2032
- Table 49: Saudi Arabia IAM Security Services Industry Revenue (Million) Forecast, by Application 2019 & 2032
- Table 50: South Africa IAM Security Services Industry Revenue (Million) Forecast, by Application 2019 & 2032
- Table 51: Rest of Middle East and Africa IAM Security Services Industry Revenue (Million) Forecast, by Application 2019 & 2032
- Table 52: Global IAM Security Services Industry Revenue Million Forecast, by Type of Solutions 2019 & 2032
- Table 53: Global IAM Security Services Industry Revenue Million Forecast, by Type of Deployment 2019 & 2032
- Table 54: Global IAM Security Services Industry Revenue Million Forecast, by Organization Size 2019 & 2032
- Table 55: Global IAM Security Services Industry Revenue Million Forecast, by End-user Vertical 2019 & 2032
- Table 56: Global IAM Security Services Industry Revenue Million Forecast, by Country 2019 & 2032
- Table 57: US IAM Security Services Industry Revenue (Million) Forecast, by Application 2019 & 2032
- Table 58: Canada IAM Security Services Industry Revenue (Million) Forecast, by Application 2019 & 2032
- Table 59: Global IAM Security Services Industry Revenue Million Forecast, by Type of Solutions 2019 & 2032
- Table 60: Global IAM Security Services Industry Revenue Million Forecast, by Type of Deployment 2019 & 2032
- Table 61: Global IAM Security Services Industry Revenue Million Forecast, by Organization Size 2019 & 2032
- Table 62: Global IAM Security Services Industry Revenue Million Forecast, by End-user Vertical 2019 & 2032
- Table 63: Global IAM Security Services Industry Revenue Million Forecast, by Country 2019 & 2032
- Table 64: UK IAM Security Services Industry Revenue (Million) Forecast, by Application 2019 & 2032
- Table 65: Germany IAM Security Services Industry Revenue (Million) Forecast, by Application 2019 & 2032
- Table 66: France IAM Security Services Industry Revenue (Million) Forecast, by Application 2019 & 2032
- Table 67: Rest of Europe IAM Security Services Industry Revenue (Million) Forecast, by Application 2019 & 2032
- Table 68: Global IAM Security Services Industry Revenue Million Forecast, by Type of Solutions 2019 & 2032
- Table 69: Global IAM Security Services Industry Revenue Million Forecast, by Type of Deployment 2019 & 2032
- Table 70: Global IAM Security Services Industry Revenue Million Forecast, by Organization Size 2019 & 2032
- Table 71: Global IAM Security Services Industry Revenue Million Forecast, by End-user Vertical 2019 & 2032
- Table 72: Global IAM Security Services Industry Revenue Million Forecast, by Country 2019 & 2032
- Table 73: China IAM Security Services Industry Revenue (Million) Forecast, by Application 2019 & 2032
- Table 74: Japan IAM Security Services Industry Revenue (Million) Forecast, by Application 2019 & 2032
- Table 75: India IAM Security Services Industry Revenue (Million) Forecast, by Application 2019 & 2032
- Table 76: Rest of Asia Pacific IAM Security Services Industry Revenue (Million) Forecast, by Application 2019 & 2032
- Table 77: Global IAM Security Services Industry Revenue Million Forecast, by Type of Solutions 2019 & 2032
- Table 78: Global IAM Security Services Industry Revenue Million Forecast, by Type of Deployment 2019 & 2032
- Table 79: Global IAM Security Services Industry Revenue Million Forecast, by Organization Size 2019 & 2032
- Table 80: Global IAM Security Services Industry Revenue Million Forecast, by End-user Vertical 2019 & 2032
- Table 81: Global IAM Security Services Industry Revenue Million Forecast, by Country 2019 & 2032
- Table 82: Brazil IAM Security Services Industry Revenue (Million) Forecast, by Application 2019 & 2032
- Table 83: Mexico IAM Security Services Industry Revenue (Million) Forecast, by Application 2019 & 2032
- Table 84: Rest of Latin America IAM Security Services Industry Revenue (Million) Forecast, by Application 2019 & 2032
- Table 85: Global IAM Security Services Industry Revenue Million Forecast, by Type of Solutions 2019 & 2032
- Table 86: Global IAM Security Services Industry Revenue Million Forecast, by Type of Deployment 2019 & 2032
- Table 87: Global IAM Security Services Industry Revenue Million Forecast, by Organization Size 2019 & 2032
- Table 88: Global IAM Security Services Industry Revenue Million Forecast, by End-user Vertical 2019 & 2032
- Table 89: Global IAM Security Services Industry Revenue Million Forecast, by Country 2019 & 2032
- Table 90: Saudi Arabia IAM Security Services Industry Revenue (Million) Forecast, by Application 2019 & 2032
- Table 91: UAE IAM Security Services Industry Revenue (Million) Forecast, by Application 2019 & 2032
- Table 92: Rest of Middle East and Africa IAM Security Services Industry Revenue (Million) Forecast, by Application 2019 & 2032
Frequently Asked Questions
1. What is the projected Compound Annual Growth Rate (CAGR) of the IAM Security Services Industry?
The projected CAGR is approximately 12.31%.
2. Which companies are prominent players in the IAM Security Services Industry?
Key companies in the market include Cyberark Software Ltd, Amazon Web Services, NetIQ Corporation*List Not Exhaustive, IBM Corporation, Sailpoint Technologies Inc, Broadcom Inc, Microsoft Corporation, HID Global Corporation, Oracle Corporation, Centrify Corporation, Okta Inc.
3. What are the main segments of the IAM Security Services Industry?
The market segments include Type of Solutions, Type of Deployment, Organization Size, End-user Vertical.
4. Can you provide details about the market size?
The market size is estimated to be USD 17.05 Million as of 2022.
5. What are some drivers contributing to market growth?
Increasing Security Concerns; Increasing Number of Cyber Data Breaches.
6. What are the notable trends driving market growth?
The IT & Telecom Segment is Expected to Register a Strong Growth.
7. Are there any restraints impacting market growth?
High Costs of Security Solution; Complexity in Integration with Existing Network.
8. Can you provide examples of recent developments in the market?
January 2023: Saviynt, a provider of intelligent identification and access governance solutions, raised USD 205m in growth financing from AB Private Credit Investors' Tech Capital Solutions group.. Saviynt will use this funding to meet the market's growing demand for its converged identity platform and accelerate innovation.
9. What pricing options are available for accessing the report?
Pricing options include single-user, multi-user, and enterprise licenses priced at USD 4750, USD 5250, and USD 8750 respectively.
10. Is the market size provided in terms of value or volume?
The market size is provided in terms of value, measured in Million.
11. Are there any specific market keywords associated with the report?
Yes, the market keyword associated with the report is "IAM Security Services Industry," which aids in identifying and referencing the specific market segment covered.
12. How do I determine which pricing option suits my needs best?
The pricing options vary based on user requirements and access needs. Individual users may opt for single-user licenses, while businesses requiring broader access may choose multi-user or enterprise licenses for cost-effective access to the report.
13. Are there any additional resources or data provided in the IAM Security Services Industry report?
While the report offers comprehensive insights, it's advisable to review the specific contents or supplementary materials provided to ascertain if additional resources or data are available.
14. How can I stay updated on further developments or reports in the IAM Security Services Industry?
To stay informed about further developments, trends, and reports in the IAM Security Services Industry, consider subscribing to industry newsletters, following relevant companies and organizations, or regularly checking reputable industry news sources and publications.
Methodology
Step 1 - Identification of Relevant Samples Size from Population Database


Step 2 - Approaches for Defining Global Market Size (Value, Volume* & Price*)

Note*: In applicable scenarios
Step 3 - Data Sources
Primary Research
- Web Analytics
- Survey Reports
- Research Institute
- Latest Research Reports
- Opinion Leaders
Secondary Research
- Annual Reports
- White Paper
- Latest Press Release
- Industry Association
- Paid Database
- Investor Presentations

Step 4 - Data Triangulation
Involves using different sources of information in order to increase the validity of a study
These sources are likely to be stakeholders in a program - participants, other researchers, program staff, other community members, and so on.
Then we put all data in single framework & apply various statistical tools to find out the dynamic on the market.
During the analysis stage, feedback from the stakeholder groups would be compared to determine areas of agreement as well as areas of divergence
