

Key Insights
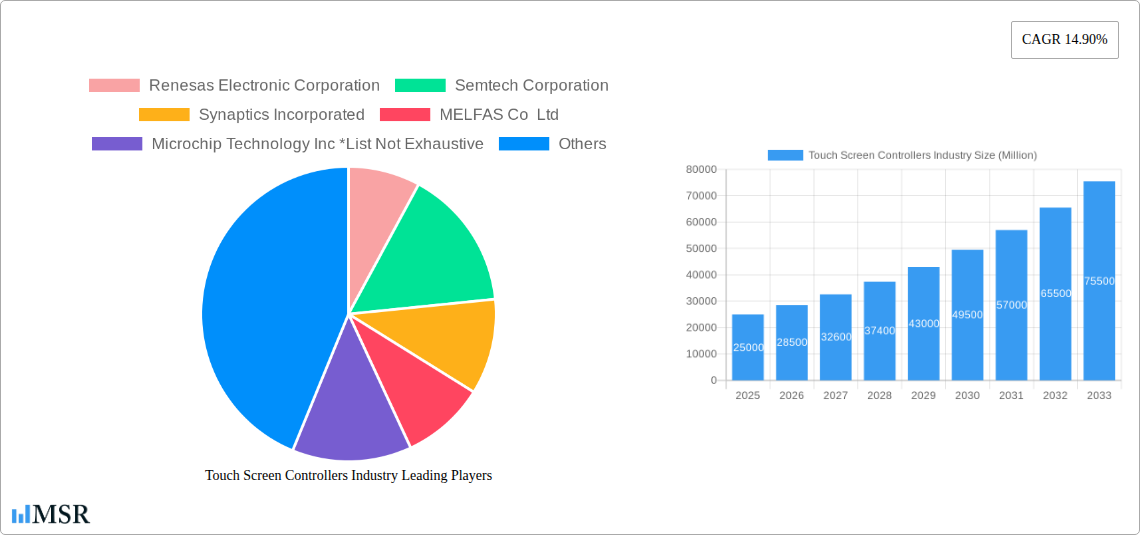
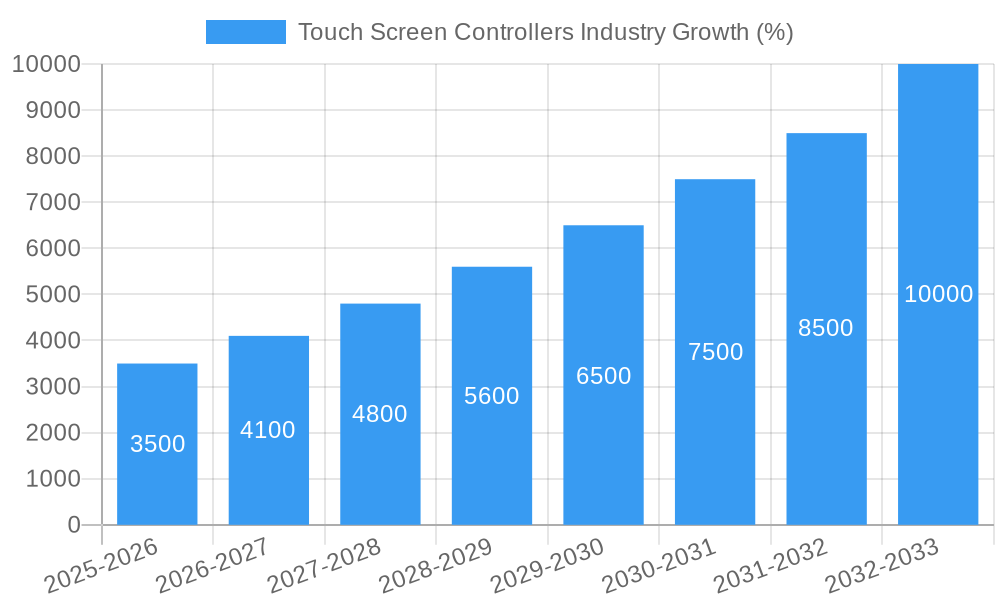
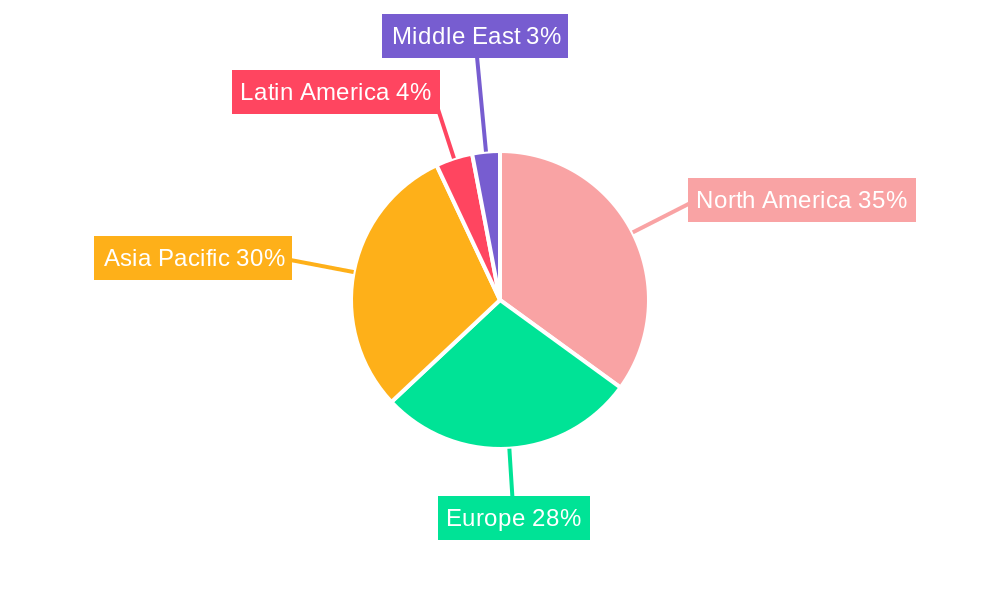
The global touchscreen controller market is experiencing robust growth, projected to reach a significant valuation by 2033. Driven by the increasing adoption of smartphones, tablets, and other smart devices, coupled with the expanding automotive and industrial automation sectors, the market is expected to maintain a Compound Annual Growth Rate (CAGR) of 14.90% from 2025 to 2033. Capacitive touchscreen controllers currently dominate the market due to their superior performance and features, offering better sensitivity and durability compared to resistive counterparts. However, the resistive segment retains a niche market, primarily in applications requiring cost-effectiveness and robustness in harsh environments. The market is geographically diverse, with North America and Asia-Pacific representing key regions. North America benefits from established technological infrastructure and high consumer demand for advanced electronics, while Asia-Pacific's growth is propelled by burgeoning manufacturing hubs and rising disposable incomes. Growth is also fueled by emerging trends such as the integration of touchscreens into diverse applications like wearable technology, interactive displays, and sophisticated medical equipment. Despite the overall positive outlook, market restraints include supply chain complexities, the increasing cost of advanced controller technology, and the potential for technological disruptions. The competitive landscape is highly fragmented, with key players like Renesas, Semtech, Synaptics, and others continually innovating to secure market share through technological advancements and strategic partnerships.
The segmental analysis reveals a diverse end-user landscape. The consumer electronics sector remains a major driver, while the automotive and industrial sectors are rapidly expanding, demanding sophisticated touchscreen solutions for advanced driver-assistance systems (ADAS) and human-machine interfaces (HMI). The healthcare sector is also showing significant growth, driven by the adoption of touchscreen-based medical devices and diagnostic tools. While the retail and BFSI sectors exhibit moderate growth, their contributions are substantial. Ongoing innovations in materials science, miniaturization, and power efficiency are key factors driving market expansion. The market is poised for continued expansion in the forecast period, although the rate of growth might slightly fluctuate due to macroeconomic factors and potential technological shifts.
Touch Screen Controllers Industry Market Report: 2019-2033
This comprehensive report provides an in-depth analysis of the global touch screen controllers industry, covering market size, growth drivers, key players, and future trends. The study period spans from 2019 to 2033, with 2025 serving as the base and estimated year. The report offers actionable insights for industry stakeholders, investors, and businesses seeking to understand and capitalize on this dynamic market. The global market size in 2025 is estimated at $xx Million.
Touch Screen Controllers Industry Market Concentration & Dynamics
The touch screen controllers market exhibits a moderately concentrated landscape, with a few key players holding significant market share. However, the presence of numerous smaller players and continuous technological advancements contribute to a dynamic competitive environment. Market concentration is influenced by factors such as economies of scale, technological innovation capabilities, and strategic mergers and acquisitions (M&A).
Market Share: While precise market share data for each player requires proprietary information, it's estimated that the top five players (Renesas Electronic Corporation, Semtech Corporation, Synaptics Incorporated, MELFAS Co Ltd, and Microchip Technology Inc.) collectively hold approximately xx% of the global market share in 2025. SAMSUNG Electronics Co Ltd, STMicroelectronics, NXP Semiconductors, Texas Instruments Incorporated, and Analog Devices Inc. also contribute significantly.
Innovation Ecosystems: The industry thrives on a robust innovation ecosystem involving collaborations between semiconductor manufacturers, display panel makers, and system integrators. Open-source platforms and standardization initiatives facilitate wider adoption of new technologies.
Regulatory Frameworks: Regulatory compliance varies across regions, impacting product certifications and market access. Emerging regulations concerning data privacy and cybersecurity are crucial considerations for manufacturers.
Substitute Products: While touch screen controllers dominate human-machine interface (HMI) applications, technologies like voice recognition and gesture control are emerging as potential substitutes, yet are unlikely to supplant them in their primary applications.
End-User Trends: Growing demand for touch-enabled devices across diverse end-user segments, including consumer electronics, automotive, healthcare, and industrial automation, fuels market expansion.
M&A Activities: The number of M&A deals within the touch screen controllers industry is estimated to have averaged xx per year between 2019 and 2024, driven by strategic acquisitions to bolster market presence and technology portfolios.
Touch Screen Controllers Industry Insights & Trends
The global touch screen controllers market is experiencing significant growth, driven by the increasing demand for touch-enabled devices across various sectors. The market size is projected to reach $xx Million by 2033, expanding at a Compound Annual Growth Rate (CAGR) of xx% during the forecast period (2025-2033). This robust growth is attributable to several factors.
The increasing integration of touch screen technology in diverse applications, including smartphones, tablets, automotive infotainment systems, industrial control panels, and medical equipment, is a major driver. Technological advancements, such as the development of more efficient and cost-effective touch screen controllers with improved features, also fuels market growth. The shift towards more intuitive and user-friendly interfaces is further boosting demand. Furthermore, the rising adoption of smartphones and other consumer electronics worldwide is significantly expanding the market. Finally, technological advancements in display technology, like foldable displays and higher resolution screens, provide further momentum.
Key Markets & Segments Leading Touch Screen Controllers Industry
The Asia-Pacific region is currently dominating the touch screen controllers market, driven by strong demand from China and other emerging economies with rapidly growing consumer electronics and automotive sectors.
By Type: Capacitive touch screen controllers significantly outpace resistive types due to their superior performance, durability, and multi-touch capabilities.
By End-user:
- Consumer Electronics: Smartphones, tablets, and laptops are the largest contributors to market growth, with steady demand increase fueled by new product releases.
- Automotive: The integration of touch screen controllers in in-car infotainment systems and driver assistance technologies is significantly expanding the automotive sector.
- Industrial: Automation and industrial control systems increasingly rely on touch screen technology for HMI functions, promoting growth in the industrial segment.
- Healthcare: Medical equipment incorporating touch screen interfaces, including diagnostic imaging systems and patient monitoring devices, are boosting the healthcare segment's growth.
- Retail: Point-of-sale (POS) systems and self-service kiosks drive demand for touch screen controllers within the retail sector.
Drivers for Dominant Regions/Segments:
- Economic Growth: Rising disposable incomes in developing economies, particularly in Asia-Pacific, fuel demand for consumer electronics with touch screen interfaces.
- Infrastructure Development: Improved infrastructure in emerging markets facilitates the wider adoption of technologically advanced products.
- Technological Advancements: Continued innovation in touch screen controller technologies contributes to enhanced user experience, driving market growth.
Touch Screen Controllers Industry Product Developments
Recent advancements include the introduction of highly integrated touch screen controllers incorporating advanced features like gesture recognition, haptic feedback, and improved power efficiency. These improvements enhance the overall user experience and improve functionality. The automotive industry, specifically, has seen significant advancements in automotive-grade touch screen controllers, ensuring robust performance even in demanding environments. This focus on enhanced functionalities and improved durability strengthens the competitive edge for leading players.
Challenges in the Touch Screen Controllers Industry Market
The touch screen controllers market faces challenges including intense competition, supply chain disruptions, particularly concerning raw materials, and the need to maintain rigorous quality standards to meet diverse customer requirements. Regulatory changes across various regions and cost pressures can also negatively impact profitability.
Forces Driving Touch Screen Controllers Industry Growth
Technological advancements (e.g., improved sensitivity and resolution), economic factors (e.g., rising disposable incomes), and supportive regulatory environments (e.g., policies promoting technological adoption) are driving growth. The increasing adoption of IoT and automation also contributes significantly.
Long-Term Growth Catalysts in Touch Screen Controllers Industry
Long-term growth will be fueled by the continuous innovation in touch screen technologies, strategic partnerships among industry players, and the expansion into emerging markets. The integration of AI and machine learning into touch screen controllers will create opportunities for new functionalities and improved usability.
Emerging Opportunities in Touch Screen Controllers Industry
Emerging opportunities include the integration of touch screen controllers into wearable technology, augmented reality (AR) and virtual reality (VR) devices, and the development of more sustainable and energy-efficient touch screen controllers. Expanding into niche applications across various sectors like smart homes and smart cities also presents promising prospects.
Leading Players in the Touch Screen Controllers Industry Sector
- Renesas Electronic Corporation (Renesas)
- Semtech Corporation (Semtech)
- Synaptics Incorporated (Synaptics)
- MELFAS Co Ltd
- Microchip Technology Inc (Microchip)
- SAMSUNG Electronics Co Ltd (Samsung)
- STMicroelectronics (STMicroelectronics)
- NXP Semiconductors (NXP)
- Texas Instruments Incorporated (Texas Instruments)
- Analog Devices Inc (Analog Devices)
Key Milestones in Touch Screen Controllers Industry
- June 2022: Review Display Systems (RDS) announced a new generation of projected capacitive (PCAP) touchscreens from AMT, expanding its integrated touch solutions offerings.
- June 2022: Microchip Technology Inc. launched the maXTouch Knob-on-Display (KoD) family of touchscreen controllers, the first automotive-grade family to support capacitive rotary encoders and mechanical switches.
Strategic Outlook for Touch Screen Controllers Industry Market
The future of the touch screen controllers market appears exceptionally promising, driven by continuous technological innovation, increasing demand across diverse sectors, and strategic partnerships among industry leaders. Expansion into emerging markets and the development of innovative applications for next-generation devices, including foldable displays and flexible electronics, will further propel market growth. Companies focusing on efficiency improvements, enhanced user experience, and specialized solutions for niche applications are well-positioned for significant success.
Touch Screen Controllers Industry Segmentation
-
1. Type
- 1.1. Resistive
- 1.2. Capacitive
-
2. End-user
- 2.1. Industrial
- 2.2. Healthcare
- 2.3. Consumer Electronics
- 2.4. Retail
- 2.5. Automotive
- 2.6. BFSI
- 2.7. Other End-users
Touch Screen Controllers Industry Segmentation By Geography
-
1. North America
- 1.1. United States
- 1.2. Canada
-
2. Europe
- 2.1. United Kingdom
- 2.2. Germany
- 2.3. France
- 2.4. Spain
- 2.5. Rest of Europe
-
3. Asia Pacific
- 3.1. China
- 3.2. India
- 3.3. Japan
- 3.4. South Korea
- 3.5. Australia
- 3.6. Rest of Asia Pacific
-
4. Latin America
- 4.1. Brazil
- 4.2. Mexico
- 4.3. Argentina
- 4.4. Rest of Latin America
- 5. Middle East
-
6. United Arab Emirates
- 6.1. Saudi Arabia
- 6.2. South Africa
- 6.3. Rest of Middle East
Touch Screen Controllers Industry REPORT HIGHLIGHTS
| Aspects | Details |
|---|---|
| Study Period | 2019-2033 |
| Base Year | 2024 |
| Estimated Year | 2025 |
| Forecast Period | 2025-2033 |
| Historical Period | 2019-2024 |
| Growth Rate | CAGR of 14.90% from 2019-2033 |
| Segmentation |
|
Table of Contents
- 1. Introduction
- 1.1. Research Scope
- 1.2. Market Segmentation
- 1.3. Research Methodology
- 1.4. Definitions and Assumptions
- 2. Executive Summary
- 2.1. Introduction
- 3. Market Dynamics
- 3.1. Introduction
- 3.2. Market Drivers
- 3.2.1. Increase in the Number of Smart Devices; Increased Usage across Various Industries
- 3.3. Market Restrains
- 3.3.1. Complexities Associated with the Technology
- 3.4. Market Trends
- 3.4.1. Consumer Electronics to Hold a Major Market Share
- 4. Market Factor Analysis
- 4.1. Porters Five Forces
- 4.2. Supply/Value Chain
- 4.3. PESTEL analysis
- 4.4. Market Entropy
- 4.5. Patent/Trademark Analysis
- 5. Global Touch Screen Controllers Industry Analysis, Insights and Forecast, 2019-2031
- 5.1. Market Analysis, Insights and Forecast - by Type
- 5.1.1. Resistive
- 5.1.2. Capacitive
- 5.2. Market Analysis, Insights and Forecast - by End-user
- 5.2.1. Industrial
- 5.2.2. Healthcare
- 5.2.3. Consumer Electronics
- 5.2.4. Retail
- 5.2.5. Automotive
- 5.2.6. BFSI
- 5.2.7. Other End-users
- 5.3. Market Analysis, Insights and Forecast - by Region
- 5.3.1. North America
- 5.3.2. Europe
- 5.3.3. Asia Pacific
- 5.3.4. Latin America
- 5.3.5. Middle East
- 5.3.6. United Arab Emirates
- 5.1. Market Analysis, Insights and Forecast - by Type
- 6. North America Touch Screen Controllers Industry Analysis, Insights and Forecast, 2019-2031
- 6.1. Market Analysis, Insights and Forecast - by Type
- 6.1.1. Resistive
- 6.1.2. Capacitive
- 6.2. Market Analysis, Insights and Forecast - by End-user
- 6.2.1. Industrial
- 6.2.2. Healthcare
- 6.2.3. Consumer Electronics
- 6.2.4. Retail
- 6.2.5. Automotive
- 6.2.6. BFSI
- 6.2.7. Other End-users
- 6.1. Market Analysis, Insights and Forecast - by Type
- 7. Europe Touch Screen Controllers Industry Analysis, Insights and Forecast, 2019-2031
- 7.1. Market Analysis, Insights and Forecast - by Type
- 7.1.1. Resistive
- 7.1.2. Capacitive
- 7.2. Market Analysis, Insights and Forecast - by End-user
- 7.2.1. Industrial
- 7.2.2. Healthcare
- 7.2.3. Consumer Electronics
- 7.2.4. Retail
- 7.2.5. Automotive
- 7.2.6. BFSI
- 7.2.7. Other End-users
- 7.1. Market Analysis, Insights and Forecast - by Type
- 8. Asia Pacific Touch Screen Controllers Industry Analysis, Insights and Forecast, 2019-2031
- 8.1. Market Analysis, Insights and Forecast - by Type
- 8.1.1. Resistive
- 8.1.2. Capacitive
- 8.2. Market Analysis, Insights and Forecast - by End-user
- 8.2.1. Industrial
- 8.2.2. Healthcare
- 8.2.3. Consumer Electronics
- 8.2.4. Retail
- 8.2.5. Automotive
- 8.2.6. BFSI
- 8.2.7. Other End-users
- 8.1. Market Analysis, Insights and Forecast - by Type
- 9. Latin America Touch Screen Controllers Industry Analysis, Insights and Forecast, 2019-2031
- 9.1. Market Analysis, Insights and Forecast - by Type
- 9.1.1. Resistive
- 9.1.2. Capacitive
- 9.2. Market Analysis, Insights and Forecast - by End-user
- 9.2.1. Industrial
- 9.2.2. Healthcare
- 9.2.3. Consumer Electronics
- 9.2.4. Retail
- 9.2.5. Automotive
- 9.2.6. BFSI
- 9.2.7. Other End-users
- 9.1. Market Analysis, Insights and Forecast - by Type
- 10. Middle East Touch Screen Controllers Industry Analysis, Insights and Forecast, 2019-2031
- 10.1. Market Analysis, Insights and Forecast - by Type
- 10.1.1. Resistive
- 10.1.2. Capacitive
- 10.2. Market Analysis, Insights and Forecast - by End-user
- 10.2.1. Industrial
- 10.2.2. Healthcare
- 10.2.3. Consumer Electronics
- 10.2.4. Retail
- 10.2.5. Automotive
- 10.2.6. BFSI
- 10.2.7. Other End-users
- 10.1. Market Analysis, Insights and Forecast - by Type
- 11. United Arab Emirates Touch Screen Controllers Industry Analysis, Insights and Forecast, 2019-2031
- 11.1. Market Analysis, Insights and Forecast - by Type
- 11.1.1. Resistive
- 11.1.2. Capacitive
- 11.2. Market Analysis, Insights and Forecast - by End-user
- 11.2.1. Industrial
- 11.2.2. Healthcare
- 11.2.3. Consumer Electronics
- 11.2.4. Retail
- 11.2.5. Automotive
- 11.2.6. BFSI
- 11.2.7. Other End-users
- 11.1. Market Analysis, Insights and Forecast - by Type
- 12. North America Touch Screen Controllers Industry Analysis, Insights and Forecast, 2019-2031
- 12.1. Market Analysis, Insights and Forecast - By Country/Sub-region
- 12.1.1 United States
- 12.1.2 Canada
- 13. Europe Touch Screen Controllers Industry Analysis, Insights and Forecast, 2019-2031
- 13.1. Market Analysis, Insights and Forecast - By Country/Sub-region
- 13.1.1 United Kingdom
- 13.1.2 Germany
- 13.1.3 France
- 13.1.4 Spain
- 13.1.5 Rest of Europe
- 14. Asia Pacific Touch Screen Controllers Industry Analysis, Insights and Forecast, 2019-2031
- 14.1. Market Analysis, Insights and Forecast - By Country/Sub-region
- 14.1.1 China
- 14.1.2 India
- 14.1.3 Japan
- 14.1.4 South Korea
- 14.1.5 Australia
- 14.1.6 Rest of Asia Pacific
- 15. Latin America Touch Screen Controllers Industry Analysis, Insights and Forecast, 2019-2031
- 15.1. Market Analysis, Insights and Forecast - By Country/Sub-region
- 15.1.1 Brazil
- 15.1.2 Mexico
- 15.1.3 Argentina
- 15.1.4 Rest of Latin America
- 16. Middle East Touch Screen Controllers Industry Analysis, Insights and Forecast, 2019-2031
- 16.1. Market Analysis, Insights and Forecast - By Country/Sub-region
- 16.1.1.
- 17. United Arab Emirates Touch Screen Controllers Industry Analysis, Insights and Forecast, 2019-2031
- 17.1. Market Analysis, Insights and Forecast - By Country/Sub-region
- 17.1.1 Saudi Arabia
- 17.1.2 South Africa
- 17.1.3 Rest of Middle East
- 18. Competitive Analysis
- 18.1. Global Market Share Analysis 2024
- 18.2. Company Profiles
- 18.2.1 Renesas Electronic Corporation
- 18.2.1.1. Overview
- 18.2.1.2. Products
- 18.2.1.3. SWOT Analysis
- 18.2.1.4. Recent Developments
- 18.2.1.5. Financials (Based on Availability)
- 18.2.2 Semtech Corporation
- 18.2.2.1. Overview
- 18.2.2.2. Products
- 18.2.2.3. SWOT Analysis
- 18.2.2.4. Recent Developments
- 18.2.2.5. Financials (Based on Availability)
- 18.2.3 Synaptics Incorporated
- 18.2.3.1. Overview
- 18.2.3.2. Products
- 18.2.3.3. SWOT Analysis
- 18.2.3.4. Recent Developments
- 18.2.3.5. Financials (Based on Availability)
- 18.2.4 MELFAS Co Ltd
- 18.2.4.1. Overview
- 18.2.4.2. Products
- 18.2.4.3. SWOT Analysis
- 18.2.4.4. Recent Developments
- 18.2.4.5. Financials (Based on Availability)
- 18.2.5 Microchip Technology Inc *List Not Exhaustive
- 18.2.5.1. Overview
- 18.2.5.2. Products
- 18.2.5.3. SWOT Analysis
- 18.2.5.4. Recent Developments
- 18.2.5.5. Financials (Based on Availability)
- 18.2.6 SAMSUNG Electronics Co Ltd
- 18.2.6.1. Overview
- 18.2.6.2. Products
- 18.2.6.3. SWOT Analysis
- 18.2.6.4. Recent Developments
- 18.2.6.5. Financials (Based on Availability)
- 18.2.7 STMicroelectronics
- 18.2.7.1. Overview
- 18.2.7.2. Products
- 18.2.7.3. SWOT Analysis
- 18.2.7.4. Recent Developments
- 18.2.7.5. Financials (Based on Availability)
- 18.2.8 NXP Semiconductors
- 18.2.8.1. Overview
- 18.2.8.2. Products
- 18.2.8.3. SWOT Analysis
- 18.2.8.4. Recent Developments
- 18.2.8.5. Financials (Based on Availability)
- 18.2.9 Texas Instruments Incorporated
- 18.2.9.1. Overview
- 18.2.9.2. Products
- 18.2.9.3. SWOT Analysis
- 18.2.9.4. Recent Developments
- 18.2.9.5. Financials (Based on Availability)
- 18.2.10 Analog Devices Inc
- 18.2.10.1. Overview
- 18.2.10.2. Products
- 18.2.10.3. SWOT Analysis
- 18.2.10.4. Recent Developments
- 18.2.10.5. Financials (Based on Availability)
- 18.2.1 Renesas Electronic Corporation
List of Figures
- Figure 1: Global Touch Screen Controllers Industry Revenue Breakdown (Million, %) by Region 2024 & 2032
- Figure 2: North America Touch Screen Controllers Industry Revenue (Million), by Country 2024 & 2032
- Figure 3: North America Touch Screen Controllers Industry Revenue Share (%), by Country 2024 & 2032
- Figure 4: Europe Touch Screen Controllers Industry Revenue (Million), by Country 2024 & 2032
- Figure 5: Europe Touch Screen Controllers Industry Revenue Share (%), by Country 2024 & 2032
- Figure 6: Asia Pacific Touch Screen Controllers Industry Revenue (Million), by Country 2024 & 2032
- Figure 7: Asia Pacific Touch Screen Controllers Industry Revenue Share (%), by Country 2024 & 2032
- Figure 8: Latin America Touch Screen Controllers Industry Revenue (Million), by Country 2024 & 2032
- Figure 9: Latin America Touch Screen Controllers Industry Revenue Share (%), by Country 2024 & 2032
- Figure 10: Middle East Touch Screen Controllers Industry Revenue (Million), by Country 2024 & 2032
- Figure 11: Middle East Touch Screen Controllers Industry Revenue Share (%), by Country 2024 & 2032
- Figure 12: United Arab Emirates Touch Screen Controllers Industry Revenue (Million), by Country 2024 & 2032
- Figure 13: United Arab Emirates Touch Screen Controllers Industry Revenue Share (%), by Country 2024 & 2032
- Figure 14: North America Touch Screen Controllers Industry Revenue (Million), by Type 2024 & 2032
- Figure 15: North America Touch Screen Controllers Industry Revenue Share (%), by Type 2024 & 2032
- Figure 16: North America Touch Screen Controllers Industry Revenue (Million), by End-user 2024 & 2032
- Figure 17: North America Touch Screen Controllers Industry Revenue Share (%), by End-user 2024 & 2032
- Figure 18: North America Touch Screen Controllers Industry Revenue (Million), by Country 2024 & 2032
- Figure 19: North America Touch Screen Controllers Industry Revenue Share (%), by Country 2024 & 2032
- Figure 20: Europe Touch Screen Controllers Industry Revenue (Million), by Type 2024 & 2032
- Figure 21: Europe Touch Screen Controllers Industry Revenue Share (%), by Type 2024 & 2032
- Figure 22: Europe Touch Screen Controllers Industry Revenue (Million), by End-user 2024 & 2032
- Figure 23: Europe Touch Screen Controllers Industry Revenue Share (%), by End-user 2024 & 2032
- Figure 24: Europe Touch Screen Controllers Industry Revenue (Million), by Country 2024 & 2032
- Figure 25: Europe Touch Screen Controllers Industry Revenue Share (%), by Country 2024 & 2032
- Figure 26: Asia Pacific Touch Screen Controllers Industry Revenue (Million), by Type 2024 & 2032
- Figure 27: Asia Pacific Touch Screen Controllers Industry Revenue Share (%), by Type 2024 & 2032
- Figure 28: Asia Pacific Touch Screen Controllers Industry Revenue (Million), by End-user 2024 & 2032
- Figure 29: Asia Pacific Touch Screen Controllers Industry Revenue Share (%), by End-user 2024 & 2032
- Figure 30: Asia Pacific Touch Screen Controllers Industry Revenue (Million), by Country 2024 & 2032
- Figure 31: Asia Pacific Touch Screen Controllers Industry Revenue Share (%), by Country 2024 & 2032
- Figure 32: Latin America Touch Screen Controllers Industry Revenue (Million), by Type 2024 & 2032
- Figure 33: Latin America Touch Screen Controllers Industry Revenue Share (%), by Type 2024 & 2032
- Figure 34: Latin America Touch Screen Controllers Industry Revenue (Million), by End-user 2024 & 2032
- Figure 35: Latin America Touch Screen Controllers Industry Revenue Share (%), by End-user 2024 & 2032
- Figure 36: Latin America Touch Screen Controllers Industry Revenue (Million), by Country 2024 & 2032
- Figure 37: Latin America Touch Screen Controllers Industry Revenue Share (%), by Country 2024 & 2032
- Figure 38: Middle East Touch Screen Controllers Industry Revenue (Million), by Type 2024 & 2032
- Figure 39: Middle East Touch Screen Controllers Industry Revenue Share (%), by Type 2024 & 2032
- Figure 40: Middle East Touch Screen Controllers Industry Revenue (Million), by End-user 2024 & 2032
- Figure 41: Middle East Touch Screen Controllers Industry Revenue Share (%), by End-user 2024 & 2032
- Figure 42: Middle East Touch Screen Controllers Industry Revenue (Million), by Country 2024 & 2032
- Figure 43: Middle East Touch Screen Controllers Industry Revenue Share (%), by Country 2024 & 2032
- Figure 44: United Arab Emirates Touch Screen Controllers Industry Revenue (Million), by Type 2024 & 2032
- Figure 45: United Arab Emirates Touch Screen Controllers Industry Revenue Share (%), by Type 2024 & 2032
- Figure 46: United Arab Emirates Touch Screen Controllers Industry Revenue (Million), by End-user 2024 & 2032
- Figure 47: United Arab Emirates Touch Screen Controllers Industry Revenue Share (%), by End-user 2024 & 2032
- Figure 48: United Arab Emirates Touch Screen Controllers Industry Revenue (Million), by Country 2024 & 2032
- Figure 49: United Arab Emirates Touch Screen Controllers Industry Revenue Share (%), by Country 2024 & 2032
List of Tables
- Table 1: Global Touch Screen Controllers Industry Revenue Million Forecast, by Region 2019 & 2032
- Table 2: Global Touch Screen Controllers Industry Revenue Million Forecast, by Type 2019 & 2032
- Table 3: Global Touch Screen Controllers Industry Revenue Million Forecast, by End-user 2019 & 2032
- Table 4: Global Touch Screen Controllers Industry Revenue Million Forecast, by Region 2019 & 2032
- Table 5: Global Touch Screen Controllers Industry Revenue Million Forecast, by Country 2019 & 2032
- Table 6: United States Touch Screen Controllers Industry Revenue (Million) Forecast, by Application 2019 & 2032
- Table 7: Canada Touch Screen Controllers Industry Revenue (Million) Forecast, by Application 2019 & 2032
- Table 8: Global Touch Screen Controllers Industry Revenue Million Forecast, by Country 2019 & 2032
- Table 9: United Kingdom Touch Screen Controllers Industry Revenue (Million) Forecast, by Application 2019 & 2032
- Table 10: Germany Touch Screen Controllers Industry Revenue (Million) Forecast, by Application 2019 & 2032
- Table 11: France Touch Screen Controllers Industry Revenue (Million) Forecast, by Application 2019 & 2032
- Table 12: Spain Touch Screen Controllers Industry Revenue (Million) Forecast, by Application 2019 & 2032
- Table 13: Rest of Europe Touch Screen Controllers Industry Revenue (Million) Forecast, by Application 2019 & 2032
- Table 14: Global Touch Screen Controllers Industry Revenue Million Forecast, by Country 2019 & 2032
- Table 15: China Touch Screen Controllers Industry Revenue (Million) Forecast, by Application 2019 & 2032
- Table 16: India Touch Screen Controllers Industry Revenue (Million) Forecast, by Application 2019 & 2032
- Table 17: Japan Touch Screen Controllers Industry Revenue (Million) Forecast, by Application 2019 & 2032
- Table 18: South Korea Touch Screen Controllers Industry Revenue (Million) Forecast, by Application 2019 & 2032
- Table 19: Australia Touch Screen Controllers Industry Revenue (Million) Forecast, by Application 2019 & 2032
- Table 20: Rest of Asia Pacific Touch Screen Controllers Industry Revenue (Million) Forecast, by Application 2019 & 2032
- Table 21: Global Touch Screen Controllers Industry Revenue Million Forecast, by Country 2019 & 2032
- Table 22: Brazil Touch Screen Controllers Industry Revenue (Million) Forecast, by Application 2019 & 2032
- Table 23: Mexico Touch Screen Controllers Industry Revenue (Million) Forecast, by Application 2019 & 2032
- Table 24: Argentina Touch Screen Controllers Industry Revenue (Million) Forecast, by Application 2019 & 2032
- Table 25: Rest of Latin America Touch Screen Controllers Industry Revenue (Million) Forecast, by Application 2019 & 2032
- Table 26: Global Touch Screen Controllers Industry Revenue Million Forecast, by Country 2019 & 2032
- Table 27: Touch Screen Controllers Industry Revenue (Million) Forecast, by Application 2019 & 2032
- Table 28: Global Touch Screen Controllers Industry Revenue Million Forecast, by Country 2019 & 2032
- Table 29: Saudi Arabia Touch Screen Controllers Industry Revenue (Million) Forecast, by Application 2019 & 2032
- Table 30: South Africa Touch Screen Controllers Industry Revenue (Million) Forecast, by Application 2019 & 2032
- Table 31: Rest of Middle East Touch Screen Controllers Industry Revenue (Million) Forecast, by Application 2019 & 2032
- Table 32: Global Touch Screen Controllers Industry Revenue Million Forecast, by Type 2019 & 2032
- Table 33: Global Touch Screen Controllers Industry Revenue Million Forecast, by End-user 2019 & 2032
- Table 34: Global Touch Screen Controllers Industry Revenue Million Forecast, by Country 2019 & 2032
- Table 35: United States Touch Screen Controllers Industry Revenue (Million) Forecast, by Application 2019 & 2032
- Table 36: Canada Touch Screen Controllers Industry Revenue (Million) Forecast, by Application 2019 & 2032
- Table 37: Global Touch Screen Controllers Industry Revenue Million Forecast, by Type 2019 & 2032
- Table 38: Global Touch Screen Controllers Industry Revenue Million Forecast, by End-user 2019 & 2032
- Table 39: Global Touch Screen Controllers Industry Revenue Million Forecast, by Country 2019 & 2032
- Table 40: United Kingdom Touch Screen Controllers Industry Revenue (Million) Forecast, by Application 2019 & 2032
- Table 41: Germany Touch Screen Controllers Industry Revenue (Million) Forecast, by Application 2019 & 2032
- Table 42: France Touch Screen Controllers Industry Revenue (Million) Forecast, by Application 2019 & 2032
- Table 43: Spain Touch Screen Controllers Industry Revenue (Million) Forecast, by Application 2019 & 2032
- Table 44: Rest of Europe Touch Screen Controllers Industry Revenue (Million) Forecast, by Application 2019 & 2032
- Table 45: Global Touch Screen Controllers Industry Revenue Million Forecast, by Type 2019 & 2032
- Table 46: Global Touch Screen Controllers Industry Revenue Million Forecast, by End-user 2019 & 2032
- Table 47: Global Touch Screen Controllers Industry Revenue Million Forecast, by Country 2019 & 2032
- Table 48: China Touch Screen Controllers Industry Revenue (Million) Forecast, by Application 2019 & 2032
- Table 49: India Touch Screen Controllers Industry Revenue (Million) Forecast, by Application 2019 & 2032
- Table 50: Japan Touch Screen Controllers Industry Revenue (Million) Forecast, by Application 2019 & 2032
- Table 51: South Korea Touch Screen Controllers Industry Revenue (Million) Forecast, by Application 2019 & 2032
- Table 52: Australia Touch Screen Controllers Industry Revenue (Million) Forecast, by Application 2019 & 2032
- Table 53: Rest of Asia Pacific Touch Screen Controllers Industry Revenue (Million) Forecast, by Application 2019 & 2032
- Table 54: Global Touch Screen Controllers Industry Revenue Million Forecast, by Type 2019 & 2032
- Table 55: Global Touch Screen Controllers Industry Revenue Million Forecast, by End-user 2019 & 2032
- Table 56: Global Touch Screen Controllers Industry Revenue Million Forecast, by Country 2019 & 2032
- Table 57: Brazil Touch Screen Controllers Industry Revenue (Million) Forecast, by Application 2019 & 2032
- Table 58: Mexico Touch Screen Controllers Industry Revenue (Million) Forecast, by Application 2019 & 2032
- Table 59: Argentina Touch Screen Controllers Industry Revenue (Million) Forecast, by Application 2019 & 2032
- Table 60: Rest of Latin America Touch Screen Controllers Industry Revenue (Million) Forecast, by Application 2019 & 2032
- Table 61: Global Touch Screen Controllers Industry Revenue Million Forecast, by Type 2019 & 2032
- Table 62: Global Touch Screen Controllers Industry Revenue Million Forecast, by End-user 2019 & 2032
- Table 63: Global Touch Screen Controllers Industry Revenue Million Forecast, by Country 2019 & 2032
- Table 64: Global Touch Screen Controllers Industry Revenue Million Forecast, by Type 2019 & 2032
- Table 65: Global Touch Screen Controllers Industry Revenue Million Forecast, by End-user 2019 & 2032
- Table 66: Global Touch Screen Controllers Industry Revenue Million Forecast, by Country 2019 & 2032
- Table 67: Saudi Arabia Touch Screen Controllers Industry Revenue (Million) Forecast, by Application 2019 & 2032
- Table 68: South Africa Touch Screen Controllers Industry Revenue (Million) Forecast, by Application 2019 & 2032
- Table 69: Rest of Middle East Touch Screen Controllers Industry Revenue (Million) Forecast, by Application 2019 & 2032
Frequently Asked Questions
1. What is the projected Compound Annual Growth Rate (CAGR) of the Touch Screen Controllers Industry?
The projected CAGR is approximately 14.90%.
2. Which companies are prominent players in the Touch Screen Controllers Industry?
Key companies in the market include Renesas Electronic Corporation, Semtech Corporation, Synaptics Incorporated, MELFAS Co Ltd, Microchip Technology Inc *List Not Exhaustive, SAMSUNG Electronics Co Ltd, STMicroelectronics, NXP Semiconductors, Texas Instruments Incorporated, Analog Devices Inc.
3. What are the main segments of the Touch Screen Controllers Industry?
The market segments include Type, End-user.
4. Can you provide details about the market size?
The market size is estimated to be USD XX Million as of 2022.
5. What are some drivers contributing to market growth?
Increase in the Number of Smart Devices; Increased Usage across Various Industries.
6. What are the notable trends driving market growth?
Consumer Electronics to Hold a Major Market Share.
7. Are there any restraints impacting market growth?
Complexities Associated with the Technology.
8. Can you provide examples of recent developments in the market?
June 2022 - Review Display Systems (RDS), display solutions, and embedded systems provider announced the availability of a new generation of projected capacitive (PCAP) touchscreens from AMT. The availability of an extensive range of high-quality PCAP touchscreens, touch controllers, and drivers will enable the company to provide dependable, fully integrated touch solutions.
9. What pricing options are available for accessing the report?
Pricing options include single-user, multi-user, and enterprise licenses priced at USD 4750, USD 5250, and USD 8750 respectively.
10. Is the market size provided in terms of value or volume?
The market size is provided in terms of value, measured in Million.
11. Are there any specific market keywords associated with the report?
Yes, the market keyword associated with the report is "Touch Screen Controllers Industry," which aids in identifying and referencing the specific market segment covered.
12. How do I determine which pricing option suits my needs best?
The pricing options vary based on user requirements and access needs. Individual users may opt for single-user licenses, while businesses requiring broader access may choose multi-user or enterprise licenses for cost-effective access to the report.
13. Are there any additional resources or data provided in the Touch Screen Controllers Industry report?
While the report offers comprehensive insights, it's advisable to review the specific contents or supplementary materials provided to ascertain if additional resources or data are available.
14. How can I stay updated on further developments or reports in the Touch Screen Controllers Industry?
To stay informed about further developments, trends, and reports in the Touch Screen Controllers Industry, consider subscribing to industry newsletters, following relevant companies and organizations, or regularly checking reputable industry news sources and publications.
Methodology
Step 1 - Identification of Relevant Samples Size from Population Database


Step 2 - Approaches for Defining Global Market Size (Value, Volume* & Price*)

Note*: In applicable scenarios
Step 3 - Data Sources
Primary Research
- Web Analytics
- Survey Reports
- Research Institute
- Latest Research Reports
- Opinion Leaders
Secondary Research
- Annual Reports
- White Paper
- Latest Press Release
- Industry Association
- Paid Database
- Investor Presentations

Step 4 - Data Triangulation
Involves using different sources of information in order to increase the validity of a study
These sources are likely to be stakeholders in a program - participants, other researchers, program staff, other community members, and so on.
Then we put all data in single framework & apply various statistical tools to find out the dynamic on the market.
During the analysis stage, feedback from the stakeholder groups would be compared to determine areas of agreement as well as areas of divergence
