

Key Insights
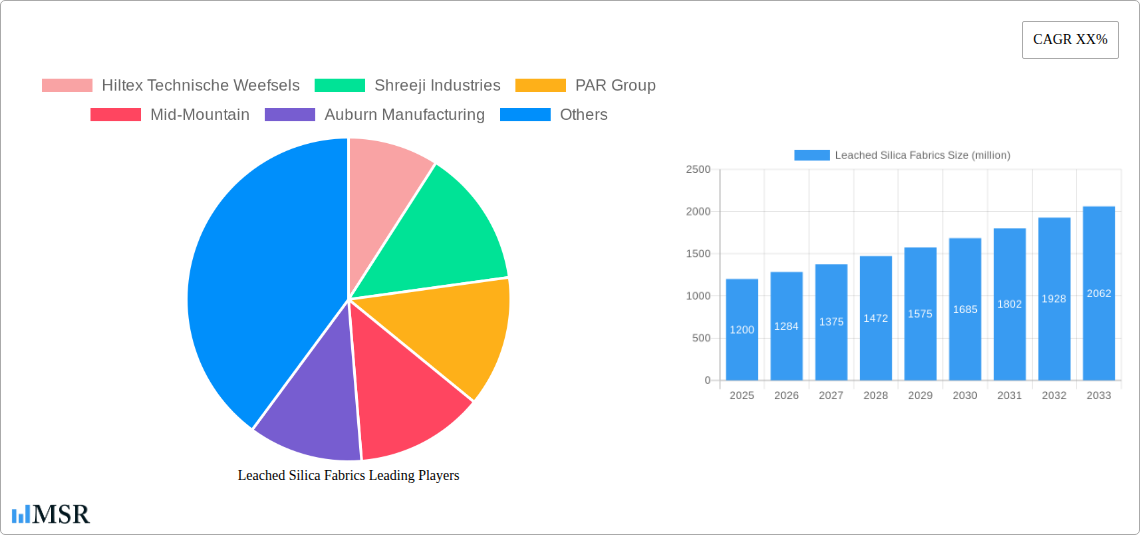
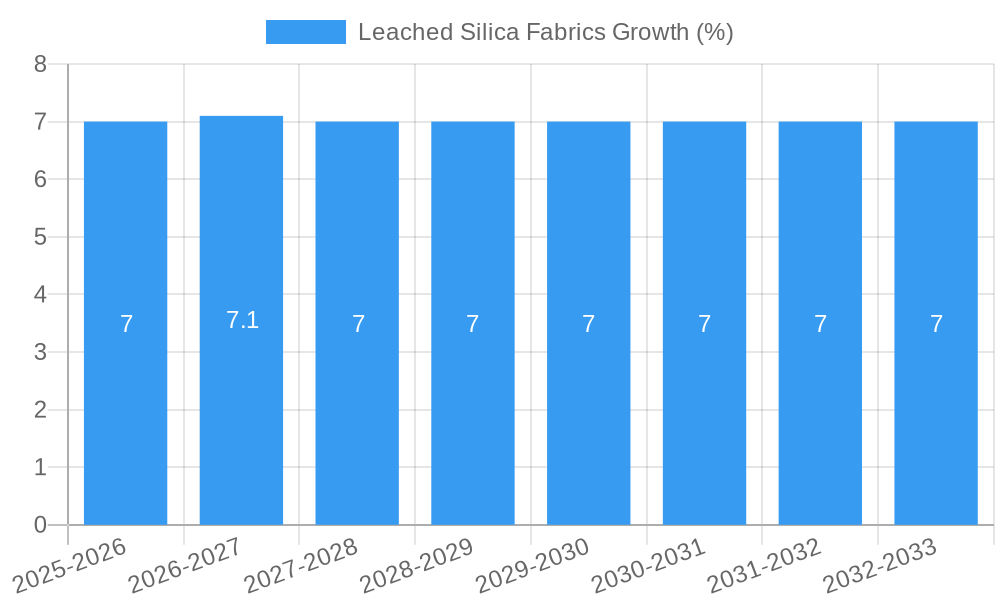
The global Leached Silica Fabrics market is projected to experience robust growth, estimated at a market size of USD 1.2 billion in 2025, and is anticipated to expand at a Compound Annual Growth Rate (CAGR) of approximately 7.5% through 2033. This upward trajectory is primarily driven by the increasing demand for high-performance, heat-resistant materials across a multitude of industries. Key applications in the industrial sector, particularly in thermal insulation, fire protection, and specialized manufacturing processes, are significant contributors to this growth. The aerospace and military sectors are also crucial, relying on leached silica fabrics for their exceptional thermal stability and lightweight properties in demanding environments. Furthermore, the metallurgy and foundry industries are leveraging these materials for enhanced furnace linings and protective gear, further fueling market expansion. The growing emphasis on energy efficiency and safety regulations across these sectors is expected to sustain this demand.
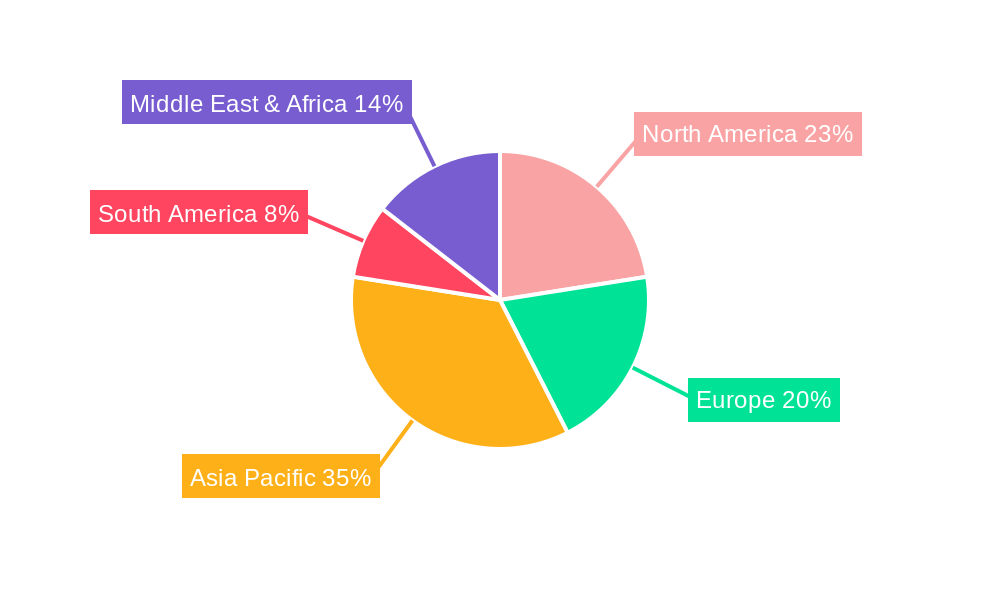
The market segmentation reveals a strong preference for silica content above 96%, indicating a demand for superior performance characteristics. Geographically, Asia Pacific, led by China and India, is emerging as a dominant force in the leached silica fabrics market, owing to its burgeoning manufacturing base and increasing investments in infrastructure and advanced industries. North America and Europe also represent significant markets, driven by established industrial bases and stringent quality standards. While the market presents substantial opportunities, restraints such as the relatively high cost of production compared to conventional fabrics and the availability of substitute materials could pose challenges. However, ongoing technological advancements in manufacturing processes and the development of novel applications are expected to mitigate these constraints and propel the market forward. Key players are actively investing in research and development to enhance product offerings and expand their global reach, ensuring a dynamic competitive landscape.
Leached Silica Fabrics Market: Unveiling Growth Drivers, Innovations, and Competitive Landscape (2019-2033)
This comprehensive report offers an in-depth analysis of the global Leached Silica Fabrics market, providing critical insights for industry stakeholders. Covering a study period from 2019 to 2033, with a base year of 2025, this report delves into market dynamics, key trends, segment dominance, product developments, challenges, growth drivers, and emerging opportunities. With a projected market size of over $500 million and a CAGR of approximately 6.5% during the forecast period (2025-2033), this report is essential for understanding the future trajectory of this vital industrial material.
Leached Silica Fabrics Market Concentration & Dynamics
The global Leached Silica Fabrics market exhibits a moderate concentration, with a blend of established global players and emerging regional manufacturers. The innovation ecosystem is driven by increasing demand for high-performance materials in challenging environments, leading to continuous research and development in fabric properties and manufacturing processes. Regulatory frameworks are largely centered around material safety, environmental impact, and performance standards, influencing product development and market entry. Substitute products, such as certain high-temperature ceramic fibers and advanced polymer composites, pose a competitive threat, but leached silica fabrics maintain a distinct advantage in specific applications due to their unique thermal and chemical resistance. End-user trends are increasingly leaning towards customized solutions and improved durability, pushing manufacturers to offer a wider range of product specifications. Merger and acquisition (M&A) activities have been observed, particularly among companies seeking to expand their product portfolios and geographical reach, with an estimated number of 5-8 significant M&A deals recorded within the historical period. Market share is fragmented, with the top 5 players estimated to hold approximately 40-50% of the total market revenue.
Leached Silica Fabrics Industry Insights & Trends
The Leached Silica Fabrics industry is poised for significant expansion, driven by an escalating demand for advanced materials across various critical sectors. The market size, estimated to be over $400 million in 2024, is projected to surpass $700 million by 2033. The Compound Annual Growth Rate (CAGR) is anticipated to remain robust at approximately 6.5% throughout the forecast period (2025–2033). Key growth drivers include the burgeoning aerospace industry's need for lightweight, high-temperature resistant materials for aircraft components, and the burgeoning automotive sector's adoption of these fabrics for thermal management and insulation in electric vehicle batteries. The increasing emphasis on energy efficiency and safety in industrial processes, such as metallurgy and foundry operations, further fuels demand. Technological disruptions are characterized by advancements in weaving techniques and silica purification processes, leading to fabrics with enhanced tensile strength, reduced fiber migration, and superior thermal insulation properties. Evolving consumer behaviors, particularly in industrial procurement, are shifting towards suppliers offering greater technical support, customization options, and sustainable manufacturing practices. The growing preference for materials that can withstand extreme temperatures and harsh chemical environments ensures a sustained upward trajectory for leached silica fabrics. The forecast period will likely witness intensified innovation in areas such as nanocomposite integration and fire-retardant coatings to meet ever-increasing performance benchmarks.
Key Markets & Segments Leading Leached Silica Fabrics
The Industrial application segment stands as the dominant force in the Leached Silica Fabrics market, accounting for an estimated 45% of the total market revenue. This dominance is underpinned by extensive use in high-temperature insulation, protective apparel, and specialized filtration systems across a multitude of heavy industries. Economic growth and infrastructure development worldwide are significant drivers for this segment, directly correlating with increased manufacturing output and the need for robust industrial materials.
Within the Industrial segment, the Metallurgy and Foundry sub-segment is a particularly strong contributor, driven by the critical requirement for materials that can withstand molten metal temperatures and harsh furnace environments. The continuous need for energy-efficient furnace linings, insulating blankets, and protective equipment for workers in these sectors propels consistent demand for leached silica fabrics.
The Aerospace sector represents a rapidly growing segment, projected to experience a CAGR of over 7.5% during the forecast period. Its dominance is fueled by the stringent performance requirements of aircraft manufacturing, including fire blocking, thermal insulation, and the development of advanced composite structures. Stringent safety regulations and the ongoing push for lighter, more fuel-efficient aircraft are key drivers.
The Silica Above 96% type segment is currently the market leader, representing approximately 60% of the overall leached silica fabric market. This preference is attributed to its superior performance characteristics, such as higher temperature resistance and lower thermal conductivity, making it ideal for the most demanding applications in aerospace, metallurgy, and high-performance industrial settings.
The Military application segment, while smaller in volume, exhibits substantial growth potential due to the increasing demand for advanced protective materials in defense equipment and personnel gear. The need for lightweight, fire-resistant, and chemically stable fabrics in combat environments is a key driver.
The Others application segment, encompassing niche markets like renewable energy (e.g., solar thermal applications) and specialized chemical processing, is expected to witness steady growth, driven by innovation and the expansion of specialized industrial processes.
Leached Silica Fabrics Product Developments
Recent product developments in Leached Silica Fabrics are primarily focused on enhancing thermal performance, increasing durability, and expanding application versatility. Manufacturers are innovating in weaving technologies to create denser fabrics with improved tensile strength and abrasion resistance. advancements in silica purification processes are yielding fabrics with ultra-low alkali content, further boosting high-temperature stability and chemical inertness. New product formulations are emerging with integrated fire-retardant properties and specialized coatings designed for extreme corrosive environments. These innovations are crucial for meeting the evolving demands of the aerospace, automotive, and industrial sectors, providing competitive advantages through superior performance and tailored solutions for challenging operating conditions.
Challenges in the Leached Silica Fabrics Market
Despite robust growth, the Leached Silica Fabrics market faces several challenges. The primary restraint is the high cost of production, particularly for high-purity (>96%) silica fabrics, which can limit adoption in cost-sensitive applications. Stringent environmental regulations regarding the handling and disposal of certain silica-based materials can also pose compliance hurdles and increase operational expenses. Furthermore, the availability and price volatility of raw silica can impact manufacturing costs and supply chain stability. Intense competition from alternative high-temperature materials, such as advanced ceramics and specialized polymer composites, necessitates continuous innovation and competitive pricing strategies. The complexity of specialized application requirements demands significant technical expertise and customization, which can be a barrier for smaller manufacturers.
Forces Driving Leached Silica Fabrics Growth
Several key forces are propelling the growth of the Leached Silica Fabrics market. Technological advancements in manufacturing processes, leading to enhanced material properties like superior thermal insulation and chemical resistance, are paramount. The increasing global demand for high-performance materials in critical industries such as aerospace, automotive (especially EVs), and energy is a significant catalyst. Strict safety regulations and a growing emphasis on fire safety across various sectors directly translate to increased demand for fire-resistant leached silica fabrics. Furthermore, the trend towards miniaturization and lightweighting in aerospace and automotive applications favors the use of these materials for their excellent strength-to-weight ratio.
Challenges in the Leached Silica Fabrics Market
Long-term growth catalysts for the Leached Silica Fabrics market are rooted in continuous innovation and strategic market expansion. The development of novel composite materials incorporating leached silica fabrics for enhanced mechanical and thermal properties will unlock new application frontiers. Strategic partnerships and collaborations between fabric manufacturers and end-users will foster the creation of tailored solutions for emerging technologies, such as advanced battery systems and high-temperature industrial processes. Exploring and penetrating new geographical markets with developing industrial bases will also contribute significantly to sustained growth. Furthermore, investments in research and development to achieve even higher purity levels and improved processing efficiencies will solidify the market's competitive edge.
Emerging Opportunities in Leached Silica Fabrics
Emerging opportunities in the Leached Silica Fabrics market lie in the growing demand for advanced materials in the renewable energy sector, particularly in solar thermal applications and high-temperature insulation for energy storage systems. The expanding electric vehicle (EV) market presents a substantial opportunity for leached silica fabrics in thermal management solutions for battery packs and other critical components, where fire safety and heat dissipation are paramount. Furthermore, the increasing focus on sustainable manufacturing and circular economy principles may drive innovation in recycling and reprocessing technologies for silica-based materials. The development of smart textiles incorporating leached silica for specialized sensing or enhanced protective functions also represents a nascent but promising avenue for future growth.
Leading Players in the Leached Silica Fabrics Sector
- Hiltex Technische Weefsels
- Shreeji Industries
- PAR Group
- Mid-Mountain
- Auburn Manufacturing
- IC International
- Anhui Ningguo Hantai New Materials
- AVS Industries
- McAllister Mills
- Newtex
- Great Lakes Textiles
- VATI
- Valmieras Stikla Skiedra
- Nanjing Gao Geya
- Nanjing Tianyuan Fiberglass Material
- Jiangsu Jiuding New Material
Key Milestones in Leached Silica Fabrics Industry
- 2019: Increased focus on developing ultra-high purity (above 99%) leached silica fabrics for advanced aerospace applications.
- 2020: Introduction of novel weaving techniques leading to enhanced fabric density and reduced permeability.
- 2021: Growing adoption of leached silica fabrics in thermal insulation for next-generation electric vehicle battery systems.
- 2022: Significant investments in R&D for fire-retardant coatings and composite integration.
- 2023: Emergence of regional players in Asia-Pacific, expanding manufacturing capabilities and market reach.
- 2024: Growing regulatory pressure for sustainable material sourcing and manufacturing processes.
Strategic Outlook for Leached Silica Fabrics Market
The strategic outlook for the Leached Silica Fabrics market is overwhelmingly positive, driven by innovation and expanding application frontiers. Future growth will be accelerated by the continued demand for high-performance materials in critical sectors like aerospace, automotive, and specialized industrial processes. Strategic focus on developing customized solutions, leveraging advancements in material science for enhanced thermal and chemical resistance, and exploring new application areas in renewable energy and defense will be crucial. Emphasis on sustainable manufacturing practices and building strong partnerships with end-users will further solidify market leadership and unlock significant future potential in this dynamic industry.
Leached Silica Fabrics Segmentation
-
1. Application
- 1.1. Industrial
- 1.2. Aerospace
- 1.3. Military
- 1.4. Metallurgy and Foundry
- 1.5. Others
-
2. Types
- 2.1. Silica Below 96%
- 2.2. Silica Above 96%
Leached Silica Fabrics Segmentation By Geography
-
1. North America
- 1.1. United States
- 1.2. Canada
- 1.3. Mexico
-
2. South America
- 2.1. Brazil
- 2.2. Argentina
- 2.3. Rest of South America
-
3. Europe
- 3.1. United Kingdom
- 3.2. Germany
- 3.3. France
- 3.4. Italy
- 3.5. Spain
- 3.6. Russia
- 3.7. Benelux
- 3.8. Nordics
- 3.9. Rest of Europe
-
4. Middle East & Africa
- 4.1. Turkey
- 4.2. Israel
- 4.3. GCC
- 4.4. North Africa
- 4.5. South Africa
- 4.6. Rest of Middle East & Africa
-
5. Asia Pacific
- 5.1. China
- 5.2. India
- 5.3. Japan
- 5.4. South Korea
- 5.5. ASEAN
- 5.6. Oceania
- 5.7. Rest of Asia Pacific
Leached Silica Fabrics REPORT HIGHLIGHTS
| Aspects | Details |
|---|---|
| Study Period | 2019-2033 |
| Base Year | 2024 |
| Estimated Year | 2025 |
| Forecast Period | 2025-2033 |
| Historical Period | 2019-2024 |
| Growth Rate | CAGR of XX% from 2019-2033 |
| Segmentation |
|
Table of Contents
- 1. Introduction
- 1.1. Research Scope
- 1.2. Market Segmentation
- 1.3. Research Methodology
- 1.4. Definitions and Assumptions
- 2. Executive Summary
- 2.1. Introduction
- 3. Market Dynamics
- 3.1. Introduction
- 3.2. Market Drivers
- 3.3. Market Restrains
- 3.4. Market Trends
- 4. Market Factor Analysis
- 4.1. Porters Five Forces
- 4.2. Supply/Value Chain
- 4.3. PESTEL analysis
- 4.4. Market Entropy
- 4.5. Patent/Trademark Analysis
- 5. Global Leached Silica Fabrics Analysis, Insights and Forecast, 2019-2031
- 5.1. Market Analysis, Insights and Forecast - by Application
- 5.1.1. Industrial
- 5.1.2. Aerospace
- 5.1.3. Military
- 5.1.4. Metallurgy and Foundry
- 5.1.5. Others
- 5.2. Market Analysis, Insights and Forecast - by Types
- 5.2.1. Silica Below 96%
- 5.2.2. Silica Above 96%
- 5.3. Market Analysis, Insights and Forecast - by Region
- 5.3.1. North America
- 5.3.2. South America
- 5.3.3. Europe
- 5.3.4. Middle East & Africa
- 5.3.5. Asia Pacific
- 5.1. Market Analysis, Insights and Forecast - by Application
- 6. North America Leached Silica Fabrics Analysis, Insights and Forecast, 2019-2031
- 6.1. Market Analysis, Insights and Forecast - by Application
- 6.1.1. Industrial
- 6.1.2. Aerospace
- 6.1.3. Military
- 6.1.4. Metallurgy and Foundry
- 6.1.5. Others
- 6.2. Market Analysis, Insights and Forecast - by Types
- 6.2.1. Silica Below 96%
- 6.2.2. Silica Above 96%
- 6.1. Market Analysis, Insights and Forecast - by Application
- 7. South America Leached Silica Fabrics Analysis, Insights and Forecast, 2019-2031
- 7.1. Market Analysis, Insights and Forecast - by Application
- 7.1.1. Industrial
- 7.1.2. Aerospace
- 7.1.3. Military
- 7.1.4. Metallurgy and Foundry
- 7.1.5. Others
- 7.2. Market Analysis, Insights and Forecast - by Types
- 7.2.1. Silica Below 96%
- 7.2.2. Silica Above 96%
- 7.1. Market Analysis, Insights and Forecast - by Application
- 8. Europe Leached Silica Fabrics Analysis, Insights and Forecast, 2019-2031
- 8.1. Market Analysis, Insights and Forecast - by Application
- 8.1.1. Industrial
- 8.1.2. Aerospace
- 8.1.3. Military
- 8.1.4. Metallurgy and Foundry
- 8.1.5. Others
- 8.2. Market Analysis, Insights and Forecast - by Types
- 8.2.1. Silica Below 96%
- 8.2.2. Silica Above 96%
- 8.1. Market Analysis, Insights and Forecast - by Application
- 9. Middle East & Africa Leached Silica Fabrics Analysis, Insights and Forecast, 2019-2031
- 9.1. Market Analysis, Insights and Forecast - by Application
- 9.1.1. Industrial
- 9.1.2. Aerospace
- 9.1.3. Military
- 9.1.4. Metallurgy and Foundry
- 9.1.5. Others
- 9.2. Market Analysis, Insights and Forecast - by Types
- 9.2.1. Silica Below 96%
- 9.2.2. Silica Above 96%
- 9.1. Market Analysis, Insights and Forecast - by Application
- 10. Asia Pacific Leached Silica Fabrics Analysis, Insights and Forecast, 2019-2031
- 10.1. Market Analysis, Insights and Forecast - by Application
- 10.1.1. Industrial
- 10.1.2. Aerospace
- 10.1.3. Military
- 10.1.4. Metallurgy and Foundry
- 10.1.5. Others
- 10.2. Market Analysis, Insights and Forecast - by Types
- 10.2.1. Silica Below 96%
- 10.2.2. Silica Above 96%
- 10.1. Market Analysis, Insights and Forecast - by Application
- 11. Competitive Analysis
- 11.1. Global Market Share Analysis 2024
- 11.2. Company Profiles
- 11.2.1 Hiltex Technische Weefsels
- 11.2.1.1. Overview
- 11.2.1.2. Products
- 11.2.1.3. SWOT Analysis
- 11.2.1.4. Recent Developments
- 11.2.1.5. Financials (Based on Availability)
- 11.2.2 Shreeji Industries
- 11.2.2.1. Overview
- 11.2.2.2. Products
- 11.2.2.3. SWOT Analysis
- 11.2.2.4. Recent Developments
- 11.2.2.5. Financials (Based on Availability)
- 11.2.3 PAR Group
- 11.2.3.1. Overview
- 11.2.3.2. Products
- 11.2.3.3. SWOT Analysis
- 11.2.3.4. Recent Developments
- 11.2.3.5. Financials (Based on Availability)
- 11.2.4 Mid-Mountain
- 11.2.4.1. Overview
- 11.2.4.2. Products
- 11.2.4.3. SWOT Analysis
- 11.2.4.4. Recent Developments
- 11.2.4.5. Financials (Based on Availability)
- 11.2.5 Auburn Manufacturing
- 11.2.5.1. Overview
- 11.2.5.2. Products
- 11.2.5.3. SWOT Analysis
- 11.2.5.4. Recent Developments
- 11.2.5.5. Financials (Based on Availability)
- 11.2.6 IC International
- 11.2.6.1. Overview
- 11.2.6.2. Products
- 11.2.6.3. SWOT Analysis
- 11.2.6.4. Recent Developments
- 11.2.6.5. Financials (Based on Availability)
- 11.2.7 Anhui Ningguo Hantai New Materials
- 11.2.7.1. Overview
- 11.2.7.2. Products
- 11.2.7.3. SWOT Analysis
- 11.2.7.4. Recent Developments
- 11.2.7.5. Financials (Based on Availability)
- 11.2.8 AVS Industries
- 11.2.8.1. Overview
- 11.2.8.2. Products
- 11.2.8.3. SWOT Analysis
- 11.2.8.4. Recent Developments
- 11.2.8.5. Financials (Based on Availability)
- 11.2.9 McAllister Mills
- 11.2.9.1. Overview
- 11.2.9.2. Products
- 11.2.9.3. SWOT Analysis
- 11.2.9.4. Recent Developments
- 11.2.9.5. Financials (Based on Availability)
- 11.2.10 Newtex
- 11.2.10.1. Overview
- 11.2.10.2. Products
- 11.2.10.3. SWOT Analysis
- 11.2.10.4. Recent Developments
- 11.2.10.5. Financials (Based on Availability)
- 11.2.11 Great Lakes Textiles
- 11.2.11.1. Overview
- 11.2.11.2. Products
- 11.2.11.3. SWOT Analysis
- 11.2.11.4. Recent Developments
- 11.2.11.5. Financials (Based on Availability)
- 11.2.12 VATI
- 11.2.12.1. Overview
- 11.2.12.2. Products
- 11.2.12.3. SWOT Analysis
- 11.2.12.4. Recent Developments
- 11.2.12.5. Financials (Based on Availability)
- 11.2.13 Valmieras Stikla Skiedra
- 11.2.13.1. Overview
- 11.2.13.2. Products
- 11.2.13.3. SWOT Analysis
- 11.2.13.4. Recent Developments
- 11.2.13.5. Financials (Based on Availability)
- 11.2.14 Nanjing Gao Geya
- 11.2.14.1. Overview
- 11.2.14.2. Products
- 11.2.14.3. SWOT Analysis
- 11.2.14.4. Recent Developments
- 11.2.14.5. Financials (Based on Availability)
- 11.2.15 Nanjing Tianyuan Fiberglass Material
- 11.2.15.1. Overview
- 11.2.15.2. Products
- 11.2.15.3. SWOT Analysis
- 11.2.15.4. Recent Developments
- 11.2.15.5. Financials (Based on Availability)
- 11.2.16 Jiangsu Jiuding New Material
- 11.2.16.1. Overview
- 11.2.16.2. Products
- 11.2.16.3. SWOT Analysis
- 11.2.16.4. Recent Developments
- 11.2.16.5. Financials (Based on Availability)
- 11.2.1 Hiltex Technische Weefsels
List of Figures
- Figure 1: Global Leached Silica Fabrics Revenue Breakdown (million, %) by Region 2024 & 2032
- Figure 2: Global Leached Silica Fabrics Volume Breakdown (K, %) by Region 2024 & 2032
- Figure 3: North America Leached Silica Fabrics Revenue (million), by Application 2024 & 2032
- Figure 4: North America Leached Silica Fabrics Volume (K), by Application 2024 & 2032
- Figure 5: North America Leached Silica Fabrics Revenue Share (%), by Application 2024 & 2032
- Figure 6: North America Leached Silica Fabrics Volume Share (%), by Application 2024 & 2032
- Figure 7: North America Leached Silica Fabrics Revenue (million), by Types 2024 & 2032
- Figure 8: North America Leached Silica Fabrics Volume (K), by Types 2024 & 2032
- Figure 9: North America Leached Silica Fabrics Revenue Share (%), by Types 2024 & 2032
- Figure 10: North America Leached Silica Fabrics Volume Share (%), by Types 2024 & 2032
- Figure 11: North America Leached Silica Fabrics Revenue (million), by Country 2024 & 2032
- Figure 12: North America Leached Silica Fabrics Volume (K), by Country 2024 & 2032
- Figure 13: North America Leached Silica Fabrics Revenue Share (%), by Country 2024 & 2032
- Figure 14: North America Leached Silica Fabrics Volume Share (%), by Country 2024 & 2032
- Figure 15: South America Leached Silica Fabrics Revenue (million), by Application 2024 & 2032
- Figure 16: South America Leached Silica Fabrics Volume (K), by Application 2024 & 2032
- Figure 17: South America Leached Silica Fabrics Revenue Share (%), by Application 2024 & 2032
- Figure 18: South America Leached Silica Fabrics Volume Share (%), by Application 2024 & 2032
- Figure 19: South America Leached Silica Fabrics Revenue (million), by Types 2024 & 2032
- Figure 20: South America Leached Silica Fabrics Volume (K), by Types 2024 & 2032
- Figure 21: South America Leached Silica Fabrics Revenue Share (%), by Types 2024 & 2032
- Figure 22: South America Leached Silica Fabrics Volume Share (%), by Types 2024 & 2032
- Figure 23: South America Leached Silica Fabrics Revenue (million), by Country 2024 & 2032
- Figure 24: South America Leached Silica Fabrics Volume (K), by Country 2024 & 2032
- Figure 25: South America Leached Silica Fabrics Revenue Share (%), by Country 2024 & 2032
- Figure 26: South America Leached Silica Fabrics Volume Share (%), by Country 2024 & 2032
- Figure 27: Europe Leached Silica Fabrics Revenue (million), by Application 2024 & 2032
- Figure 28: Europe Leached Silica Fabrics Volume (K), by Application 2024 & 2032
- Figure 29: Europe Leached Silica Fabrics Revenue Share (%), by Application 2024 & 2032
- Figure 30: Europe Leached Silica Fabrics Volume Share (%), by Application 2024 & 2032
- Figure 31: Europe Leached Silica Fabrics Revenue (million), by Types 2024 & 2032
- Figure 32: Europe Leached Silica Fabrics Volume (K), by Types 2024 & 2032
- Figure 33: Europe Leached Silica Fabrics Revenue Share (%), by Types 2024 & 2032
- Figure 34: Europe Leached Silica Fabrics Volume Share (%), by Types 2024 & 2032
- Figure 35: Europe Leached Silica Fabrics Revenue (million), by Country 2024 & 2032
- Figure 36: Europe Leached Silica Fabrics Volume (K), by Country 2024 & 2032
- Figure 37: Europe Leached Silica Fabrics Revenue Share (%), by Country 2024 & 2032
- Figure 38: Europe Leached Silica Fabrics Volume Share (%), by Country 2024 & 2032
- Figure 39: Middle East & Africa Leached Silica Fabrics Revenue (million), by Application 2024 & 2032
- Figure 40: Middle East & Africa Leached Silica Fabrics Volume (K), by Application 2024 & 2032
- Figure 41: Middle East & Africa Leached Silica Fabrics Revenue Share (%), by Application 2024 & 2032
- Figure 42: Middle East & Africa Leached Silica Fabrics Volume Share (%), by Application 2024 & 2032
- Figure 43: Middle East & Africa Leached Silica Fabrics Revenue (million), by Types 2024 & 2032
- Figure 44: Middle East & Africa Leached Silica Fabrics Volume (K), by Types 2024 & 2032
- Figure 45: Middle East & Africa Leached Silica Fabrics Revenue Share (%), by Types 2024 & 2032
- Figure 46: Middle East & Africa Leached Silica Fabrics Volume Share (%), by Types 2024 & 2032
- Figure 47: Middle East & Africa Leached Silica Fabrics Revenue (million), by Country 2024 & 2032
- Figure 48: Middle East & Africa Leached Silica Fabrics Volume (K), by Country 2024 & 2032
- Figure 49: Middle East & Africa Leached Silica Fabrics Revenue Share (%), by Country 2024 & 2032
- Figure 50: Middle East & Africa Leached Silica Fabrics Volume Share (%), by Country 2024 & 2032
- Figure 51: Asia Pacific Leached Silica Fabrics Revenue (million), by Application 2024 & 2032
- Figure 52: Asia Pacific Leached Silica Fabrics Volume (K), by Application 2024 & 2032
- Figure 53: Asia Pacific Leached Silica Fabrics Revenue Share (%), by Application 2024 & 2032
- Figure 54: Asia Pacific Leached Silica Fabrics Volume Share (%), by Application 2024 & 2032
- Figure 55: Asia Pacific Leached Silica Fabrics Revenue (million), by Types 2024 & 2032
- Figure 56: Asia Pacific Leached Silica Fabrics Volume (K), by Types 2024 & 2032
- Figure 57: Asia Pacific Leached Silica Fabrics Revenue Share (%), by Types 2024 & 2032
- Figure 58: Asia Pacific Leached Silica Fabrics Volume Share (%), by Types 2024 & 2032
- Figure 59: Asia Pacific Leached Silica Fabrics Revenue (million), by Country 2024 & 2032
- Figure 60: Asia Pacific Leached Silica Fabrics Volume (K), by Country 2024 & 2032
- Figure 61: Asia Pacific Leached Silica Fabrics Revenue Share (%), by Country 2024 & 2032
- Figure 62: Asia Pacific Leached Silica Fabrics Volume Share (%), by Country 2024 & 2032
List of Tables
- Table 1: Global Leached Silica Fabrics Revenue million Forecast, by Region 2019 & 2032
- Table 2: Global Leached Silica Fabrics Volume K Forecast, by Region 2019 & 2032
- Table 3: Global Leached Silica Fabrics Revenue million Forecast, by Application 2019 & 2032
- Table 4: Global Leached Silica Fabrics Volume K Forecast, by Application 2019 & 2032
- Table 5: Global Leached Silica Fabrics Revenue million Forecast, by Types 2019 & 2032
- Table 6: Global Leached Silica Fabrics Volume K Forecast, by Types 2019 & 2032
- Table 7: Global Leached Silica Fabrics Revenue million Forecast, by Region 2019 & 2032
- Table 8: Global Leached Silica Fabrics Volume K Forecast, by Region 2019 & 2032
- Table 9: Global Leached Silica Fabrics Revenue million Forecast, by Application 2019 & 2032
- Table 10: Global Leached Silica Fabrics Volume K Forecast, by Application 2019 & 2032
- Table 11: Global Leached Silica Fabrics Revenue million Forecast, by Types 2019 & 2032
- Table 12: Global Leached Silica Fabrics Volume K Forecast, by Types 2019 & 2032
- Table 13: Global Leached Silica Fabrics Revenue million Forecast, by Country 2019 & 2032
- Table 14: Global Leached Silica Fabrics Volume K Forecast, by Country 2019 & 2032
- Table 15: United States Leached Silica Fabrics Revenue (million) Forecast, by Application 2019 & 2032
- Table 16: United States Leached Silica Fabrics Volume (K) Forecast, by Application 2019 & 2032
- Table 17: Canada Leached Silica Fabrics Revenue (million) Forecast, by Application 2019 & 2032
- Table 18: Canada Leached Silica Fabrics Volume (K) Forecast, by Application 2019 & 2032
- Table 19: Mexico Leached Silica Fabrics Revenue (million) Forecast, by Application 2019 & 2032
- Table 20: Mexico Leached Silica Fabrics Volume (K) Forecast, by Application 2019 & 2032
- Table 21: Global Leached Silica Fabrics Revenue million Forecast, by Application 2019 & 2032
- Table 22: Global Leached Silica Fabrics Volume K Forecast, by Application 2019 & 2032
- Table 23: Global Leached Silica Fabrics Revenue million Forecast, by Types 2019 & 2032
- Table 24: Global Leached Silica Fabrics Volume K Forecast, by Types 2019 & 2032
- Table 25: Global Leached Silica Fabrics Revenue million Forecast, by Country 2019 & 2032
- Table 26: Global Leached Silica Fabrics Volume K Forecast, by Country 2019 & 2032
- Table 27: Brazil Leached Silica Fabrics Revenue (million) Forecast, by Application 2019 & 2032
- Table 28: Brazil Leached Silica Fabrics Volume (K) Forecast, by Application 2019 & 2032
- Table 29: Argentina Leached Silica Fabrics Revenue (million) Forecast, by Application 2019 & 2032
- Table 30: Argentina Leached Silica Fabrics Volume (K) Forecast, by Application 2019 & 2032
- Table 31: Rest of South America Leached Silica Fabrics Revenue (million) Forecast, by Application 2019 & 2032
- Table 32: Rest of South America Leached Silica Fabrics Volume (K) Forecast, by Application 2019 & 2032
- Table 33: Global Leached Silica Fabrics Revenue million Forecast, by Application 2019 & 2032
- Table 34: Global Leached Silica Fabrics Volume K Forecast, by Application 2019 & 2032
- Table 35: Global Leached Silica Fabrics Revenue million Forecast, by Types 2019 & 2032
- Table 36: Global Leached Silica Fabrics Volume K Forecast, by Types 2019 & 2032
- Table 37: Global Leached Silica Fabrics Revenue million Forecast, by Country 2019 & 2032
- Table 38: Global Leached Silica Fabrics Volume K Forecast, by Country 2019 & 2032
- Table 39: United Kingdom Leached Silica Fabrics Revenue (million) Forecast, by Application 2019 & 2032
- Table 40: United Kingdom Leached Silica Fabrics Volume (K) Forecast, by Application 2019 & 2032
- Table 41: Germany Leached Silica Fabrics Revenue (million) Forecast, by Application 2019 & 2032
- Table 42: Germany Leached Silica Fabrics Volume (K) Forecast, by Application 2019 & 2032
- Table 43: France Leached Silica Fabrics Revenue (million) Forecast, by Application 2019 & 2032
- Table 44: France Leached Silica Fabrics Volume (K) Forecast, by Application 2019 & 2032
- Table 45: Italy Leached Silica Fabrics Revenue (million) Forecast, by Application 2019 & 2032
- Table 46: Italy Leached Silica Fabrics Volume (K) Forecast, by Application 2019 & 2032
- Table 47: Spain Leached Silica Fabrics Revenue (million) Forecast, by Application 2019 & 2032
- Table 48: Spain Leached Silica Fabrics Volume (K) Forecast, by Application 2019 & 2032
- Table 49: Russia Leached Silica Fabrics Revenue (million) Forecast, by Application 2019 & 2032
- Table 50: Russia Leached Silica Fabrics Volume (K) Forecast, by Application 2019 & 2032
- Table 51: Benelux Leached Silica Fabrics Revenue (million) Forecast, by Application 2019 & 2032
- Table 52: Benelux Leached Silica Fabrics Volume (K) Forecast, by Application 2019 & 2032
- Table 53: Nordics Leached Silica Fabrics Revenue (million) Forecast, by Application 2019 & 2032
- Table 54: Nordics Leached Silica Fabrics Volume (K) Forecast, by Application 2019 & 2032
- Table 55: Rest of Europe Leached Silica Fabrics Revenue (million) Forecast, by Application 2019 & 2032
- Table 56: Rest of Europe Leached Silica Fabrics Volume (K) Forecast, by Application 2019 & 2032
- Table 57: Global Leached Silica Fabrics Revenue million Forecast, by Application 2019 & 2032
- Table 58: Global Leached Silica Fabrics Volume K Forecast, by Application 2019 & 2032
- Table 59: Global Leached Silica Fabrics Revenue million Forecast, by Types 2019 & 2032
- Table 60: Global Leached Silica Fabrics Volume K Forecast, by Types 2019 & 2032
- Table 61: Global Leached Silica Fabrics Revenue million Forecast, by Country 2019 & 2032
- Table 62: Global Leached Silica Fabrics Volume K Forecast, by Country 2019 & 2032
- Table 63: Turkey Leached Silica Fabrics Revenue (million) Forecast, by Application 2019 & 2032
- Table 64: Turkey Leached Silica Fabrics Volume (K) Forecast, by Application 2019 & 2032
- Table 65: Israel Leached Silica Fabrics Revenue (million) Forecast, by Application 2019 & 2032
- Table 66: Israel Leached Silica Fabrics Volume (K) Forecast, by Application 2019 & 2032
- Table 67: GCC Leached Silica Fabrics Revenue (million) Forecast, by Application 2019 & 2032
- Table 68: GCC Leached Silica Fabrics Volume (K) Forecast, by Application 2019 & 2032
- Table 69: North Africa Leached Silica Fabrics Revenue (million) Forecast, by Application 2019 & 2032
- Table 70: North Africa Leached Silica Fabrics Volume (K) Forecast, by Application 2019 & 2032
- Table 71: South Africa Leached Silica Fabrics Revenue (million) Forecast, by Application 2019 & 2032
- Table 72: South Africa Leached Silica Fabrics Volume (K) Forecast, by Application 2019 & 2032
- Table 73: Rest of Middle East & Africa Leached Silica Fabrics Revenue (million) Forecast, by Application 2019 & 2032
- Table 74: Rest of Middle East & Africa Leached Silica Fabrics Volume (K) Forecast, by Application 2019 & 2032
- Table 75: Global Leached Silica Fabrics Revenue million Forecast, by Application 2019 & 2032
- Table 76: Global Leached Silica Fabrics Volume K Forecast, by Application 2019 & 2032
- Table 77: Global Leached Silica Fabrics Revenue million Forecast, by Types 2019 & 2032
- Table 78: Global Leached Silica Fabrics Volume K Forecast, by Types 2019 & 2032
- Table 79: Global Leached Silica Fabrics Revenue million Forecast, by Country 2019 & 2032
- Table 80: Global Leached Silica Fabrics Volume K Forecast, by Country 2019 & 2032
- Table 81: China Leached Silica Fabrics Revenue (million) Forecast, by Application 2019 & 2032
- Table 82: China Leached Silica Fabrics Volume (K) Forecast, by Application 2019 & 2032
- Table 83: India Leached Silica Fabrics Revenue (million) Forecast, by Application 2019 & 2032
- Table 84: India Leached Silica Fabrics Volume (K) Forecast, by Application 2019 & 2032
- Table 85: Japan Leached Silica Fabrics Revenue (million) Forecast, by Application 2019 & 2032
- Table 86: Japan Leached Silica Fabrics Volume (K) Forecast, by Application 2019 & 2032
- Table 87: South Korea Leached Silica Fabrics Revenue (million) Forecast, by Application 2019 & 2032
- Table 88: South Korea Leached Silica Fabrics Volume (K) Forecast, by Application 2019 & 2032
- Table 89: ASEAN Leached Silica Fabrics Revenue (million) Forecast, by Application 2019 & 2032
- Table 90: ASEAN Leached Silica Fabrics Volume (K) Forecast, by Application 2019 & 2032
- Table 91: Oceania Leached Silica Fabrics Revenue (million) Forecast, by Application 2019 & 2032
- Table 92: Oceania Leached Silica Fabrics Volume (K) Forecast, by Application 2019 & 2032
- Table 93: Rest of Asia Pacific Leached Silica Fabrics Revenue (million) Forecast, by Application 2019 & 2032
- Table 94: Rest of Asia Pacific Leached Silica Fabrics Volume (K) Forecast, by Application 2019 & 2032
Frequently Asked Questions
1. What is the projected Compound Annual Growth Rate (CAGR) of the Leached Silica Fabrics?
The projected CAGR is approximately XX%.
2. Which companies are prominent players in the Leached Silica Fabrics?
Key companies in the market include Hiltex Technische Weefsels, Shreeji Industries, PAR Group, Mid-Mountain, Auburn Manufacturing, IC International, Anhui Ningguo Hantai New Materials, AVS Industries, McAllister Mills, Newtex, Great Lakes Textiles, VATI, Valmieras Stikla Skiedra, Nanjing Gao Geya, Nanjing Tianyuan Fiberglass Material, Jiangsu Jiuding New Material.
3. What are the main segments of the Leached Silica Fabrics?
The market segments include Application, Types.
4. Can you provide details about the market size?
The market size is estimated to be USD XXX million as of 2022.
5. What are some drivers contributing to market growth?
N/A
6. What are the notable trends driving market growth?
N/A
7. Are there any restraints impacting market growth?
N/A
8. Can you provide examples of recent developments in the market?
N/A
9. What pricing options are available for accessing the report?
Pricing options include single-user, multi-user, and enterprise licenses priced at USD 4350.00, USD 6525.00, and USD 8700.00 respectively.
10. Is the market size provided in terms of value or volume?
The market size is provided in terms of value, measured in million and volume, measured in K.
11. Are there any specific market keywords associated with the report?
Yes, the market keyword associated with the report is "Leached Silica Fabrics," which aids in identifying and referencing the specific market segment covered.
12. How do I determine which pricing option suits my needs best?
The pricing options vary based on user requirements and access needs. Individual users may opt for single-user licenses, while businesses requiring broader access may choose multi-user or enterprise licenses for cost-effective access to the report.
13. Are there any additional resources or data provided in the Leached Silica Fabrics report?
While the report offers comprehensive insights, it's advisable to review the specific contents or supplementary materials provided to ascertain if additional resources or data are available.
14. How can I stay updated on further developments or reports in the Leached Silica Fabrics?
To stay informed about further developments, trends, and reports in the Leached Silica Fabrics, consider subscribing to industry newsletters, following relevant companies and organizations, or regularly checking reputable industry news sources and publications.
Methodology
Step 1 - Identification of Relevant Samples Size from Population Database


Step 2 - Approaches for Defining Global Market Size (Value, Volume* & Price*)

Note*: In applicable scenarios
Step 3 - Data Sources
Primary Research
- Web Analytics
- Survey Reports
- Research Institute
- Latest Research Reports
- Opinion Leaders
Secondary Research
- Annual Reports
- White Paper
- Latest Press Release
- Industry Association
- Paid Database
- Investor Presentations

Step 4 - Data Triangulation
Involves using different sources of information in order to increase the validity of a study
These sources are likely to be stakeholders in a program - participants, other researchers, program staff, other community members, and so on.
Then we put all data in single framework & apply various statistical tools to find out the dynamic on the market.
During the analysis stage, feedback from the stakeholder groups would be compared to determine areas of agreement as well as areas of divergence
