

Key Insights
The Middle East and Africa (MEA) used vehicle market is experiencing robust growth, driven by factors such as rising disposable incomes, increasing urbanization, and a preference for more affordable transportation options compared to new vehicles. The market's compound annual growth rate (CAGR) exceeding 10% signifies significant expansion, particularly within key markets like the United Arab Emirates, Saudi Arabia, and Egypt. The segment breakdown reveals a diverse landscape, with SUVs experiencing strong demand due to their practicality and family-oriented appeal. Organized vendors are gaining market share as consumers seek greater assurance regarding vehicle quality and after-sales services. However, the unorganized sector still plays a significant role, catering to price-sensitive buyers. Growth is tempered by factors such as fluctuating fuel prices, economic instability in certain regions, and government regulations aimed at improving vehicle safety and environmental standards. The market is anticipated to see continuous expansion through 2033, with the introduction of more certified pre-owned programs and online platforms streamlining the buying process, boosting growth in future years. Leading players such as Abdul Latif Jameel Motors and Al-Futtaim Group are well-positioned to capitalize on this growth, while new entrants and innovative business models continue to emerge.
The forecast for the MEA used vehicle market reflects optimistic projections, building upon the strong performance witnessed in recent years. The expanding middle class across the region, coupled with favorable financing options and an increasing number of used vehicle dealerships, further fuels this growth trajectory. While challenges remain, such as managing the influx of imported used vehicles and ensuring consistent quality control, the long-term outlook for the MEA used vehicle market remains positive. Technological advancements, including online marketplaces and digital inspection tools, are revolutionizing the consumer experience and contributing to increased transparency and efficiency in the used vehicle market. This positive trend will support continued growth and attract significant investment in the coming decade, reshaping the competitive landscape.
MEA Used Vehicle Market Report: 2019-2033
Dive into the comprehensive analysis of the Middle East and Africa (MEA) used vehicle market, a dynamic sector poised for significant growth. This in-depth report provides actionable insights into market trends, key players, and future opportunities, covering the period 2019-2033. Discover the latest market dynamics, growth drivers, and challenges impacting this lucrative market. This report is an essential resource for industry stakeholders, investors, and strategic decision-makers seeking a competitive edge in the rapidly evolving MEA used vehicle landscape.

MEA Used Vehicle Market Concentration & Dynamics
The MEA used vehicle market exhibits a moderately concentrated structure, with a few dominant players like Abdul Latif Jameel Motors, Al-Futtaim Group, and Global Cars Trading FZ LLC commanding significant market share. However, the presence of numerous smaller, unorganized vendors creates a fragmented landscape. The market is characterized by an increasingly competitive environment fueled by technological advancements, evolving consumer preferences, and regulatory changes.
- Market Concentration: The top 5 players hold approximately xx% of the market share in 2024, indicating moderate concentration.
- Innovation Ecosystems: Digital platforms like ADIB's car marketplace are transforming the industry, promoting transparency and convenience. However, technological adoption varies across countries.
- Regulatory Frameworks: Varying regulations across MEA countries impact market dynamics, particularly regarding vehicle inspections and import/export procedures.
- Substitute Products: The emergence of ride-hailing services and car-sharing programs presents competitive pressures for the used vehicle market.
- End-User Trends: Growing urbanization, increasing disposable incomes, and preference for SUVs are driving demand.
- M&A Activities: The number of M&A deals in the MEA used vehicle market has averaged xx per year during the historical period (2019-2024), suggesting moderate consolidation.
MEA Used Vehicle Market Industry Insights & Trends
The MEA used vehicle market experienced robust growth during the historical period (2019-2024), with a Compound Annual Growth Rate (CAGR) of xx%. This growth is primarily driven by increasing urbanization, rising disposable incomes, and a growing preference for personal mobility. The market size reached approximately $xx Million in 2024 and is projected to reach $xx Million by 2025, continuing its upward trajectory with a forecasted CAGR of xx% during 2025-2033. Technological disruptions, such as online marketplaces and digital financing options, are further accelerating market expansion. Shifting consumer preferences, particularly towards SUVs and a greater emphasis on vehicle condition and history, are also influencing market dynamics. The emergence of subscription-based models for used vehicles is anticipated to further reshape the market landscape in the coming years.

Key Markets & Segments Leading MEA Used Vehicle Market
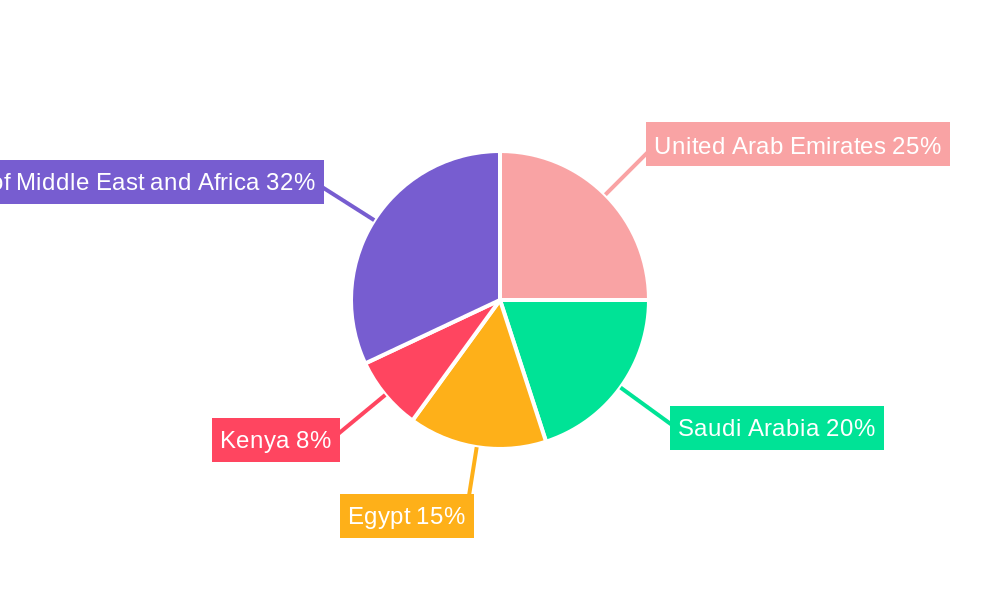
The UAE, Saudi Arabia, and Egypt represent the largest markets within the MEA region, driven by strong economic growth, robust infrastructure, and a sizable population base. The SUV segment dominates vehicle type preferences, fuelled by family-oriented needs and a preference for larger vehicles suitable for varied terrains. The organized vendor segment holds a larger market share than the unorganized sector, reflecting a gradual professionalization of the market.
- Regional Dominance: UAE, Saudi Arabia, and Egypt are the leading markets.
- Country-Specific Drivers:
- UAE: Strong infrastructure, high disposable income, and a significant expat population.
- Saudi Arabia: Economic diversification, Vision 2030 initiatives, and a growing middle class.
- Egypt: Large population, increasing urbanization, and a growing automotive sector.
- Kenya: Growing middle class and increasing demand for personal mobility.
- Segment Dominance: SUVs are the most popular vehicle type. Organized vendors have a larger market share due to greater consumer trust and better quality services.
MEA Used Vehicle Market Product Developments
Significant advancements in vehicle inspection technologies, online marketplaces, and financing options are transforming the used vehicle market. These developments enhance consumer trust, streamline transactions, and provide greater transparency. The increasing use of data analytics to assess vehicle history and predict maintenance needs is also gaining traction. These innovations are not only creating a more efficient market but also differentiating players and boosting consumer confidence.
Challenges in the MEA Used Vehicle Market Market
The MEA used vehicle market faces challenges including inconsistent regulatory frameworks across different countries, supply chain disruptions that affect vehicle availability, and intense competition from both organized and unorganized vendors. Counterfeit parts and lack of transparency in pricing further complicate the market. These factors collectively impact market growth and profitability for individual businesses.
Forces Driving MEA Used Vehicle Market Growth
The MEA used vehicle market is propelled by several factors including rising disposable incomes, increasing urbanization, and evolving consumer preferences toward SUVs. Government initiatives promoting automotive sector development and the increasing adoption of digital platforms for vehicle sales and financing are also important contributors to market growth.
Challenges in the MEA Used Vehicle Market Market
Long-term growth hinges on addressing regulatory inconsistencies, improving supply chain efficiency, and fostering greater transparency. Investments in technology and strategic partnerships can mitigate challenges and unlock further market potential.
Emerging Opportunities in MEA Used Vehicle Market
Opportunities lie in expanding into less penetrated markets, leveraging technology for enhanced customer experience, and developing specialized services such as vehicle refurbishment and financing solutions. The adoption of subscription models and focus on sustainable used vehicle solutions also present promising opportunities.
Leading Players in the MEA Used Vehicle Market Sector
- Abdul Latif Jameel Motors
- Global Cars Trading FZ LLC
- Kayishha
- Abi Sayara
- Dubizzle Motors LLC
- Al-Futtaim Group
- Yallamotor
- Bavaria Motors
Key Milestones in MEA Used Vehicle Market Industry
- March 2022: ADIB launched the UAE's largest digital car marketplace, significantly improving buyer access to vehicles and financing. This streamlined the buying process and boosted market transparency.
Strategic Outlook for MEA Used Vehicle Market Market
The MEA used vehicle market holds immense potential for growth, driven by strong underlying economic trends and technological innovations. Strategic partnerships, investments in technology, and a focus on customer experience are essential for businesses to capitalize on the opportunities and navigate the challenges in this dynamic market. Expanding into new markets and exploring new business models, like vehicle subscription services, are key strategic imperatives for achieving long-term success.
MEA Used Vehicle Market Segmentation
-
1. Vehicle Type
- 1.1. Hachbacks
- 1.2. Sedan
- 1.3. Sports Utility vehicles (SUV)
-
2. Vendor Type
- 2.1. Organized
- 2.2. Unorganized
MEA Used Vehicle Market Segmentation By Geography
-
1. North America
- 1.1. United States
- 1.2. Canada
- 1.3. Mexico
-
2. South America
- 2.1. Brazil
- 2.2. Argentina
- 2.3. Rest of South America
-
3. Europe
- 3.1. United Kingdom
- 3.2. Germany
- 3.3. France
- 3.4. Italy
- 3.5. Spain
- 3.6. Russia
- 3.7. Benelux
- 3.8. Nordics
- 3.9. Rest of Europe
-
4. Middle East & Africa
- 4.1. Turkey
- 4.2. Israel
- 4.3. GCC
- 4.4. North Africa
- 4.5. South Africa
- 4.6. Rest of Middle East & Africa
-
5. Asia Pacific
- 5.1. China
- 5.2. India
- 5.3. Japan
- 5.4. South Korea
- 5.5. ASEAN
- 5.6. Oceania
- 5.7. Rest of Asia Pacific
MEA Used Vehicle Market REPORT HIGHLIGHTS
| Aspects | Details |
|---|---|
| Study Period | 2019-2033 |
| Base Year | 2024 |
| Estimated Year | 2025 |
| Forecast Period | 2025-2033 |
| Historical Period | 2019-2024 |
| Growth Rate | CAGR of > 10.00% from 2019-2033 |
| Segmentation |
|
Table of Contents
- 1. Introduction
- 1.1. Research Scope
- 1.2. Market Segmentation
- 1.3. Research Methodology
- 1.4. Definitions and Assumptions
- 2. Executive Summary
- 2.1. Introduction
- 3. Market Dynamics
- 3.1. Introduction
- 3.2. Market Drivers
- 3.2.1. The Increasing Demand for Luxury Cars is Anticipated to Boost the Market
- 3.3. Market Restrains
- 3.3.1. Comparatively Limited Market Transparency May Hinder the Market
- 3.4. Market Trends
- 3.4.1. Shift towards Unorganized Vendor to Elevate Used Cars Sales In Middle-East and Africa
- 4. Market Factor Analysis
- 4.1. Porters Five Forces
- 4.2. Supply/Value Chain
- 4.3. PESTEL analysis
- 4.4. Market Entropy
- 4.5. Patent/Trademark Analysis
- 5. Global MEA Used Vehicle Market Analysis, Insights and Forecast, 2019-2031
- 5.1. Market Analysis, Insights and Forecast - by Vehicle Type
- 5.1.1. Hachbacks
- 5.1.2. Sedan
- 5.1.3. Sports Utility vehicles (SUV)
- 5.2. Market Analysis, Insights and Forecast - by Vendor Type
- 5.2.1. Organized
- 5.2.2. Unorganized
- 5.3. Market Analysis, Insights and Forecast - by Region
- 5.3.1. North America
- 5.3.2. South America
- 5.3.3. Europe
- 5.3.4. Middle East & Africa
- 5.3.5. Asia Pacific
- 5.1. Market Analysis, Insights and Forecast - by Vehicle Type
- 6. North America MEA Used Vehicle Market Analysis, Insights and Forecast, 2019-2031
- 6.1. Market Analysis, Insights and Forecast - by Vehicle Type
- 6.1.1. Hachbacks
- 6.1.2. Sedan
- 6.1.3. Sports Utility vehicles (SUV)
- 6.2. Market Analysis, Insights and Forecast - by Vendor Type
- 6.2.1. Organized
- 6.2.2. Unorganized
- 6.1. Market Analysis, Insights and Forecast - by Vehicle Type
- 7. South America MEA Used Vehicle Market Analysis, Insights and Forecast, 2019-2031
- 7.1. Market Analysis, Insights and Forecast - by Vehicle Type
- 7.1.1. Hachbacks
- 7.1.2. Sedan
- 7.1.3. Sports Utility vehicles (SUV)
- 7.2. Market Analysis, Insights and Forecast - by Vendor Type
- 7.2.1. Organized
- 7.2.2. Unorganized
- 7.1. Market Analysis, Insights and Forecast - by Vehicle Type
- 8. Europe MEA Used Vehicle Market Analysis, Insights and Forecast, 2019-2031
- 8.1. Market Analysis, Insights and Forecast - by Vehicle Type
- 8.1.1. Hachbacks
- 8.1.2. Sedan
- 8.1.3. Sports Utility vehicles (SUV)
- 8.2. Market Analysis, Insights and Forecast - by Vendor Type
- 8.2.1. Organized
- 8.2.2. Unorganized
- 8.1. Market Analysis, Insights and Forecast - by Vehicle Type
- 9. Middle East & Africa MEA Used Vehicle Market Analysis, Insights and Forecast, 2019-2031
- 9.1. Market Analysis, Insights and Forecast - by Vehicle Type
- 9.1.1. Hachbacks
- 9.1.2. Sedan
- 9.1.3. Sports Utility vehicles (SUV)
- 9.2. Market Analysis, Insights and Forecast - by Vendor Type
- 9.2.1. Organized
- 9.2.2. Unorganized
- 9.1. Market Analysis, Insights and Forecast - by Vehicle Type
- 10. Asia Pacific MEA Used Vehicle Market Analysis, Insights and Forecast, 2019-2031
- 10.1. Market Analysis, Insights and Forecast - by Vehicle Type
- 10.1.1. Hachbacks
- 10.1.2. Sedan
- 10.1.3. Sports Utility vehicles (SUV)
- 10.2. Market Analysis, Insights and Forecast - by Vendor Type
- 10.2.1. Organized
- 10.2.2. Unorganized
- 10.1. Market Analysis, Insights and Forecast - by Vehicle Type
- 11. North America MEA Used Vehicle Market Analysis, Insights and Forecast, 2019-2031
- 11.1. Market Analysis, Insights and Forecast - By Country/Sub-region
- 11.1.1 United States
- 11.1.2 Canada
- 11.1.3 Rest of North America
- 12. Europe MEA Used Vehicle Market Analysis, Insights and Forecast, 2019-2031
- 12.1. Market Analysis, Insights and Forecast - By Country/Sub-region
- 12.1.1 Germany
- 12.1.2 United Kingdom
- 12.1.3 France
- 12.1.4 Spain
- 12.1.5 Rest of Europe
- 13. Asia Pacific MEA Used Vehicle Market Analysis, Insights and Forecast, 2019-2031
- 13.1. Market Analysis, Insights and Forecast - By Country/Sub-region
- 13.1.1 India
- 13.1.2 China
- 13.1.3 Japan
- 13.1.4 Rest of Asia Pacific
- 14. Latin America MEA Used Vehicle Market Analysis, Insights and Forecast, 2019-2031
- 14.1. Market Analysis, Insights and Forecast - By Country/Sub-region
- 14.1.1 Mexico
- 14.1.2 Brazil
- 14.1.3 Argentina
- 15. Middle East and Africa MEA Used Vehicle Market Analysis, Insights and Forecast, 2019-2031
- 15.1. Market Analysis, Insights and Forecast - By Country/Sub-region
- 15.1.1 United Arab Emirates
- 15.1.2 Saudi Arabia
- 15.1.3 Rest of Middle East and Africa
- 16. Competitive Analysis
- 16.1. Global Market Share Analysis 2024
- 16.2. Company Profiles
- 16.2.1 Abdul Latif Jameel Motors
- 16.2.1.1. Overview
- 16.2.1.2. Products
- 16.2.1.3. SWOT Analysis
- 16.2.1.4. Recent Developments
- 16.2.1.5. Financials (Based on Availability)
- 16.2.2 Global Cars Trading FZ LLC
- 16.2.2.1. Overview
- 16.2.2.2. Products
- 16.2.2.3. SWOT Analysis
- 16.2.2.4. Recent Developments
- 16.2.2.5. Financials (Based on Availability)
- 16.2.3 Kayishha
- 16.2.3.1. Overview
- 16.2.3.2. Products
- 16.2.3.3. SWOT Analysis
- 16.2.3.4. Recent Developments
- 16.2.3.5. Financials (Based on Availability)
- 16.2.4 Abi Sayara
- 16.2.4.1. Overview
- 16.2.4.2. Products
- 16.2.4.3. SWOT Analysis
- 16.2.4.4. Recent Developments
- 16.2.4.5. Financials (Based on Availability)
- 16.2.5 Dubizzle Motors LLC
- 16.2.5.1. Overview
- 16.2.5.2. Products
- 16.2.5.3. SWOT Analysis
- 16.2.5.4. Recent Developments
- 16.2.5.5. Financials (Based on Availability)
- 16.2.6 Al-Futtaim Group
- 16.2.6.1. Overview
- 16.2.6.2. Products
- 16.2.6.3. SWOT Analysis
- 16.2.6.4. Recent Developments
- 16.2.6.5. Financials (Based on Availability)
- 16.2.7 Yallamotor
- 16.2.7.1. Overview
- 16.2.7.2. Products
- 16.2.7.3. SWOT Analysis
- 16.2.7.4. Recent Developments
- 16.2.7.5. Financials (Based on Availability)
- 16.2.8 Bavaria Motors*List Not Exhaustive
- 16.2.8.1. Overview
- 16.2.8.2. Products
- 16.2.8.3. SWOT Analysis
- 16.2.8.4. Recent Developments
- 16.2.8.5. Financials (Based on Availability)
- 16.2.1 Abdul Latif Jameel Motors
List of Figures
- Figure 1: Global MEA Used Vehicle Market Revenue Breakdown (Million, %) by Region 2024 & 2032
- Figure 2: North America MEA Used Vehicle Market Revenue (Million), by Country 2024 & 2032
- Figure 3: North America MEA Used Vehicle Market Revenue Share (%), by Country 2024 & 2032
- Figure 4: Europe MEA Used Vehicle Market Revenue (Million), by Country 2024 & 2032
- Figure 5: Europe MEA Used Vehicle Market Revenue Share (%), by Country 2024 & 2032
- Figure 6: Asia Pacific MEA Used Vehicle Market Revenue (Million), by Country 2024 & 2032
- Figure 7: Asia Pacific MEA Used Vehicle Market Revenue Share (%), by Country 2024 & 2032
- Figure 8: Latin America MEA Used Vehicle Market Revenue (Million), by Country 2024 & 2032
- Figure 9: Latin America MEA Used Vehicle Market Revenue Share (%), by Country 2024 & 2032
- Figure 10: Middle East and Africa MEA Used Vehicle Market Revenue (Million), by Country 2024 & 2032
- Figure 11: Middle East and Africa MEA Used Vehicle Market Revenue Share (%), by Country 2024 & 2032
- Figure 12: North America MEA Used Vehicle Market Revenue (Million), by Vehicle Type 2024 & 2032
- Figure 13: North America MEA Used Vehicle Market Revenue Share (%), by Vehicle Type 2024 & 2032
- Figure 14: North America MEA Used Vehicle Market Revenue (Million), by Vendor Type 2024 & 2032
- Figure 15: North America MEA Used Vehicle Market Revenue Share (%), by Vendor Type 2024 & 2032
- Figure 16: North America MEA Used Vehicle Market Revenue (Million), by Country 2024 & 2032
- Figure 17: North America MEA Used Vehicle Market Revenue Share (%), by Country 2024 & 2032
- Figure 18: South America MEA Used Vehicle Market Revenue (Million), by Vehicle Type 2024 & 2032
- Figure 19: South America MEA Used Vehicle Market Revenue Share (%), by Vehicle Type 2024 & 2032
- Figure 20: South America MEA Used Vehicle Market Revenue (Million), by Vendor Type 2024 & 2032
- Figure 21: South America MEA Used Vehicle Market Revenue Share (%), by Vendor Type 2024 & 2032
- Figure 22: South America MEA Used Vehicle Market Revenue (Million), by Country 2024 & 2032
- Figure 23: South America MEA Used Vehicle Market Revenue Share (%), by Country 2024 & 2032
- Figure 24: Europe MEA Used Vehicle Market Revenue (Million), by Vehicle Type 2024 & 2032
- Figure 25: Europe MEA Used Vehicle Market Revenue Share (%), by Vehicle Type 2024 & 2032
- Figure 26: Europe MEA Used Vehicle Market Revenue (Million), by Vendor Type 2024 & 2032
- Figure 27: Europe MEA Used Vehicle Market Revenue Share (%), by Vendor Type 2024 & 2032
- Figure 28: Europe MEA Used Vehicle Market Revenue (Million), by Country 2024 & 2032
- Figure 29: Europe MEA Used Vehicle Market Revenue Share (%), by Country 2024 & 2032
- Figure 30: Middle East & Africa MEA Used Vehicle Market Revenue (Million), by Vehicle Type 2024 & 2032
- Figure 31: Middle East & Africa MEA Used Vehicle Market Revenue Share (%), by Vehicle Type 2024 & 2032
- Figure 32: Middle East & Africa MEA Used Vehicle Market Revenue (Million), by Vendor Type 2024 & 2032
- Figure 33: Middle East & Africa MEA Used Vehicle Market Revenue Share (%), by Vendor Type 2024 & 2032
- Figure 34: Middle East & Africa MEA Used Vehicle Market Revenue (Million), by Country 2024 & 2032
- Figure 35: Middle East & Africa MEA Used Vehicle Market Revenue Share (%), by Country 2024 & 2032
- Figure 36: Asia Pacific MEA Used Vehicle Market Revenue (Million), by Vehicle Type 2024 & 2032
- Figure 37: Asia Pacific MEA Used Vehicle Market Revenue Share (%), by Vehicle Type 2024 & 2032
- Figure 38: Asia Pacific MEA Used Vehicle Market Revenue (Million), by Vendor Type 2024 & 2032
- Figure 39: Asia Pacific MEA Used Vehicle Market Revenue Share (%), by Vendor Type 2024 & 2032
- Figure 40: Asia Pacific MEA Used Vehicle Market Revenue (Million), by Country 2024 & 2032
- Figure 41: Asia Pacific MEA Used Vehicle Market Revenue Share (%), by Country 2024 & 2032
List of Tables
- Table 1: Global MEA Used Vehicle Market Revenue Million Forecast, by Region 2019 & 2032
- Table 2: Global MEA Used Vehicle Market Revenue Million Forecast, by Vehicle Type 2019 & 2032
- Table 3: Global MEA Used Vehicle Market Revenue Million Forecast, by Vendor Type 2019 & 2032
- Table 4: Global MEA Used Vehicle Market Revenue Million Forecast, by Region 2019 & 2032
- Table 5: Global MEA Used Vehicle Market Revenue Million Forecast, by Country 2019 & 2032
- Table 6: United States MEA Used Vehicle Market Revenue (Million) Forecast, by Application 2019 & 2032
- Table 7: Canada MEA Used Vehicle Market Revenue (Million) Forecast, by Application 2019 & 2032
- Table 8: Rest of North America MEA Used Vehicle Market Revenue (Million) Forecast, by Application 2019 & 2032
- Table 9: Global MEA Used Vehicle Market Revenue Million Forecast, by Country 2019 & 2032
- Table 10: Germany MEA Used Vehicle Market Revenue (Million) Forecast, by Application 2019 & 2032
- Table 11: United Kingdom MEA Used Vehicle Market Revenue (Million) Forecast, by Application 2019 & 2032
- Table 12: France MEA Used Vehicle Market Revenue (Million) Forecast, by Application 2019 & 2032
- Table 13: Spain MEA Used Vehicle Market Revenue (Million) Forecast, by Application 2019 & 2032
- Table 14: Rest of Europe MEA Used Vehicle Market Revenue (Million) Forecast, by Application 2019 & 2032
- Table 15: Global MEA Used Vehicle Market Revenue Million Forecast, by Country 2019 & 2032
- Table 16: India MEA Used Vehicle Market Revenue (Million) Forecast, by Application 2019 & 2032
- Table 17: China MEA Used Vehicle Market Revenue (Million) Forecast, by Application 2019 & 2032
- Table 18: Japan MEA Used Vehicle Market Revenue (Million) Forecast, by Application 2019 & 2032
- Table 19: Rest of Asia Pacific MEA Used Vehicle Market Revenue (Million) Forecast, by Application 2019 & 2032
- Table 20: Global MEA Used Vehicle Market Revenue Million Forecast, by Country 2019 & 2032
- Table 21: Mexico MEA Used Vehicle Market Revenue (Million) Forecast, by Application 2019 & 2032
- Table 22: Brazil MEA Used Vehicle Market Revenue (Million) Forecast, by Application 2019 & 2032
- Table 23: Argentina MEA Used Vehicle Market Revenue (Million) Forecast, by Application 2019 & 2032
- Table 24: Global MEA Used Vehicle Market Revenue Million Forecast, by Country 2019 & 2032
- Table 25: United Arab Emirates MEA Used Vehicle Market Revenue (Million) Forecast, by Application 2019 & 2032
- Table 26: Saudi Arabia MEA Used Vehicle Market Revenue (Million) Forecast, by Application 2019 & 2032
- Table 27: Rest of Middle East and Africa MEA Used Vehicle Market Revenue (Million) Forecast, by Application 2019 & 2032
- Table 28: Global MEA Used Vehicle Market Revenue Million Forecast, by Vehicle Type 2019 & 2032
- Table 29: Global MEA Used Vehicle Market Revenue Million Forecast, by Vendor Type 2019 & 2032
- Table 30: Global MEA Used Vehicle Market Revenue Million Forecast, by Country 2019 & 2032
- Table 31: United States MEA Used Vehicle Market Revenue (Million) Forecast, by Application 2019 & 2032
- Table 32: Canada MEA Used Vehicle Market Revenue (Million) Forecast, by Application 2019 & 2032
- Table 33: Mexico MEA Used Vehicle Market Revenue (Million) Forecast, by Application 2019 & 2032
- Table 34: Global MEA Used Vehicle Market Revenue Million Forecast, by Vehicle Type 2019 & 2032
- Table 35: Global MEA Used Vehicle Market Revenue Million Forecast, by Vendor Type 2019 & 2032
- Table 36: Global MEA Used Vehicle Market Revenue Million Forecast, by Country 2019 & 2032
- Table 37: Brazil MEA Used Vehicle Market Revenue (Million) Forecast, by Application 2019 & 2032
- Table 38: Argentina MEA Used Vehicle Market Revenue (Million) Forecast, by Application 2019 & 2032
- Table 39: Rest of South America MEA Used Vehicle Market Revenue (Million) Forecast, by Application 2019 & 2032
- Table 40: Global MEA Used Vehicle Market Revenue Million Forecast, by Vehicle Type 2019 & 2032
- Table 41: Global MEA Used Vehicle Market Revenue Million Forecast, by Vendor Type 2019 & 2032
- Table 42: Global MEA Used Vehicle Market Revenue Million Forecast, by Country 2019 & 2032
- Table 43: United Kingdom MEA Used Vehicle Market Revenue (Million) Forecast, by Application 2019 & 2032
- Table 44: Germany MEA Used Vehicle Market Revenue (Million) Forecast, by Application 2019 & 2032
- Table 45: France MEA Used Vehicle Market Revenue (Million) Forecast, by Application 2019 & 2032
- Table 46: Italy MEA Used Vehicle Market Revenue (Million) Forecast, by Application 2019 & 2032
- Table 47: Spain MEA Used Vehicle Market Revenue (Million) Forecast, by Application 2019 & 2032
- Table 48: Russia MEA Used Vehicle Market Revenue (Million) Forecast, by Application 2019 & 2032
- Table 49: Benelux MEA Used Vehicle Market Revenue (Million) Forecast, by Application 2019 & 2032
- Table 50: Nordics MEA Used Vehicle Market Revenue (Million) Forecast, by Application 2019 & 2032
- Table 51: Rest of Europe MEA Used Vehicle Market Revenue (Million) Forecast, by Application 2019 & 2032
- Table 52: Global MEA Used Vehicle Market Revenue Million Forecast, by Vehicle Type 2019 & 2032
- Table 53: Global MEA Used Vehicle Market Revenue Million Forecast, by Vendor Type 2019 & 2032
- Table 54: Global MEA Used Vehicle Market Revenue Million Forecast, by Country 2019 & 2032
- Table 55: Turkey MEA Used Vehicle Market Revenue (Million) Forecast, by Application 2019 & 2032
- Table 56: Israel MEA Used Vehicle Market Revenue (Million) Forecast, by Application 2019 & 2032
- Table 57: GCC MEA Used Vehicle Market Revenue (Million) Forecast, by Application 2019 & 2032
- Table 58: North Africa MEA Used Vehicle Market Revenue (Million) Forecast, by Application 2019 & 2032
- Table 59: South Africa MEA Used Vehicle Market Revenue (Million) Forecast, by Application 2019 & 2032
- Table 60: Rest of Middle East & Africa MEA Used Vehicle Market Revenue (Million) Forecast, by Application 2019 & 2032
- Table 61: Global MEA Used Vehicle Market Revenue Million Forecast, by Vehicle Type 2019 & 2032
- Table 62: Global MEA Used Vehicle Market Revenue Million Forecast, by Vendor Type 2019 & 2032
- Table 63: Global MEA Used Vehicle Market Revenue Million Forecast, by Country 2019 & 2032
- Table 64: China MEA Used Vehicle Market Revenue (Million) Forecast, by Application 2019 & 2032
- Table 65: India MEA Used Vehicle Market Revenue (Million) Forecast, by Application 2019 & 2032
- Table 66: Japan MEA Used Vehicle Market Revenue (Million) Forecast, by Application 2019 & 2032
- Table 67: South Korea MEA Used Vehicle Market Revenue (Million) Forecast, by Application 2019 & 2032
- Table 68: ASEAN MEA Used Vehicle Market Revenue (Million) Forecast, by Application 2019 & 2032
- Table 69: Oceania MEA Used Vehicle Market Revenue (Million) Forecast, by Application 2019 & 2032
- Table 70: Rest of Asia Pacific MEA Used Vehicle Market Revenue (Million) Forecast, by Application 2019 & 2032
Frequently Asked Questions
1. What is the projected Compound Annual Growth Rate (CAGR) of the MEA Used Vehicle Market?
The projected CAGR is approximately > 10.00%.
2. Which companies are prominent players in the MEA Used Vehicle Market?
Key companies in the market include Abdul Latif Jameel Motors, Global Cars Trading FZ LLC, Kayishha, Abi Sayara, Dubizzle Motors LLC, Al-Futtaim Group, Yallamotor, Bavaria Motors*List Not Exhaustive.
3. What are the main segments of the MEA Used Vehicle Market?
The market segments include Vehicle Type, Vendor Type.
4. Can you provide details about the market size?
The market size is estimated to be USD XX Million as of 2022.
5. What are some drivers contributing to market growth?
The Increasing Demand for Luxury Cars is Anticipated to Boost the Market.
6. What are the notable trends driving market growth?
Shift towards Unorganized Vendor to Elevate Used Cars Sales In Middle-East and Africa.
7. Are there any restraints impacting market growth?
Comparatively Limited Market Transparency May Hinder the Market.
8. Can you provide examples of recent developments in the market?
In March 2022, ADIB (Abu Dhabi Islamic Bank) launched the emirates' largest digital car marketplace. Using this digital marketplace, on a single view, consumers can easily search for cars from a wide network of dealers and distributors, schedule a test drive, obtain an insurance quote for the car, and apply for financing for the same. The company discussed the issue with all 775 car dealers in UAE and finally made this digital portal for ease for buyers so that they can have their car from home itself.
9. What pricing options are available for accessing the report?
Pricing options include single-user, multi-user, and enterprise licenses priced at USD 4750, USD 4950, and USD 6800 respectively.
10. Is the market size provided in terms of value or volume?
The market size is provided in terms of value, measured in Million.
11. Are there any specific market keywords associated with the report?
Yes, the market keyword associated with the report is "MEA Used Vehicle Market," which aids in identifying and referencing the specific market segment covered.
12. How do I determine which pricing option suits my needs best?
The pricing options vary based on user requirements and access needs. Individual users may opt for single-user licenses, while businesses requiring broader access may choose multi-user or enterprise licenses for cost-effective access to the report.
13. Are there any additional resources or data provided in the MEA Used Vehicle Market report?
While the report offers comprehensive insights, it's advisable to review the specific contents or supplementary materials provided to ascertain if additional resources or data are available.
14. How can I stay updated on further developments or reports in the MEA Used Vehicle Market?
To stay informed about further developments, trends, and reports in the MEA Used Vehicle Market, consider subscribing to industry newsletters, following relevant companies and organizations, or regularly checking reputable industry news sources and publications.
Methodology
Step 1 - Identification of Relevant Samples Size from Population Database


Step 2 - Approaches for Defining Global Market Size (Value, Volume* & Price*)

Note*: In applicable scenarios
Step 3 - Data Sources
Primary Research
- Web Analytics
- Survey Reports
- Research Institute
- Latest Research Reports
- Opinion Leaders
Secondary Research
- Annual Reports
- White Paper
- Latest Press Release
- Industry Association
- Paid Database
- Investor Presentations

Step 4 - Data Triangulation
Involves using different sources of information in order to increase the validity of a study
These sources are likely to be stakeholders in a program - participants, other researchers, program staff, other community members, and so on.
Then we put all data in single framework & apply various statistical tools to find out the dynamic on the market.
During the analysis stage, feedback from the stakeholder groups would be compared to determine areas of agreement as well as areas of divergence
