

Key Insights
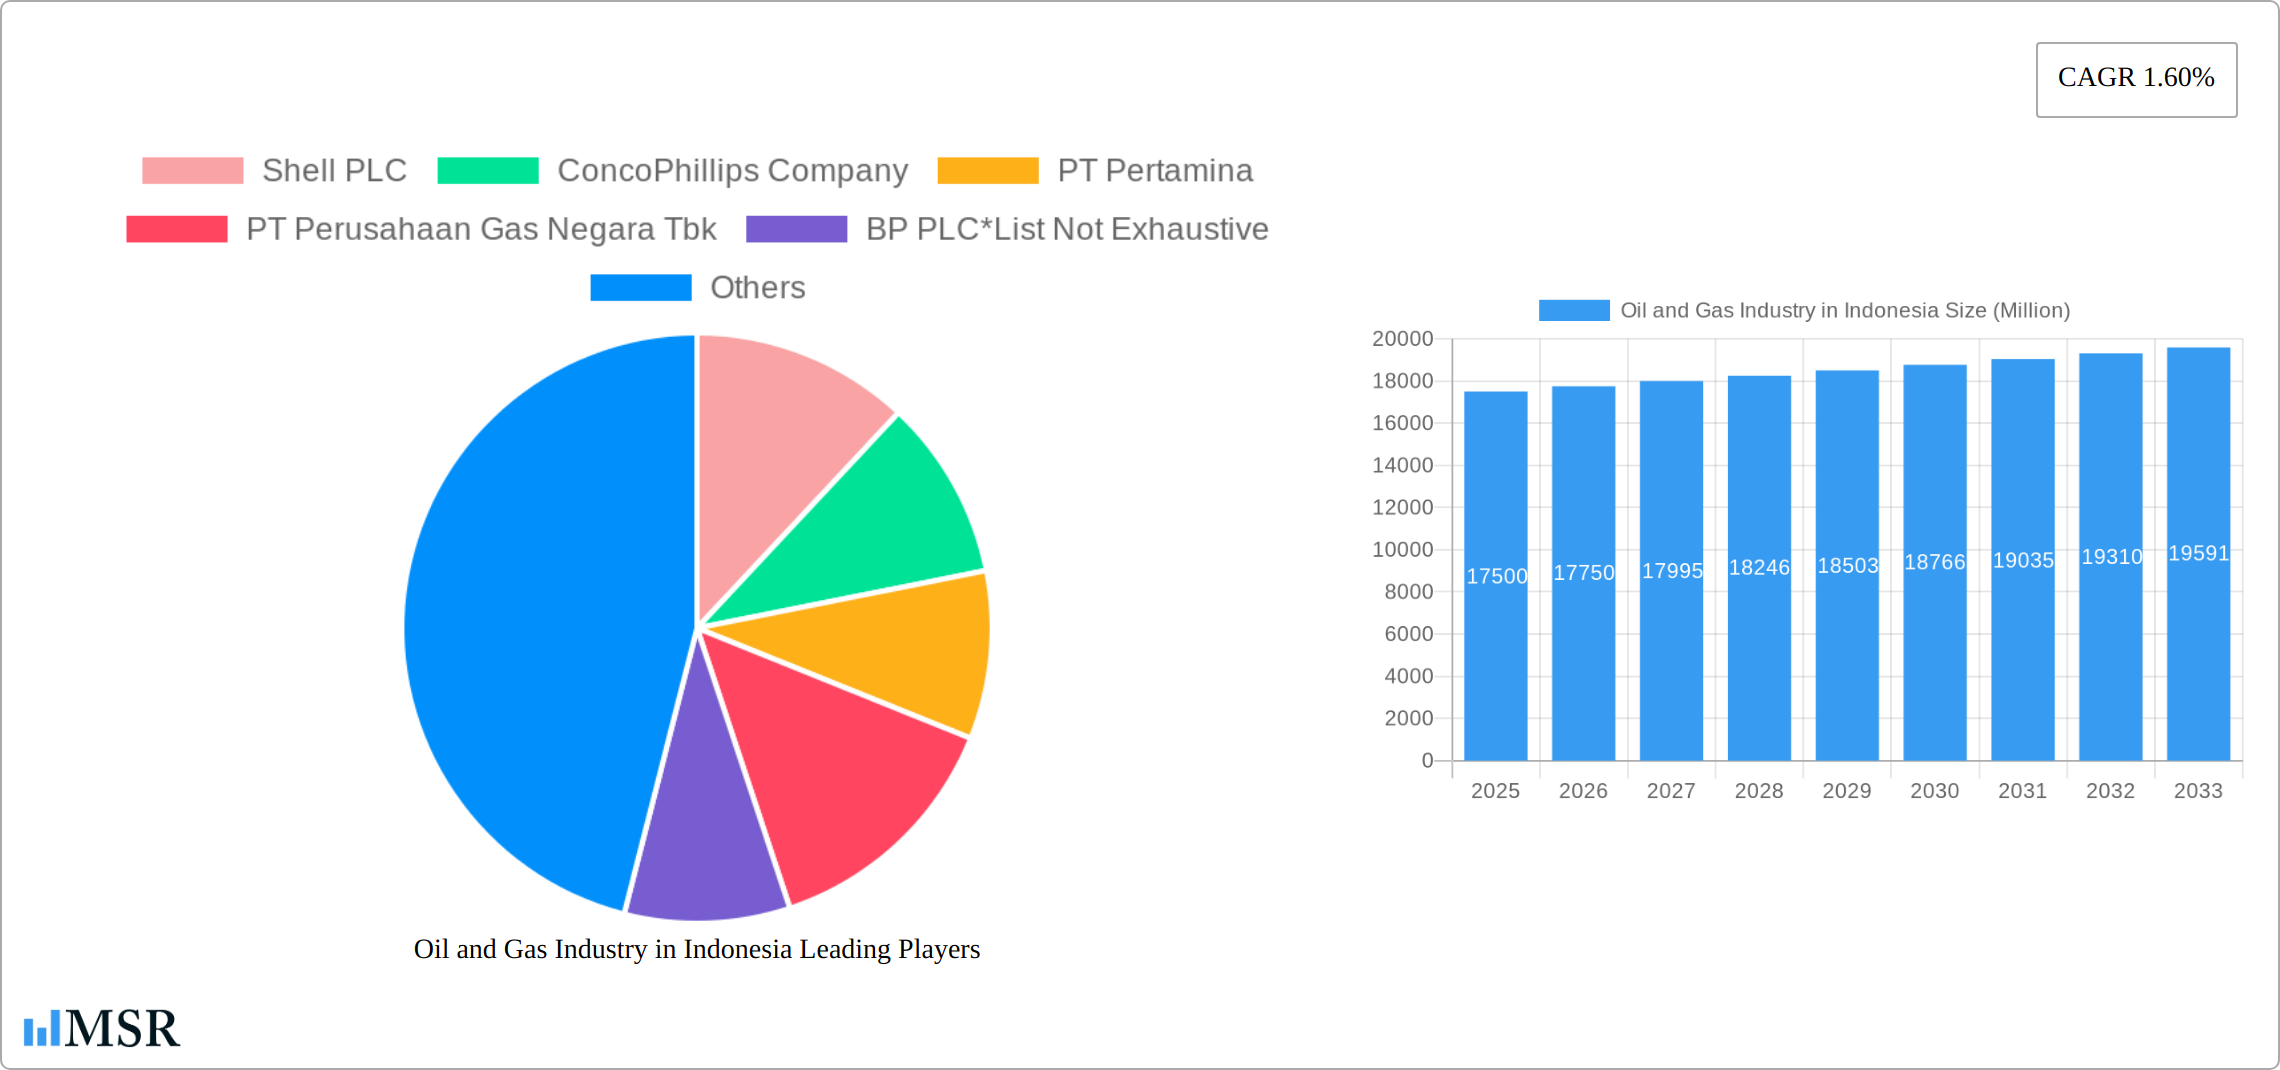
The Indonesian oil and gas market, valued at $17,500 million in 2025, presents a compelling investment landscape despite a moderate Compound Annual Growth Rate (CAGR) of 1.60%. This relatively low growth rate is likely influenced by several factors. Firstly, Indonesia's increasing focus on renewable energy sources, driven by environmental concerns and government initiatives, could be tempering growth in traditional fossil fuels. Secondly, fluctuating global oil prices and geopolitical instability create market uncertainty. However, robust domestic demand, particularly from the power generation and transportation sectors, continues to support market stability. Strong growth in industrial and residential energy consumption is also expected to contribute to future market expansion. Significant regional variations exist, with Sumatra, Java, and Kalimantan likely leading in market share due to established infrastructure and proximity to key production areas. Major players such as Pertamina, Perusahaan Gas Negara, Shell, and Chevron exert considerable influence, shaping market dynamics through their exploration, production, and distribution activities. The continued dominance of these established companies suggests potential barriers to entry for new players. Growth within the market will likely be driven by ongoing exploration activities, particularly in under-explored areas of Papua and East Indonesia.
The forecast period (2025-2033) anticipates a steady, albeit moderate, expansion of the Indonesian oil and gas market. Continued investment in infrastructure, particularly pipelines and refining capabilities, will be crucial to supporting this growth. Government regulations and policies related to environmental protection and energy diversification will likely shape future market trajectories. The segmentation of the market into crude oil, natural gas, and refined products, along with applications across power, transportation, industry, and residential use, offers diverse investment opportunities. Strategic partnerships and technological advancements within exploration and production techniques will be key factors determining the success of market participants in the coming years. Careful monitoring of global energy trends and Indonesian government policies remains vital for navigating this dynamic market.
Indonesia's Oil and Gas Industry: A Comprehensive Market Report (2019-2033)
This in-depth report provides a comprehensive analysis of Indonesia's dynamic oil and gas sector, covering market dynamics, key players, emerging trends, and future growth prospects. The study period spans from 2019 to 2033, with a base year of 2025 and a forecast period from 2025 to 2033. This report is essential for industry stakeholders, investors, and policymakers seeking to understand and capitalize on opportunities within this vital sector. The report leverages extensive market research and incorporates insights into recent significant developments, providing actionable intelligence to navigate the complexities of the Indonesian oil and gas market. The report's findings are supported by data and analysis, ensuring a precise and well-informed outlook for the future of Indonesia's energy sector. The estimated market size in 2025 is xx Million USD.
Oil and Gas Industry in Indonesia Market Concentration & Dynamics
This section analyzes the competitive landscape of Indonesia's oil and gas industry, examining market concentration, innovation, regulations, and market forces influencing its evolution. The Indonesian oil and gas market exhibits a moderate level of concentration, with a few dominant players and a number of smaller, more specialized companies.
Market Share: PT Pertamina holds the largest market share, followed by Shell PLC, Chevron Corporation, and ExxonMobil Corporation. Precise market share figures for 2025 are difficult to obtain without access to proprietary data; an estimated distribution would be Pertamina (40%), Shell (15%), Chevron (10%), ExxonMobil (10%), and others (25%). These figures are estimated and may vary depending on the specific segment and year.
M&A Activity: The historical period (2019-2024) witnessed xx M&A deals, reflecting a relatively active market characterized by consolidation and expansion strategies. The forecast period (2025-2033) is predicted to see an increase in M&A activity, driven by the need to optimize operations, secure new resources, and enhance technological capabilities.
Innovation Ecosystems: Indonesia is fostering an increasingly robust innovation ecosystem, with several research institutions and technology companies developing solutions for the upstream, midstream, and downstream segments. Regulatory frameworks, however, may present challenges to rapid technological adoption.
Regulatory Frameworks: The Indonesian government plays a significant role in shaping the industry through licensing, environmental regulations, and pricing policies. Recent reforms aim to attract foreign investment and enhance transparency, but regulatory uncertainty remains a concern.
Substitute Products: The growth of renewable energy sources, particularly solar and geothermal, poses a long-term challenge to the dominance of oil and gas. However, Indonesia's vast natural gas reserves ensure its role in power generation for the foreseeable future.
End-User Trends: Increased industrialization and population growth are driving demand for energy, although energy efficiency initiatives and government policies promoting renewables are beginning to moderate growth in certain segments.
Oil and Gas Industry in Indonesia Industry Insights & Trends
Indonesia's oil and gas industry is characterized by a complex interplay of factors influencing its growth trajectory. The market demonstrates considerable potential for growth, underpinned by ongoing infrastructure developments, energy security strategies, and the global demand for energy.
The industry's growth is propelled by several key factors: robust economic growth, expanding industrial activity, and government investments in infrastructure. However, challenges exist in the form of declining production from mature fields and the need to attract foreign investment to support exploration and production in less-developed areas. Technological advancements in exploration, extraction, and processing are crucial to enhancing efficiency and mitigating environmental impact. Furthermore, changes in global energy markets, particularly shifts in demand and pricing, exert a significant influence on the industry's performance. The market size in 2024 is estimated to be xx Million USD, with a Compound Annual Growth Rate (CAGR) of xx% projected from 2025 to 2033. This positive growth outlook is contingent upon continued government support, attracting foreign investment, and overcoming production challenges. Evolving consumer behaviors, particularly heightened environmental awareness, are also starting to shape the industry’s long-term sustainability prospects, prompting an increased focus on environmental, social, and governance (ESG) factors.

Key Markets & Segments Leading Oil and Gas Industry in Indonesia
Indonesia's oil and gas sector encompasses diverse geographical regions and product applications. The dominance of specific segments is influenced by a variety of factors, including resource availability, infrastructure development, and economic activity.
Dominant Segments:
Regional Segmentation: Java remains the most dominant region due to its high population density and extensive industrial activities. Kalimantan and Sumatra also play significant roles due to their considerable reserves and ongoing exploration efforts.
Product Segmentation: Natural gas currently holds a dominant position due to its extensive use in power generation and industrial processes. Crude oil production is essential, though its relative contribution to overall industry revenue has fluctuated in recent years. Refined products (gasoline and diesel) are also key contributors, driven by transportation sector needs.
Growth Drivers:
Economic Growth: Continued economic expansion fuels energy demand across all sectors.
Infrastructure Development: Investments in pipelines, refineries, and transportation networks are enhancing the efficiency and capacity of the sector.
Government Policies: Favorable regulatory frameworks attract foreign investment and incentivize exploration.
Industrialization: The growth of manufacturing and industrial activities significantly increases energy consumption.
Population Growth: Indonesia's growing population creates higher demand for energy in residential and commercial sectors.
Oil and Gas Industry in Indonesia Product Developments
Recent product developments focus on improving extraction techniques, enhancing efficiency, and reducing environmental impact. This includes advancements in exploration technology, such as advanced seismic imaging and data analytics, to identify new reserves more accurately. There's also a focus on developing cleaner energy sources, with increased investment in natural gas infrastructure and exploration, alongside efforts to capture and utilize associated gas (CAG). These innovations are critical in enhancing Indonesia's competitive standing and contributing to sustainable energy production.
Challenges in the Oil and Gas Industry in Indonesia Market
The Indonesian oil and gas industry faces several challenges, including aging infrastructure, declining production from mature fields, and environmental concerns. Regulatory complexities and bureaucratic hurdles can hinder investment and operational efficiency. Supply chain disruptions, especially regarding specialized equipment and skilled labor, occasionally impact operational reliability. Competition from renewable energy sources is also becoming increasingly prominent, requiring companies to adapt their strategies. These factors combine to create substantial headwinds and uncertainty for companies within the sector.
Forces Driving Oil and Gas Industry in Indonesia Growth
Despite challenges, several factors drive the long-term growth of Indonesia's oil and gas industry. Significant natural gas reserves provide a robust foundation for future energy security. Government initiatives aimed at improving infrastructure, attracting foreign investment, and simplifying regulatory processes contribute to a more favorable environment. Technological advancements, such as enhanced oil recovery (EOR) methods and improved efficiency in processing, help companies maximize resource utilization and profitability. Continued economic growth and population increase consistently underpin the demand for energy in Indonesia, fueling further industry growth.
Long-Term Growth Catalysts in the Oil and Gas Industry in Indonesia Market
Long-term growth in the Indonesian oil and gas sector hinges on strategic investments, technological innovation, and international collaborations. Enhanced partnerships with international companies, especially those specializing in cutting-edge technologies like EOR and carbon capture, are crucial to boosting production. Investments in modernizing infrastructure, including pipelines and processing facilities, enhance operational efficiency and export capacity. Furthermore, the exploration of new, untapped reserves, coupled with a focus on environmental sustainability, are pivotal to achieving long-term growth objectives. Sustained governmental support through policies that encourage foreign investment and improve the regulatory environment remains vital.
Emerging Opportunities in Oil and Gas Industry in Indonesia
Several emerging opportunities exist for growth and innovation within the Indonesian oil and gas sector. The increasing demand for liquefied natural gas (LNG) presents lucrative opportunities for export-oriented projects. Investment in renewable energy technologies, particularly those that integrate with existing infrastructure, offers a pathway to sustainability. Expanding into new geographical areas with less-explored reserves, while prioritizing environmental safeguards, presents a path for continued growth. Developing and deploying advanced technologies, such as carbon capture, utilization, and storage (CCUS), are becoming increasingly vital for a sustainable future.
Leading Players in the Oil and Gas Industry in Indonesia Sector
- Shell PLC
- ConocoPhillips Company
- PT Pertamina
- PT Perusahaan Gas Negara Tbk
- BP PLC
- Chevron Corporation
- Petroliam Nasional Berhad
- PT Connusa Energindo
- ExxonMobil Corporation
- China National Offshore Oil Corporation
Key Milestones in Oil and Gas Industry in Indonesia Industry
June 2023: Sembcorp Industries signed a USD 1.41 billion gas sales agreement with Medco Energi International, marking a significant milestone in cross-border energy trade and highlighting the importance of Indonesia's natural gas resources in regional energy security.
November 2022: Medco Energy Internasional Tbk secured a five-year gas supply agreement with Singapore, demonstrating Indonesia's continued role as a key gas supplier in the Southeast Asian region. This agreement underscores the long-term viability of Indonesia's gas sector and its importance in regional energy markets.
Strategic Outlook for Oil and Gas Industry in Indonesia Market
Indonesia's oil and gas industry possesses significant long-term potential, driven by substantial natural gas reserves and a growing domestic energy demand. Strategic investments in infrastructure modernization and technological advancements will be crucial for enhancing efficiency and competitiveness. Fostering partnerships with international players to leverage technological expertise and capital will be paramount for unlocking the full potential of Indonesia's energy resources. A continued focus on environmental sustainability and the exploration of cleaner energy options will help ensure the long-term viability of the sector.
Oil and Gas Industry in Indonesia Segmentation
- 1. Upstream
- 2. Midstream
- 3. Downstream
Oil and Gas Industry in Indonesia Segmentation By Geography
-
1. North America
- 1.1. United States
- 1.2. Canada
- 1.3. Mexico
-
2. South America
- 2.1. Brazil
- 2.2. Argentina
- 2.3. Rest of South America
-
3. Europe
- 3.1. United Kingdom
- 3.2. Germany
- 3.3. France
- 3.4. Italy
- 3.5. Spain
- 3.6. Russia
- 3.7. Benelux
- 3.8. Nordics
- 3.9. Rest of Europe
-
4. Middle East & Africa
- 4.1. Turkey
- 4.2. Israel
- 4.3. GCC
- 4.4. North Africa
- 4.5. South Africa
- 4.6. Rest of Middle East & Africa
-
5. Asia Pacific
- 5.1. China
- 5.2. India
- 5.3. Japan
- 5.4. South Korea
- 5.5. ASEAN
- 5.6. Oceania
- 5.7. Rest of Asia Pacific

Oil and Gas Industry in Indonesia REPORT HIGHLIGHTS
| Aspects | Details |
|---|---|
| Study Period | 2019-2033 |
| Base Year | 2024 |
| Estimated Year | 2025 |
| Forecast Period | 2025-2033 |
| Historical Period | 2019-2024 |
| Growth Rate | CAGR of 1.60% from 2019-2033 |
| Segmentation |
|
Table of Contents
- 1. Introduction
- 1.1. Research Scope
- 1.2. Market Segmentation
- 1.3. Research Methodology
- 1.4. Definitions and Assumptions
- 2. Executive Summary
- 2.1. Introduction
- 3. Market Dynamics
- 3.1. Introduction
- 3.2. Market Drivers
- 3.2.1. 4.; Increasing Demand for Petroleum Products Due to the Growth of the Local Economy4.; Government Initiatives to Boost the Production of Crude Oil and Natural Gas
- 3.3. Market Restrains
- 3.3.1. 4.; Increasing Adoption of Renewable Energy
- 3.4. Market Trends
- 3.4.1. Upstream Sector Expected to Witness Significant Growth
- 4. Market Factor Analysis
- 4.1. Porters Five Forces
- 4.2. Supply/Value Chain
- 4.3. PESTEL analysis
- 4.4. Market Entropy
- 4.5. Patent/Trademark Analysis
- 5. Global Oil and Gas Industry in Indonesia Analysis, Insights and Forecast, 2019-2031
- 5.1. Market Analysis, Insights and Forecast - by Upstream
- 5.2. Market Analysis, Insights and Forecast - by Midstream
- 5.3. Market Analysis, Insights and Forecast - by Downstream
- 5.4. Market Analysis, Insights and Forecast - by Region
- 5.4.1. North America
- 5.4.2. South America
- 5.4.3. Europe
- 5.4.4. Middle East & Africa
- 5.4.5. Asia Pacific
- 5.1. Market Analysis, Insights and Forecast - by Upstream
- 6. North America Oil and Gas Industry in Indonesia Analysis, Insights and Forecast, 2019-2031
- 6.1. Market Analysis, Insights and Forecast - by Upstream
- 6.2. Market Analysis, Insights and Forecast - by Midstream
- 6.3. Market Analysis, Insights and Forecast - by Downstream
- 6.1. Market Analysis, Insights and Forecast - by Upstream
- 7. South America Oil and Gas Industry in Indonesia Analysis, Insights and Forecast, 2019-2031
- 7.1. Market Analysis, Insights and Forecast - by Upstream
- 7.2. Market Analysis, Insights and Forecast - by Midstream
- 7.3. Market Analysis, Insights and Forecast - by Downstream
- 7.1. Market Analysis, Insights and Forecast - by Upstream
- 8. Europe Oil and Gas Industry in Indonesia Analysis, Insights and Forecast, 2019-2031
- 8.1. Market Analysis, Insights and Forecast - by Upstream
- 8.2. Market Analysis, Insights and Forecast - by Midstream
- 8.3. Market Analysis, Insights and Forecast - by Downstream
- 8.1. Market Analysis, Insights and Forecast - by Upstream
- 9. Middle East & Africa Oil and Gas Industry in Indonesia Analysis, Insights and Forecast, 2019-2031
- 9.1. Market Analysis, Insights and Forecast - by Upstream
- 9.2. Market Analysis, Insights and Forecast - by Midstream
- 9.3. Market Analysis, Insights and Forecast - by Downstream
- 9.1. Market Analysis, Insights and Forecast - by Upstream
- 10. Asia Pacific Oil and Gas Industry in Indonesia Analysis, Insights and Forecast, 2019-2031
- 10.1. Market Analysis, Insights and Forecast - by Upstream
- 10.2. Market Analysis, Insights and Forecast - by Midstream
- 10.3. Market Analysis, Insights and Forecast - by Downstream
- 10.1. Market Analysis, Insights and Forecast - by Upstream
- 11. Competitive Analysis
- 11.1. Global Market Share Analysis 2024
- 11.2. Company Profiles
- 11.2.1 Shell PLC
- 11.2.1.1. Overview
- 11.2.1.2. Products
- 11.2.1.3. SWOT Analysis
- 11.2.1.4. Recent Developments
- 11.2.1.5. Financials (Based on Availability)
- 11.2.2 ConcoPhillips Company
- 11.2.2.1. Overview
- 11.2.2.2. Products
- 11.2.2.3. SWOT Analysis
- 11.2.2.4. Recent Developments
- 11.2.2.5. Financials (Based on Availability)
- 11.2.3 PT Pertamina
- 11.2.3.1. Overview
- 11.2.3.2. Products
- 11.2.3.3. SWOT Analysis
- 11.2.3.4. Recent Developments
- 11.2.3.5. Financials (Based on Availability)
- 11.2.4 PT Perusahaan Gas Negara Tbk
- 11.2.4.1. Overview
- 11.2.4.2. Products
- 11.2.4.3. SWOT Analysis
- 11.2.4.4. Recent Developments
- 11.2.4.5. Financials (Based on Availability)
- 11.2.5 BP PLC*List Not Exhaustive
- 11.2.5.1. Overview
- 11.2.5.2. Products
- 11.2.5.3. SWOT Analysis
- 11.2.5.4. Recent Developments
- 11.2.5.5. Financials (Based on Availability)
- 11.2.6 Chevron Corporation
- 11.2.6.1. Overview
- 11.2.6.2. Products
- 11.2.6.3. SWOT Analysis
- 11.2.6.4. Recent Developments
- 11.2.6.5. Financials (Based on Availability)
- 11.2.7 Petroliam Nasional Berhad
- 11.2.7.1. Overview
- 11.2.7.2. Products
- 11.2.7.3. SWOT Analysis
- 11.2.7.4. Recent Developments
- 11.2.7.5. Financials (Based on Availability)
- 11.2.8 PT Connusa Energindo
- 11.2.8.1. Overview
- 11.2.8.2. Products
- 11.2.8.3. SWOT Analysis
- 11.2.8.4. Recent Developments
- 11.2.8.5. Financials (Based on Availability)
- 11.2.9 ExxonMobil Corporatoin
- 11.2.9.1. Overview
- 11.2.9.2. Products
- 11.2.9.3. SWOT Analysis
- 11.2.9.4. Recent Developments
- 11.2.9.5. Financials (Based on Availability)
- 11.2.10 China National Offshore Oil Corporation
- 11.2.10.1. Overview
- 11.2.10.2. Products
- 11.2.10.3. SWOT Analysis
- 11.2.10.4. Recent Developments
- 11.2.10.5. Financials (Based on Availability)
- 11.2.1 Shell PLC
List of Figures
- Figure 1: Global Oil and Gas Industry in Indonesia Revenue Breakdown (Million, %) by Region 2024 & 2032
- Figure 2: Global Oil and Gas Industry in Indonesia Volume Breakdown (Thousand, %) by Region 2024 & 2032
- Figure 3: Indonesia Oil and Gas Industry in Indonesia Revenue (Million), by Country 2024 & 2032
- Figure 4: Indonesia Oil and Gas Industry in Indonesia Volume (Thousand), by Country 2024 & 2032
- Figure 5: Indonesia Oil and Gas Industry in Indonesia Revenue Share (%), by Country 2024 & 2032
- Figure 6: Indonesia Oil and Gas Industry in Indonesia Volume Share (%), by Country 2024 & 2032
- Figure 7: North America Oil and Gas Industry in Indonesia Revenue (Million), by Upstream 2024 & 2032
- Figure 8: North America Oil and Gas Industry in Indonesia Volume (Thousand), by Upstream 2024 & 2032
- Figure 9: North America Oil and Gas Industry in Indonesia Revenue Share (%), by Upstream 2024 & 2032
- Figure 10: North America Oil and Gas Industry in Indonesia Volume Share (%), by Upstream 2024 & 2032
- Figure 11: North America Oil and Gas Industry in Indonesia Revenue (Million), by Midstream 2024 & 2032
- Figure 12: North America Oil and Gas Industry in Indonesia Volume (Thousand), by Midstream 2024 & 2032
- Figure 13: North America Oil and Gas Industry in Indonesia Revenue Share (%), by Midstream 2024 & 2032
- Figure 14: North America Oil and Gas Industry in Indonesia Volume Share (%), by Midstream 2024 & 2032
- Figure 15: North America Oil and Gas Industry in Indonesia Revenue (Million), by Downstream 2024 & 2032
- Figure 16: North America Oil and Gas Industry in Indonesia Volume (Thousand), by Downstream 2024 & 2032
- Figure 17: North America Oil and Gas Industry in Indonesia Revenue Share (%), by Downstream 2024 & 2032
- Figure 18: North America Oil and Gas Industry in Indonesia Volume Share (%), by Downstream 2024 & 2032
- Figure 19: North America Oil and Gas Industry in Indonesia Revenue (Million), by Country 2024 & 2032
- Figure 20: North America Oil and Gas Industry in Indonesia Volume (Thousand), by Country 2024 & 2032
- Figure 21: North America Oil and Gas Industry in Indonesia Revenue Share (%), by Country 2024 & 2032
- Figure 22: North America Oil and Gas Industry in Indonesia Volume Share (%), by Country 2024 & 2032
- Figure 23: South America Oil and Gas Industry in Indonesia Revenue (Million), by Upstream 2024 & 2032
- Figure 24: South America Oil and Gas Industry in Indonesia Volume (Thousand), by Upstream 2024 & 2032
- Figure 25: South America Oil and Gas Industry in Indonesia Revenue Share (%), by Upstream 2024 & 2032
- Figure 26: South America Oil and Gas Industry in Indonesia Volume Share (%), by Upstream 2024 & 2032
- Figure 27: South America Oil and Gas Industry in Indonesia Revenue (Million), by Midstream 2024 & 2032
- Figure 28: South America Oil and Gas Industry in Indonesia Volume (Thousand), by Midstream 2024 & 2032
- Figure 29: South America Oil and Gas Industry in Indonesia Revenue Share (%), by Midstream 2024 & 2032
- Figure 30: South America Oil and Gas Industry in Indonesia Volume Share (%), by Midstream 2024 & 2032
- Figure 31: South America Oil and Gas Industry in Indonesia Revenue (Million), by Downstream 2024 & 2032
- Figure 32: South America Oil and Gas Industry in Indonesia Volume (Thousand), by Downstream 2024 & 2032
- Figure 33: South America Oil and Gas Industry in Indonesia Revenue Share (%), by Downstream 2024 & 2032
- Figure 34: South America Oil and Gas Industry in Indonesia Volume Share (%), by Downstream 2024 & 2032
- Figure 35: South America Oil and Gas Industry in Indonesia Revenue (Million), by Country 2024 & 2032
- Figure 36: South America Oil and Gas Industry in Indonesia Volume (Thousand), by Country 2024 & 2032
- Figure 37: South America Oil and Gas Industry in Indonesia Revenue Share (%), by Country 2024 & 2032
- Figure 38: South America Oil and Gas Industry in Indonesia Volume Share (%), by Country 2024 & 2032
- Figure 39: Europe Oil and Gas Industry in Indonesia Revenue (Million), by Upstream 2024 & 2032
- Figure 40: Europe Oil and Gas Industry in Indonesia Volume (Thousand), by Upstream 2024 & 2032
- Figure 41: Europe Oil and Gas Industry in Indonesia Revenue Share (%), by Upstream 2024 & 2032
- Figure 42: Europe Oil and Gas Industry in Indonesia Volume Share (%), by Upstream 2024 & 2032
- Figure 43: Europe Oil and Gas Industry in Indonesia Revenue (Million), by Midstream 2024 & 2032
- Figure 44: Europe Oil and Gas Industry in Indonesia Volume (Thousand), by Midstream 2024 & 2032
- Figure 45: Europe Oil and Gas Industry in Indonesia Revenue Share (%), by Midstream 2024 & 2032
- Figure 46: Europe Oil and Gas Industry in Indonesia Volume Share (%), by Midstream 2024 & 2032
- Figure 47: Europe Oil and Gas Industry in Indonesia Revenue (Million), by Downstream 2024 & 2032
- Figure 48: Europe Oil and Gas Industry in Indonesia Volume (Thousand), by Downstream 2024 & 2032
- Figure 49: Europe Oil and Gas Industry in Indonesia Revenue Share (%), by Downstream 2024 & 2032
- Figure 50: Europe Oil and Gas Industry in Indonesia Volume Share (%), by Downstream 2024 & 2032
- Figure 51: Europe Oil and Gas Industry in Indonesia Revenue (Million), by Country 2024 & 2032
- Figure 52: Europe Oil and Gas Industry in Indonesia Volume (Thousand), by Country 2024 & 2032
- Figure 53: Europe Oil and Gas Industry in Indonesia Revenue Share (%), by Country 2024 & 2032
- Figure 54: Europe Oil and Gas Industry in Indonesia Volume Share (%), by Country 2024 & 2032
- Figure 55: Middle East & Africa Oil and Gas Industry in Indonesia Revenue (Million), by Upstream 2024 & 2032
- Figure 56: Middle East & Africa Oil and Gas Industry in Indonesia Volume (Thousand), by Upstream 2024 & 2032
- Figure 57: Middle East & Africa Oil and Gas Industry in Indonesia Revenue Share (%), by Upstream 2024 & 2032
- Figure 58: Middle East & Africa Oil and Gas Industry in Indonesia Volume Share (%), by Upstream 2024 & 2032
- Figure 59: Middle East & Africa Oil and Gas Industry in Indonesia Revenue (Million), by Midstream 2024 & 2032
- Figure 60: Middle East & Africa Oil and Gas Industry in Indonesia Volume (Thousand), by Midstream 2024 & 2032
- Figure 61: Middle East & Africa Oil and Gas Industry in Indonesia Revenue Share (%), by Midstream 2024 & 2032
- Figure 62: Middle East & Africa Oil and Gas Industry in Indonesia Volume Share (%), by Midstream 2024 & 2032
- Figure 63: Middle East & Africa Oil and Gas Industry in Indonesia Revenue (Million), by Downstream 2024 & 2032
- Figure 64: Middle East & Africa Oil and Gas Industry in Indonesia Volume (Thousand), by Downstream 2024 & 2032
- Figure 65: Middle East & Africa Oil and Gas Industry in Indonesia Revenue Share (%), by Downstream 2024 & 2032
- Figure 66: Middle East & Africa Oil and Gas Industry in Indonesia Volume Share (%), by Downstream 2024 & 2032
- Figure 67: Middle East & Africa Oil and Gas Industry in Indonesia Revenue (Million), by Country 2024 & 2032
- Figure 68: Middle East & Africa Oil and Gas Industry in Indonesia Volume (Thousand), by Country 2024 & 2032
- Figure 69: Middle East & Africa Oil and Gas Industry in Indonesia Revenue Share (%), by Country 2024 & 2032
- Figure 70: Middle East & Africa Oil and Gas Industry in Indonesia Volume Share (%), by Country 2024 & 2032
- Figure 71: Asia Pacific Oil and Gas Industry in Indonesia Revenue (Million), by Upstream 2024 & 2032
- Figure 72: Asia Pacific Oil and Gas Industry in Indonesia Volume (Thousand), by Upstream 2024 & 2032
- Figure 73: Asia Pacific Oil and Gas Industry in Indonesia Revenue Share (%), by Upstream 2024 & 2032
- Figure 74: Asia Pacific Oil and Gas Industry in Indonesia Volume Share (%), by Upstream 2024 & 2032
- Figure 75: Asia Pacific Oil and Gas Industry in Indonesia Revenue (Million), by Midstream 2024 & 2032
- Figure 76: Asia Pacific Oil and Gas Industry in Indonesia Volume (Thousand), by Midstream 2024 & 2032
- Figure 77: Asia Pacific Oil and Gas Industry in Indonesia Revenue Share (%), by Midstream 2024 & 2032
- Figure 78: Asia Pacific Oil and Gas Industry in Indonesia Volume Share (%), by Midstream 2024 & 2032
- Figure 79: Asia Pacific Oil and Gas Industry in Indonesia Revenue (Million), by Downstream 2024 & 2032
- Figure 80: Asia Pacific Oil and Gas Industry in Indonesia Volume (Thousand), by Downstream 2024 & 2032
- Figure 81: Asia Pacific Oil and Gas Industry in Indonesia Revenue Share (%), by Downstream 2024 & 2032
- Figure 82: Asia Pacific Oil and Gas Industry in Indonesia Volume Share (%), by Downstream 2024 & 2032
- Figure 83: Asia Pacific Oil and Gas Industry in Indonesia Revenue (Million), by Country 2024 & 2032
- Figure 84: Asia Pacific Oil and Gas Industry in Indonesia Volume (Thousand), by Country 2024 & 2032
- Figure 85: Asia Pacific Oil and Gas Industry in Indonesia Revenue Share (%), by Country 2024 & 2032
- Figure 86: Asia Pacific Oil and Gas Industry in Indonesia Volume Share (%), by Country 2024 & 2032
List of Tables
- Table 1: Global Oil and Gas Industry in Indonesia Revenue Million Forecast, by Region 2019 & 2032
- Table 2: Global Oil and Gas Industry in Indonesia Volume Thousand Forecast, by Region 2019 & 2032
- Table 3: Global Oil and Gas Industry in Indonesia Revenue Million Forecast, by Upstream 2019 & 2032
- Table 4: Global Oil and Gas Industry in Indonesia Volume Thousand Forecast, by Upstream 2019 & 2032
- Table 5: Global Oil and Gas Industry in Indonesia Revenue Million Forecast, by Midstream 2019 & 2032
- Table 6: Global Oil and Gas Industry in Indonesia Volume Thousand Forecast, by Midstream 2019 & 2032
- Table 7: Global Oil and Gas Industry in Indonesia Revenue Million Forecast, by Downstream 2019 & 2032
- Table 8: Global Oil and Gas Industry in Indonesia Volume Thousand Forecast, by Downstream 2019 & 2032
- Table 9: Global Oil and Gas Industry in Indonesia Revenue Million Forecast, by Region 2019 & 2032
- Table 10: Global Oil and Gas Industry in Indonesia Volume Thousand Forecast, by Region 2019 & 2032
- Table 11: Global Oil and Gas Industry in Indonesia Revenue Million Forecast, by Country 2019 & 2032
- Table 12: Global Oil and Gas Industry in Indonesia Volume Thousand Forecast, by Country 2019 & 2032
- Table 13: Global Oil and Gas Industry in Indonesia Revenue Million Forecast, by Upstream 2019 & 2032
- Table 14: Global Oil and Gas Industry in Indonesia Volume Thousand Forecast, by Upstream 2019 & 2032
- Table 15: Global Oil and Gas Industry in Indonesia Revenue Million Forecast, by Midstream 2019 & 2032
- Table 16: Global Oil and Gas Industry in Indonesia Volume Thousand Forecast, by Midstream 2019 & 2032
- Table 17: Global Oil and Gas Industry in Indonesia Revenue Million Forecast, by Downstream 2019 & 2032
- Table 18: Global Oil and Gas Industry in Indonesia Volume Thousand Forecast, by Downstream 2019 & 2032
- Table 19: Global Oil and Gas Industry in Indonesia Revenue Million Forecast, by Country 2019 & 2032
- Table 20: Global Oil and Gas Industry in Indonesia Volume Thousand Forecast, by Country 2019 & 2032
- Table 21: United States Oil and Gas Industry in Indonesia Revenue (Million) Forecast, by Application 2019 & 2032
- Table 22: United States Oil and Gas Industry in Indonesia Volume (Thousand) Forecast, by Application 2019 & 2032
- Table 23: Canada Oil and Gas Industry in Indonesia Revenue (Million) Forecast, by Application 2019 & 2032
- Table 24: Canada Oil and Gas Industry in Indonesia Volume (Thousand) Forecast, by Application 2019 & 2032
- Table 25: Mexico Oil and Gas Industry in Indonesia Revenue (Million) Forecast, by Application 2019 & 2032
- Table 26: Mexico Oil and Gas Industry in Indonesia Volume (Thousand) Forecast, by Application 2019 & 2032
- Table 27: Global Oil and Gas Industry in Indonesia Revenue Million Forecast, by Upstream 2019 & 2032
- Table 28: Global Oil and Gas Industry in Indonesia Volume Thousand Forecast, by Upstream 2019 & 2032
- Table 29: Global Oil and Gas Industry in Indonesia Revenue Million Forecast, by Midstream 2019 & 2032
- Table 30: Global Oil and Gas Industry in Indonesia Volume Thousand Forecast, by Midstream 2019 & 2032
- Table 31: Global Oil and Gas Industry in Indonesia Revenue Million Forecast, by Downstream 2019 & 2032
- Table 32: Global Oil and Gas Industry in Indonesia Volume Thousand Forecast, by Downstream 2019 & 2032
- Table 33: Global Oil and Gas Industry in Indonesia Revenue Million Forecast, by Country 2019 & 2032
- Table 34: Global Oil and Gas Industry in Indonesia Volume Thousand Forecast, by Country 2019 & 2032
- Table 35: Brazil Oil and Gas Industry in Indonesia Revenue (Million) Forecast, by Application 2019 & 2032
- Table 36: Brazil Oil and Gas Industry in Indonesia Volume (Thousand) Forecast, by Application 2019 & 2032
- Table 37: Argentina Oil and Gas Industry in Indonesia Revenue (Million) Forecast, by Application 2019 & 2032
- Table 38: Argentina Oil and Gas Industry in Indonesia Volume (Thousand) Forecast, by Application 2019 & 2032
- Table 39: Rest of South America Oil and Gas Industry in Indonesia Revenue (Million) Forecast, by Application 2019 & 2032
- Table 40: Rest of South America Oil and Gas Industry in Indonesia Volume (Thousand) Forecast, by Application 2019 & 2032
- Table 41: Global Oil and Gas Industry in Indonesia Revenue Million Forecast, by Upstream 2019 & 2032
- Table 42: Global Oil and Gas Industry in Indonesia Volume Thousand Forecast, by Upstream 2019 & 2032
- Table 43: Global Oil and Gas Industry in Indonesia Revenue Million Forecast, by Midstream 2019 & 2032
- Table 44: Global Oil and Gas Industry in Indonesia Volume Thousand Forecast, by Midstream 2019 & 2032
- Table 45: Global Oil and Gas Industry in Indonesia Revenue Million Forecast, by Downstream 2019 & 2032
- Table 46: Global Oil and Gas Industry in Indonesia Volume Thousand Forecast, by Downstream 2019 & 2032
- Table 47: Global Oil and Gas Industry in Indonesia Revenue Million Forecast, by Country 2019 & 2032
- Table 48: Global Oil and Gas Industry in Indonesia Volume Thousand Forecast, by Country 2019 & 2032
- Table 49: United Kingdom Oil and Gas Industry in Indonesia Revenue (Million) Forecast, by Application 2019 & 2032
- Table 50: United Kingdom Oil and Gas Industry in Indonesia Volume (Thousand) Forecast, by Application 2019 & 2032
- Table 51: Germany Oil and Gas Industry in Indonesia Revenue (Million) Forecast, by Application 2019 & 2032
- Table 52: Germany Oil and Gas Industry in Indonesia Volume (Thousand) Forecast, by Application 2019 & 2032
- Table 53: France Oil and Gas Industry in Indonesia Revenue (Million) Forecast, by Application 2019 & 2032
- Table 54: France Oil and Gas Industry in Indonesia Volume (Thousand) Forecast, by Application 2019 & 2032
- Table 55: Italy Oil and Gas Industry in Indonesia Revenue (Million) Forecast, by Application 2019 & 2032
- Table 56: Italy Oil and Gas Industry in Indonesia Volume (Thousand) Forecast, by Application 2019 & 2032
- Table 57: Spain Oil and Gas Industry in Indonesia Revenue (Million) Forecast, by Application 2019 & 2032
- Table 58: Spain Oil and Gas Industry in Indonesia Volume (Thousand) Forecast, by Application 2019 & 2032
- Table 59: Russia Oil and Gas Industry in Indonesia Revenue (Million) Forecast, by Application 2019 & 2032
- Table 60: Russia Oil and Gas Industry in Indonesia Volume (Thousand) Forecast, by Application 2019 & 2032
- Table 61: Benelux Oil and Gas Industry in Indonesia Revenue (Million) Forecast, by Application 2019 & 2032
- Table 62: Benelux Oil and Gas Industry in Indonesia Volume (Thousand) Forecast, by Application 2019 & 2032
- Table 63: Nordics Oil and Gas Industry in Indonesia Revenue (Million) Forecast, by Application 2019 & 2032
- Table 64: Nordics Oil and Gas Industry in Indonesia Volume (Thousand) Forecast, by Application 2019 & 2032
- Table 65: Rest of Europe Oil and Gas Industry in Indonesia Revenue (Million) Forecast, by Application 2019 & 2032
- Table 66: Rest of Europe Oil and Gas Industry in Indonesia Volume (Thousand) Forecast, by Application 2019 & 2032
- Table 67: Global Oil and Gas Industry in Indonesia Revenue Million Forecast, by Upstream 2019 & 2032
- Table 68: Global Oil and Gas Industry in Indonesia Volume Thousand Forecast, by Upstream 2019 & 2032
- Table 69: Global Oil and Gas Industry in Indonesia Revenue Million Forecast, by Midstream 2019 & 2032
- Table 70: Global Oil and Gas Industry in Indonesia Volume Thousand Forecast, by Midstream 2019 & 2032
- Table 71: Global Oil and Gas Industry in Indonesia Revenue Million Forecast, by Downstream 2019 & 2032
- Table 72: Global Oil and Gas Industry in Indonesia Volume Thousand Forecast, by Downstream 2019 & 2032
- Table 73: Global Oil and Gas Industry in Indonesia Revenue Million Forecast, by Country 2019 & 2032
- Table 74: Global Oil and Gas Industry in Indonesia Volume Thousand Forecast, by Country 2019 & 2032
- Table 75: Turkey Oil and Gas Industry in Indonesia Revenue (Million) Forecast, by Application 2019 & 2032
- Table 76: Turkey Oil and Gas Industry in Indonesia Volume (Thousand) Forecast, by Application 2019 & 2032
- Table 77: Israel Oil and Gas Industry in Indonesia Revenue (Million) Forecast, by Application 2019 & 2032
- Table 78: Israel Oil and Gas Industry in Indonesia Volume (Thousand) Forecast, by Application 2019 & 2032
- Table 79: GCC Oil and Gas Industry in Indonesia Revenue (Million) Forecast, by Application 2019 & 2032
- Table 80: GCC Oil and Gas Industry in Indonesia Volume (Thousand) Forecast, by Application 2019 & 2032
- Table 81: North Africa Oil and Gas Industry in Indonesia Revenue (Million) Forecast, by Application 2019 & 2032
- Table 82: North Africa Oil and Gas Industry in Indonesia Volume (Thousand) Forecast, by Application 2019 & 2032
- Table 83: South Africa Oil and Gas Industry in Indonesia Revenue (Million) Forecast, by Application 2019 & 2032
- Table 84: South Africa Oil and Gas Industry in Indonesia Volume (Thousand) Forecast, by Application 2019 & 2032
- Table 85: Rest of Middle East & Africa Oil and Gas Industry in Indonesia Revenue (Million) Forecast, by Application 2019 & 2032
- Table 86: Rest of Middle East & Africa Oil and Gas Industry in Indonesia Volume (Thousand) Forecast, by Application 2019 & 2032
- Table 87: Global Oil and Gas Industry in Indonesia Revenue Million Forecast, by Upstream 2019 & 2032
- Table 88: Global Oil and Gas Industry in Indonesia Volume Thousand Forecast, by Upstream 2019 & 2032
- Table 89: Global Oil and Gas Industry in Indonesia Revenue Million Forecast, by Midstream 2019 & 2032
- Table 90: Global Oil and Gas Industry in Indonesia Volume Thousand Forecast, by Midstream 2019 & 2032
- Table 91: Global Oil and Gas Industry in Indonesia Revenue Million Forecast, by Downstream 2019 & 2032
- Table 92: Global Oil and Gas Industry in Indonesia Volume Thousand Forecast, by Downstream 2019 & 2032
- Table 93: Global Oil and Gas Industry in Indonesia Revenue Million Forecast, by Country 2019 & 2032
- Table 94: Global Oil and Gas Industry in Indonesia Volume Thousand Forecast, by Country 2019 & 2032
- Table 95: China Oil and Gas Industry in Indonesia Revenue (Million) Forecast, by Application 2019 & 2032
- Table 96: China Oil and Gas Industry in Indonesia Volume (Thousand) Forecast, by Application 2019 & 2032
- Table 97: India Oil and Gas Industry in Indonesia Revenue (Million) Forecast, by Application 2019 & 2032
- Table 98: India Oil and Gas Industry in Indonesia Volume (Thousand) Forecast, by Application 2019 & 2032
- Table 99: Japan Oil and Gas Industry in Indonesia Revenue (Million) Forecast, by Application 2019 & 2032
- Table 100: Japan Oil and Gas Industry in Indonesia Volume (Thousand) Forecast, by Application 2019 & 2032
- Table 101: South Korea Oil and Gas Industry in Indonesia Revenue (Million) Forecast, by Application 2019 & 2032
- Table 102: South Korea Oil and Gas Industry in Indonesia Volume (Thousand) Forecast, by Application 2019 & 2032
- Table 103: ASEAN Oil and Gas Industry in Indonesia Revenue (Million) Forecast, by Application 2019 & 2032
- Table 104: ASEAN Oil and Gas Industry in Indonesia Volume (Thousand) Forecast, by Application 2019 & 2032
- Table 105: Oceania Oil and Gas Industry in Indonesia Revenue (Million) Forecast, by Application 2019 & 2032
- Table 106: Oceania Oil and Gas Industry in Indonesia Volume (Thousand) Forecast, by Application 2019 & 2032
- Table 107: Rest of Asia Pacific Oil and Gas Industry in Indonesia Revenue (Million) Forecast, by Application 2019 & 2032
- Table 108: Rest of Asia Pacific Oil and Gas Industry in Indonesia Volume (Thousand) Forecast, by Application 2019 & 2032
Frequently Asked Questions
1. What is the projected Compound Annual Growth Rate (CAGR) of the Oil and Gas Industry in Indonesia?
The projected CAGR is approximately 1.60%.
2. Which companies are prominent players in the Oil and Gas Industry in Indonesia?
Key companies in the market include Shell PLC, ConcoPhillips Company, PT Pertamina, PT Perusahaan Gas Negara Tbk, BP PLC*List Not Exhaustive, Chevron Corporation, Petroliam Nasional Berhad, PT Connusa Energindo, ExxonMobil Corporatoin, China National Offshore Oil Corporation.
3. What are the main segments of the Oil and Gas Industry in Indonesia?
The market segments include Upstream, Midstream, Downstream.
4. Can you provide details about the market size?
The market size is estimated to be USD 17500 Million as of 2022.
5. What are some drivers contributing to market growth?
4.; Increasing Demand for Petroleum Products Due to the Growth of the Local Economy4.; Government Initiatives to Boost the Production of Crude Oil and Natural Gas.
6. What are the notable trends driving market growth?
Upstream Sector Expected to Witness Significant Growth.
7. Are there any restraints impacting market growth?
4.; Increasing Adoption of Renewable Energy.
8. Can you provide examples of recent developments in the market?
June 2023: Sembcorp Industries signed a USD 1.41 billion gas sales agreement with Medco Energi International to import gas from an offshore play in Indonesia to Singapore. Gas will be obtained from the West Natuna gas field and dispatched to Singapore through the West Natuna-Singapore gas pipeline.
9. What pricing options are available for accessing the report?
Pricing options include single-user, multi-user, and enterprise licenses priced at USD 3800, USD 4500, and USD 5800 respectively.
10. Is the market size provided in terms of value or volume?
The market size is provided in terms of value, measured in Million and volume, measured in Thousand.
11. Are there any specific market keywords associated with the report?
Yes, the market keyword associated with the report is "Oil and Gas Industry in Indonesia," which aids in identifying and referencing the specific market segment covered.
12. How do I determine which pricing option suits my needs best?
The pricing options vary based on user requirements and access needs. Individual users may opt for single-user licenses, while businesses requiring broader access may choose multi-user or enterprise licenses for cost-effective access to the report.
13. Are there any additional resources or data provided in the Oil and Gas Industry in Indonesia report?
While the report offers comprehensive insights, it's advisable to review the specific contents or supplementary materials provided to ascertain if additional resources or data are available.
14. How can I stay updated on further developments or reports in the Oil and Gas Industry in Indonesia?
To stay informed about further developments, trends, and reports in the Oil and Gas Industry in Indonesia, consider subscribing to industry newsletters, following relevant companies and organizations, or regularly checking reputable industry news sources and publications.
Methodology
Step 1 - Identification of Relevant Samples Size from Population Database


Step 2 - Approaches for Defining Global Market Size (Value, Volume* & Price*)

Note*: In applicable scenarios
Step 3 - Data Sources
Primary Research
- Web Analytics
- Survey Reports
- Research Institute
- Latest Research Reports
- Opinion Leaders
Secondary Research
- Annual Reports
- White Paper
- Latest Press Release
- Industry Association
- Paid Database
- Investor Presentations

Step 4 - Data Triangulation
Involves using different sources of information in order to increase the validity of a study
These sources are likely to be stakeholders in a program - participants, other researchers, program staff, other community members, and so on.
Then we put all data in single framework & apply various statistical tools to find out the dynamic on the market.
During the analysis stage, feedback from the stakeholder groups would be compared to determine areas of agreement as well as areas of divergence
