

Key Insights
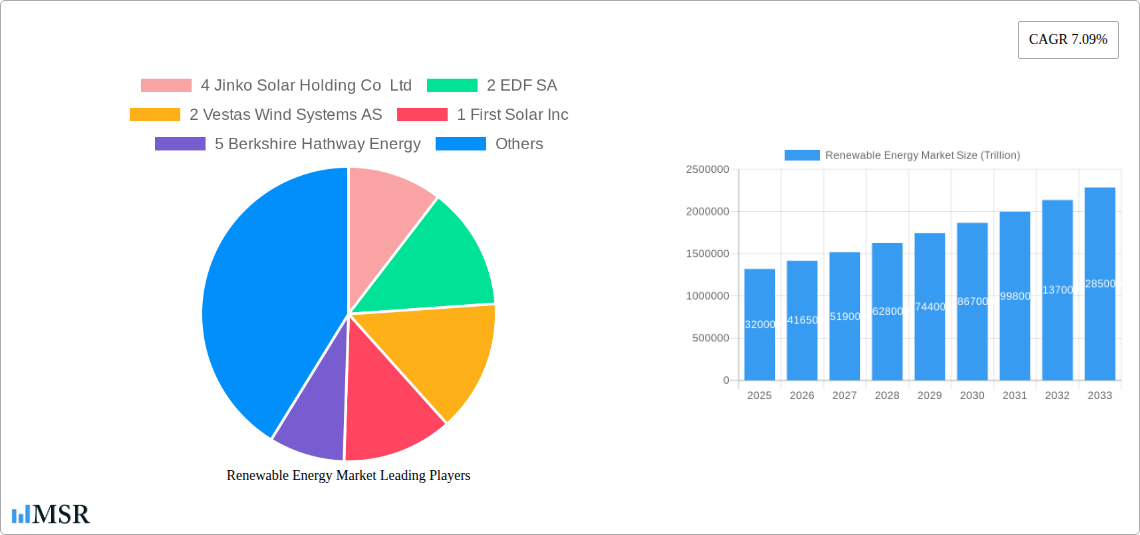
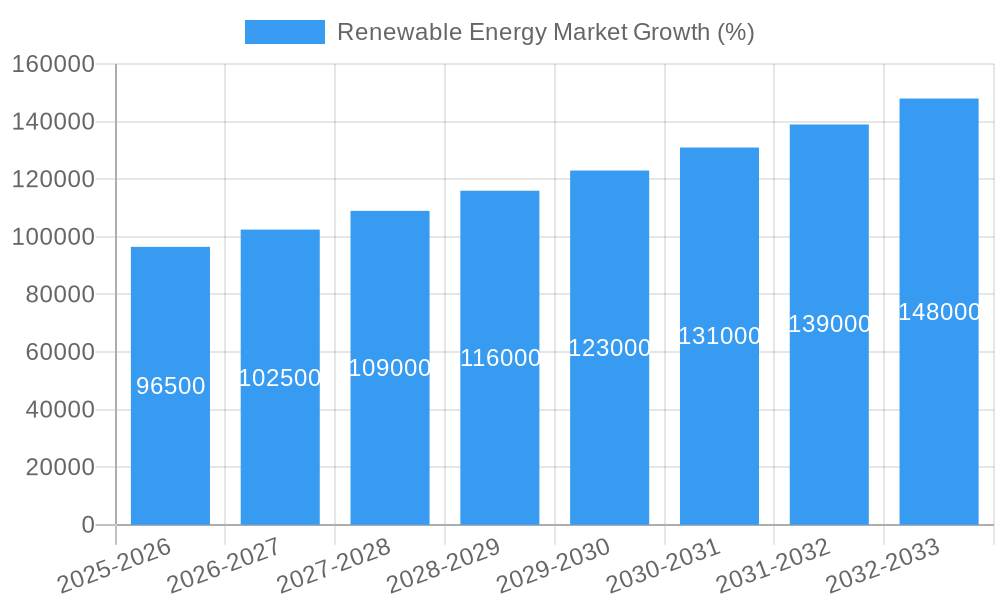
The global renewable energy market, valued at $1.32 trillion in 2025, is projected to experience robust growth, driven by increasing concerns about climate change, stringent government regulations promoting clean energy adoption, and declining costs of renewable energy technologies. The market's Compound Annual Growth Rate (CAGR) of 7.09% from 2025 to 2033 indicates a significant expansion, with substantial investments expected across various segments. Solar, wind, and hydro power are currently the dominant segments, but bioenergy and other emerging technologies like geothermal and tidal power are also gaining traction, spurred by technological advancements and supportive policies. Geographical expansion is a key driver, with North America, Europe, and Asia-Pacific representing major markets, followed by South America and the Middle East & Africa. Key players like JinkoSolar, EDF, Vestas, and First Solar are heavily invested in expanding capacity and improving technology, while EPC developers and equipment suppliers are playing crucial roles in project development and implementation. Continued governmental support through subsidies, tax incentives, and renewable portfolio standards will be crucial for sustaining this growth trajectory. The market faces challenges including grid integration complexities, land-use constraints, and intermittent energy supply issues. However, ongoing research and development in energy storage technologies are expected to mitigate these challenges and further accelerate the renewable energy market's growth.
The competitive landscape is marked by both established players and emerging companies. While large corporations like Berkshire Hathaway Energy, General Electric, and Siemens Gamesa enjoy economies of scale, smaller companies are innovating and specializing in niche areas within the renewable energy sector. The market's diverse segment composition suggests that growth opportunities are spread across various technological areas. The continued expansion of renewable energy is not only crucial for environmental sustainability but also offers significant economic opportunities, creating jobs and stimulating innovation across multiple industries. Regional variations in renewable resource availability and government policies will continue to shape market dynamics, with regions boasting abundant solar or wind resources experiencing more rapid expansion.
Renewable Energy Market: A Trillion-Dollar Opportunity - Comprehensive Market Report 2019-2033
This comprehensive report provides an in-depth analysis of the global renewable energy market, projecting a market value exceeding several trillion USD by 2033. The study covers the period from 2019 to 2033, with a focus on the 2025-2033 forecast period. Gain actionable insights into market dynamics, key players, emerging trends, and significant growth drivers within the solar, wind, hydro, bioenergy, and other renewable energy sectors. This report is essential for investors, industry stakeholders, and anyone seeking to understand and capitalize on the burgeoning renewable energy landscape.
Renewable Energy Market Concentration & Dynamics
The renewable energy market exhibits a dynamic interplay of consolidation and innovation. Market concentration is moderate, with several large players holding significant market share, while numerous smaller companies contribute to technological advancements and niche market segments. The market share analysis (2025) reveals a competitive landscape: Berkshire Hathaway Energy (5%), NextEra Energy Inc. (3%), Acciona Energia SA (6%), Duke Energy Corporation (4%), and others. M&A activity has been robust, with xx deals recorded in the last five years, driving consolidation and expanding market reach. Innovation ecosystems are thriving, driven by government incentives, private investments, and increasing consumer demand for sustainable energy solutions. Stringent regulatory frameworks, including carbon emission targets and renewable portfolio standards, are pivotal in shaping market growth. Substitute products, such as fossil fuels, face increasing competition due to decreasing renewable energy costs and growing environmental concerns. End-user trends are shifting toward decentralized energy generation, particularly with the increasing adoption of rooftop solar panels and community-based renewable projects.
- Market Concentration: Moderate, with top players holding xx% of the market share in 2025.
- M&A Activity: xx deals over the past five years, indicating market consolidation.
- Innovation Ecosystems: Strong, fuelled by investments and policy support.
- Regulatory Frameworks: Driving adoption through incentives and mandates.
- Substitute Products: Facing pressure from decreasing renewable energy costs.
- End-User Trends: Shifting towards decentralized generation and community projects.
Renewable Energy Market Industry Insights & Trends
The global renewable energy market is experiencing exponential growth, fueled by rising energy demand, environmental concerns, and technological advancements. The market size reached xx trillion USD in 2024 and is projected to reach xx trillion USD by 2033, exhibiting a CAGR of xx% during the forecast period (2025-2033). Several factors contribute to this growth. Government policies supporting renewable energy development through subsidies and tax incentives are crucial. Technological improvements, leading to lower costs for renewable energy technologies (e.g., solar panels and wind turbines), make renewable energy increasingly competitive with fossil fuels. The increasing awareness of climate change among consumers and businesses is driving demand for sustainable energy solutions. The shift towards decentralized generation, enabled by advances in energy storage technologies, is further accelerating market growth. Moreover, decreasing prices of raw materials and advances in manufacturing techniques further enhance the market expansion.
Key Markets & Segments Leading Renewable Energy Market
The renewable energy market demonstrates significant regional and segmental variations. China currently leads in overall renewable energy capacity, followed by the United States and Europe. However, growth is most rapid in emerging markets in Asia and Africa.
Dominant Segments:
- Solar: Solar power is the fastest-growing segment, driven by decreasing costs and technological improvements, leading to widespread residential and commercial adoption.
- Wind: Wind energy continues to be a major contributor, particularly in regions with favorable wind resources. Offshore wind energy shows significant potential for future growth.
Key Market Drivers:
- Economic Growth: Strong economic growth in many countries drives increased energy demand, fostering renewable energy adoption.
- Government Policies: Supportive policies, including renewable energy mandates, feed-in tariffs, and tax incentives, accelerate market expansion.
- Technological Advancements: Continuous improvement in technology drives down costs and improves efficiency.
- Environmental Concerns: Growing public awareness of climate change promotes the transition to cleaner energy sources.
Dominance Analysis: Solar and Wind remain the leading segments, driven by advancements in technology, falling costs, and supportive government policies, making them increasingly cost-competitive with fossil fuels. Hydropower remains significant in regions with suitable water resources, while bioenergy and other renewable sources are expanding their market share.
Renewable Energy Market Product Developments
Recent years have witnessed significant product innovation in renewable energy technologies. This includes the development of more efficient solar panels, larger and more powerful wind turbines, improved energy storage solutions, and advanced smart grid technologies to better integrate renewable energy sources into the electricity grid. These advancements are crucial in reducing the cost and enhancing the reliability of renewable energy systems, thus increasing their overall market competitiveness and acceptance. Furthermore, advancements in materials science lead to better and more durable components, resulting in longer lifespans and reduced maintenance costs.
Challenges in the Renewable Energy Market Market
The renewable energy market faces several challenges, including intermittency of renewable energy sources (requiring effective energy storage solutions), the high upfront capital costs involved in large-scale renewable energy projects, land-use constraints, and regulatory uncertainties in some regions. Supply chain disruptions can also impact the availability and cost of essential components. Furthermore, the integration of renewable energy into existing power grids poses significant technical challenges, requiring substantial grid modernization investments. These factors impact market growth rates, though technological advancements and supportive policies continue to mitigate these issues.
Forces Driving Renewable Energy Market Growth
Several factors are driving the expansion of the renewable energy market. These include: government regulations such as carbon emission reduction targets and renewable portfolio standards; decreasing costs of renewable energy technologies, making them increasingly competitive with fossil fuels; growing consumer awareness of environmental issues and the desire for sustainable energy sources; and technological advancements in energy storage technologies. For instance, the increasing capacity of battery storage systems reduces reliance on fossil fuel-based backup power. In addition, ongoing research and development into novel renewable energy technologies are promising significant long-term growth potential.
Challenges in the Renewable Energy Market Market
Long-term growth hinges on overcoming current challenges, including technological hurdles in energy storage, grid integration, and material supply chains. Public-private partnerships are crucial for developing next-generation technologies and deploying infrastructure efficiently. Expanding renewable energy to new markets, especially in developing countries, will depend on financing, technical expertise, and supportive government policies.
Emerging Opportunities in Renewable Energy Market
Emerging opportunities lie in the development of hybrid renewable energy systems, smart grids, advanced energy storage, and green hydrogen technologies. The increasing integration of artificial intelligence (AI) and machine learning (ML) in renewable energy systems optimizes energy production and grid management. Exploring niche applications of renewable energy (e.g., powering remote communities and transportation) presents significant market potential. Increased demand for sustainable energy solutions within businesses expands the corporate renewable energy sector.
Leading Players in the Renewable Energy Market Sector
- Jinko Solar Holding Co Ltd
- EDF SA
- Vestas Wind Systems AS
- First Solar Inc
- Berkshire Hathaway Energy
- Orsted AS
- Canadian Solar Inc
- Duke Energy Corporation
- Acciona Energia SA
- NextEra Energy Inc
- General Electric Company
- Siemens Gamesa Renewable Energy SA
Key Milestones in Renewable Energy Market Industry
- April 2023: ArcelorMittal Brazil and Casa dos Ventos formed a joint venture to develop the 554 MW Babilonia wind power project in Bahia, Brazil, showcasing significant investment in the wind energy sector.
- January 2023: Cepsa announced plans to build three new solar power projects (400 MW total) in Castilla-La Mancha, Spain, demonstrating continued growth in the solar energy sector in Europe.
- May 2022: NJR Clean Energy Ventures (CEV) commenced construction of an 8.9-MW floating solar installation in New Jersey, representing a notable advancement in floating solar technology and a significant expansion of US renewable energy capacity.
Strategic Outlook for Renewable Energy Market Market
The renewable energy market demonstrates tremendous growth potential over the next decade. Strategic opportunities exist in developing innovative technologies, expanding into new markets, and forming strategic partnerships to accelerate the global transition to clean energy. Further investments in research and development, grid modernization, and energy storage will be essential to unlock the full potential of renewable energy and meet global climate goals. The integration of AI and the Internet of Things (IoT) will further enhance the efficiency and reliability of renewable energy systems, opening new avenues for growth and innovation.
Renewable Energy Market Segmentation
-
1. Type
- 1.1. Solar
- 1.2. Wind
- 1.3. Hydro
- 1.4. Bioenergy
- 1.5. Other Types (Geothermal, Tidal, etc.)
Renewable Energy Market Segmentation By Geography
-
1. North America
- 1.1. United States of America
- 1.2. Canada
- 1.3. Rest of the North America
-
2. Europe
- 2.1. United Kingdom
- 2.2. Germany
- 2.3. France
- 2.4. Spain
- 2.5. NORDIC
- 2.6. Turkey
- 2.7. Russia
- 2.8. Rest of the Europe
-
3. Asia Pacific
- 3.1. China
- 3.2. India
- 3.3. Japan
- 3.4. Malaysia
- 3.5. Thailand
- 3.6. Indonesia
- 3.7. Vietnam
- 3.8. Rest of Asia Pacific
-
4. Middle East and Africa
- 4.1. United Arab Emirates
- 4.2. Saudi Arabia
- 4.3. Egypt
- 4.4. Nigeria
- 4.5. South Africa
- 4.6. Qatar
- 4.7. Rest of the Middle East and Africa
-
5. South America
- 5.1. Brazil
- 5.2. Argentina
- 5.3. Colombia
- 5.4. Rest of the South America

Renewable Energy Market REPORT HIGHLIGHTS
| Aspects | Details |
|---|---|
| Study Period | 2019-2033 |
| Base Year | 2024 |
| Estimated Year | 2025 |
| Forecast Period | 2025-2033 |
| Historical Period | 2019-2024 |
| Growth Rate | CAGR of 7.09% from 2019-2033 |
| Segmentation |
|
Table of Contents
- 1. Introduction
- 1.1. Research Scope
- 1.2. Market Segmentation
- 1.3. Research Methodology
- 1.4. Definitions and Assumptions
- 2. Executive Summary
- 2.1. Introduction
- 3. Market Dynamics
- 3.1. Introduction
- 3.2. Market Drivers
- 3.2.1. 4.; Favorable Government Policies for Renewable Energy4.; The Declining Price of Solar Panels and Wind Turbine Installations4.; Increasing Investments in Hydropower and Pumped Storage Hydropower Projects4.; Growing Emphasis on Geothermal Energy
- 3.3. Market Restrains
- 3.3.1. 4.; Increasing Penetration of Natural Gas for Power Generation
- 3.4. Market Trends
- 3.4.1. Hydropower Segment is Expected to Dominate the Market during the Forecast Period
- 4. Market Factor Analysis
- 4.1. Porters Five Forces
- 4.2. Supply/Value Chain
- 4.3. PESTEL analysis
- 4.4. Market Entropy
- 4.5. Patent/Trademark Analysis
- 5. Global Renewable Energy Market Analysis, Insights and Forecast, 2019-2031
- 5.1. Market Analysis, Insights and Forecast - by Type
- 5.1.1. Solar
- 5.1.2. Wind
- 5.1.3. Hydro
- 5.1.4. Bioenergy
- 5.1.5. Other Types (Geothermal, Tidal, etc.)
- 5.2. Market Analysis, Insights and Forecast - by Region
- 5.2.1. North America
- 5.2.2. Europe
- 5.2.3. Asia Pacific
- 5.2.4. Middle East and Africa
- 5.2.5. South America
- 5.1. Market Analysis, Insights and Forecast - by Type
- 6. North America Renewable Energy Market Analysis, Insights and Forecast, 2019-2031
- 6.1. Market Analysis, Insights and Forecast - by Type
- 6.1.1. Solar
- 6.1.2. Wind
- 6.1.3. Hydro
- 6.1.4. Bioenergy
- 6.1.5. Other Types (Geothermal, Tidal, etc.)
- 6.1. Market Analysis, Insights and Forecast - by Type
- 7. Europe Renewable Energy Market Analysis, Insights and Forecast, 2019-2031
- 7.1. Market Analysis, Insights and Forecast - by Type
- 7.1.1. Solar
- 7.1.2. Wind
- 7.1.3. Hydro
- 7.1.4. Bioenergy
- 7.1.5. Other Types (Geothermal, Tidal, etc.)
- 7.1. Market Analysis, Insights and Forecast - by Type
- 8. Asia Pacific Renewable Energy Market Analysis, Insights and Forecast, 2019-2031
- 8.1. Market Analysis, Insights and Forecast - by Type
- 8.1.1. Solar
- 8.1.2. Wind
- 8.1.3. Hydro
- 8.1.4. Bioenergy
- 8.1.5. Other Types (Geothermal, Tidal, etc.)
- 8.1. Market Analysis, Insights and Forecast - by Type
- 9. Middle East and Africa Renewable Energy Market Analysis, Insights and Forecast, 2019-2031
- 9.1. Market Analysis, Insights and Forecast - by Type
- 9.1.1. Solar
- 9.1.2. Wind
- 9.1.3. Hydro
- 9.1.4. Bioenergy
- 9.1.5. Other Types (Geothermal, Tidal, etc.)
- 9.1. Market Analysis, Insights and Forecast - by Type
- 10. South America Renewable Energy Market Analysis, Insights and Forecast, 2019-2031
- 10.1. Market Analysis, Insights and Forecast - by Type
- 10.1.1. Solar
- 10.1.2. Wind
- 10.1.3. Hydro
- 10.1.4. Bioenergy
- 10.1.5. Other Types (Geothermal, Tidal, etc.)
- 10.1. Market Analysis, Insights and Forecast - by Type
- 11. North America Renewable Energy Market Analysis, Insights and Forecast, 2019-2031
- 11.1. Market Analysis, Insights and Forecast - By Country/Sub-region
- 11.1.1 United States
- 11.1.2 Canada
- 11.1.3 Mexico
- 12. Europe Renewable Energy Market Analysis, Insights and Forecast, 2019-2031
- 12.1. Market Analysis, Insights and Forecast - By Country/Sub-region
- 12.1.1 Germany
- 12.1.2 United Kingdom
- 12.1.3 France
- 12.1.4 Spain
- 12.1.5 Italy
- 12.1.6 Spain
- 12.1.7 Belgium
- 12.1.8 Netherland
- 12.1.9 Nordics
- 12.1.10 Rest of Europe
- 13. Asia Pacific Renewable Energy Market Analysis, Insights and Forecast, 2019-2031
- 13.1. Market Analysis, Insights and Forecast - By Country/Sub-region
- 13.1.1 China
- 13.1.2 Japan
- 13.1.3 India
- 13.1.4 South Korea
- 13.1.5 Southeast Asia
- 13.1.6 Australia
- 13.1.7 Indonesia
- 13.1.8 Phillipes
- 13.1.9 Singapore
- 13.1.10 Thailandc
- 13.1.11 Rest of Asia Pacific
- 14. South America Renewable Energy Market Analysis, Insights and Forecast, 2019-2031
- 14.1. Market Analysis, Insights and Forecast - By Country/Sub-region
- 14.1.1 Brazil
- 14.1.2 Argentina
- 14.1.3 Peru
- 14.1.4 Chile
- 14.1.5 Colombia
- 14.1.6 Ecuador
- 14.1.7 Venezuela
- 14.1.8 Rest of South America
- 15. North America Renewable Energy Market Analysis, Insights and Forecast, 2019-2031
- 15.1. Market Analysis, Insights and Forecast - By Country/Sub-region
- 15.1.1 United States
- 15.1.2 Canada
- 15.1.3 Mexico
- 16. MEA Renewable Energy Market Analysis, Insights and Forecast, 2019-2031
- 16.1. Market Analysis, Insights and Forecast - By Country/Sub-region
- 16.1.1 United Arab Emirates
- 16.1.2 Saudi Arabia
- 16.1.3 South Africa
- 16.1.4 Rest of Middle East and Africa
- 17. Competitive Analysis
- 17.1. Global Market Share Analysis 2024
- 17.2. Company Profiles
- 17.2.1 4 Jinko Solar Holding Co Ltd
- 17.2.1.1. Overview
- 17.2.1.2. Products
- 17.2.1.3. SWOT Analysis
- 17.2.1.4. Recent Developments
- 17.2.1.5. Financials (Based on Availability)
- 17.2.2 2 EDF SA
- 17.2.2.1. Overview
- 17.2.2.2. Products
- 17.2.2.3. SWOT Analysis
- 17.2.2.4. Recent Developments
- 17.2.2.5. Financials (Based on Availability)
- 17.2.3 2 Vestas Wind Systems AS
- 17.2.3.1. Overview
- 17.2.3.2. Products
- 17.2.3.3. SWOT Analysis
- 17.2.3.4. Recent Developments
- 17.2.3.5. Financials (Based on Availability)
- 17.2.4 1 First Solar Inc
- 17.2.4.1. Overview
- 17.2.4.2. Products
- 17.2.4.3. SWOT Analysis
- 17.2.4.4. Recent Developments
- 17.2.4.5. Financials (Based on Availability)
- 17.2.5 5 Berkshire Hathway Energy
- 17.2.5.1. Overview
- 17.2.5.2. Products
- 17.2.5.3. SWOT Analysis
- 17.2.5.4. Recent Developments
- 17.2.5.5. Financials (Based on Availability)
- 17.2.6 Equipment Suppliers
- 17.2.6.1. Overview
- 17.2.6.2. Products
- 17.2.6.3. SWOT Analysis
- 17.2.6.4. Recent Developments
- 17.2.6.5. Financials (Based on Availability)
- 17.2.7 1 Orsted AS
- 17.2.7.1. Overview
- 17.2.7.2. Products
- 17.2.7.3. SWOT Analysis
- 17.2.7.4. Recent Developments
- 17.2.7.5. Financials (Based on Availability)
- 17.2.8 EPC Developers/Operators/Owners
- 17.2.8.1. Overview
- 17.2.8.2. Products
- 17.2.8.3. SWOT Analysis
- 17.2.8.4. Recent Developments
- 17.2.8.5. Financials (Based on Availability)
- 17.2.9 3 Canadian Solar Inc
- 17.2.9.1. Overview
- 17.2.9.2. Products
- 17.2.9.3. SWOT Analysis
- 17.2.9.4. Recent Developments
- 17.2.9.5. Financials (Based on Availability)
- 17.2.10 4 Duke Energy Corporation
- 17.2.10.1. Overview
- 17.2.10.2. Products
- 17.2.10.3. SWOT Analysis
- 17.2.10.4. Recent Developments
- 17.2.10.5. Financials (Based on Availability)
- 17.2.11 6 Acciona Energia SA
- 17.2.11.1. Overview
- 17.2.11.2. Products
- 17.2.11.3. SWOT Analysis
- 17.2.11.4. Recent Developments
- 17.2.11.5. Financials (Based on Availability)
- 17.2.12 3 NextEra Energy Inc
- 17.2.12.1. Overview
- 17.2.12.2. Products
- 17.2.12.3. SWOT Analysis
- 17.2.12.4. Recent Developments
- 17.2.12.5. Financials (Based on Availability)
- 17.2.13 5 General Electric Company
- 17.2.13.1. Overview
- 17.2.13.2. Products
- 17.2.13.3. SWOT Analysis
- 17.2.13.4. Recent Developments
- 17.2.13.5. Financials (Based on Availability)
- 17.2.14 6 Siemens Gamesa Renewable Energy SA*List Not Exhaustive 6 4 Market Ranking/Share (%) Analysi
- 17.2.14.1. Overview
- 17.2.14.2. Products
- 17.2.14.3. SWOT Analysis
- 17.2.14.4. Recent Developments
- 17.2.14.5. Financials (Based on Availability)
- 17.2.1 4 Jinko Solar Holding Co Ltd
List of Figures
- Figure 1: Global Renewable Energy Market Revenue Breakdown (Trillion, %) by Region 2024 & 2032
- Figure 2: Global Renewable Energy Market Volume Breakdown (TW, %) by Region 2024 & 2032
- Figure 3: North America Renewable Energy Market Revenue (Trillion), by Country 2024 & 2032
- Figure 4: North America Renewable Energy Market Volume (TW), by Country 2024 & 2032
- Figure 5: North America Renewable Energy Market Revenue Share (%), by Country 2024 & 2032
- Figure 6: North America Renewable Energy Market Volume Share (%), by Country 2024 & 2032
- Figure 7: Europe Renewable Energy Market Revenue (Trillion), by Country 2024 & 2032
- Figure 8: Europe Renewable Energy Market Volume (TW), by Country 2024 & 2032
- Figure 9: Europe Renewable Energy Market Revenue Share (%), by Country 2024 & 2032
- Figure 10: Europe Renewable Energy Market Volume Share (%), by Country 2024 & 2032
- Figure 11: Asia Pacific Renewable Energy Market Revenue (Trillion), by Country 2024 & 2032
- Figure 12: Asia Pacific Renewable Energy Market Volume (TW), by Country 2024 & 2032
- Figure 13: Asia Pacific Renewable Energy Market Revenue Share (%), by Country 2024 & 2032
- Figure 14: Asia Pacific Renewable Energy Market Volume Share (%), by Country 2024 & 2032
- Figure 15: South America Renewable Energy Market Revenue (Trillion), by Country 2024 & 2032
- Figure 16: South America Renewable Energy Market Volume (TW), by Country 2024 & 2032
- Figure 17: South America Renewable Energy Market Revenue Share (%), by Country 2024 & 2032
- Figure 18: South America Renewable Energy Market Volume Share (%), by Country 2024 & 2032
- Figure 19: North America Renewable Energy Market Revenue (Trillion), by Country 2024 & 2032
- Figure 20: North America Renewable Energy Market Volume (TW), by Country 2024 & 2032
- Figure 21: North America Renewable Energy Market Revenue Share (%), by Country 2024 & 2032
- Figure 22: North America Renewable Energy Market Volume Share (%), by Country 2024 & 2032
- Figure 23: MEA Renewable Energy Market Revenue (Trillion), by Country 2024 & 2032
- Figure 24: MEA Renewable Energy Market Volume (TW), by Country 2024 & 2032
- Figure 25: MEA Renewable Energy Market Revenue Share (%), by Country 2024 & 2032
- Figure 26: MEA Renewable Energy Market Volume Share (%), by Country 2024 & 2032
- Figure 27: North America Renewable Energy Market Revenue (Trillion), by Type 2024 & 2032
- Figure 28: North America Renewable Energy Market Volume (TW), by Type 2024 & 2032
- Figure 29: North America Renewable Energy Market Revenue Share (%), by Type 2024 & 2032
- Figure 30: North America Renewable Energy Market Volume Share (%), by Type 2024 & 2032
- Figure 31: North America Renewable Energy Market Revenue (Trillion), by Country 2024 & 2032
- Figure 32: North America Renewable Energy Market Volume (TW), by Country 2024 & 2032
- Figure 33: North America Renewable Energy Market Revenue Share (%), by Country 2024 & 2032
- Figure 34: North America Renewable Energy Market Volume Share (%), by Country 2024 & 2032
- Figure 35: Europe Renewable Energy Market Revenue (Trillion), by Type 2024 & 2032
- Figure 36: Europe Renewable Energy Market Volume (TW), by Type 2024 & 2032
- Figure 37: Europe Renewable Energy Market Revenue Share (%), by Type 2024 & 2032
- Figure 38: Europe Renewable Energy Market Volume Share (%), by Type 2024 & 2032
- Figure 39: Europe Renewable Energy Market Revenue (Trillion), by Country 2024 & 2032
- Figure 40: Europe Renewable Energy Market Volume (TW), by Country 2024 & 2032
- Figure 41: Europe Renewable Energy Market Revenue Share (%), by Country 2024 & 2032
- Figure 42: Europe Renewable Energy Market Volume Share (%), by Country 2024 & 2032
- Figure 43: Asia Pacific Renewable Energy Market Revenue (Trillion), by Type 2024 & 2032
- Figure 44: Asia Pacific Renewable Energy Market Volume (TW), by Type 2024 & 2032
- Figure 45: Asia Pacific Renewable Energy Market Revenue Share (%), by Type 2024 & 2032
- Figure 46: Asia Pacific Renewable Energy Market Volume Share (%), by Type 2024 & 2032
- Figure 47: Asia Pacific Renewable Energy Market Revenue (Trillion), by Country 2024 & 2032
- Figure 48: Asia Pacific Renewable Energy Market Volume (TW), by Country 2024 & 2032
- Figure 49: Asia Pacific Renewable Energy Market Revenue Share (%), by Country 2024 & 2032
- Figure 50: Asia Pacific Renewable Energy Market Volume Share (%), by Country 2024 & 2032
- Figure 51: Middle East and Africa Renewable Energy Market Revenue (Trillion), by Type 2024 & 2032
- Figure 52: Middle East and Africa Renewable Energy Market Volume (TW), by Type 2024 & 2032
- Figure 53: Middle East and Africa Renewable Energy Market Revenue Share (%), by Type 2024 & 2032
- Figure 54: Middle East and Africa Renewable Energy Market Volume Share (%), by Type 2024 & 2032
- Figure 55: Middle East and Africa Renewable Energy Market Revenue (Trillion), by Country 2024 & 2032
- Figure 56: Middle East and Africa Renewable Energy Market Volume (TW), by Country 2024 & 2032
- Figure 57: Middle East and Africa Renewable Energy Market Revenue Share (%), by Country 2024 & 2032
- Figure 58: Middle East and Africa Renewable Energy Market Volume Share (%), by Country 2024 & 2032
- Figure 59: South America Renewable Energy Market Revenue (Trillion), by Type 2024 & 2032
- Figure 60: South America Renewable Energy Market Volume (TW), by Type 2024 & 2032
- Figure 61: South America Renewable Energy Market Revenue Share (%), by Type 2024 & 2032
- Figure 62: South America Renewable Energy Market Volume Share (%), by Type 2024 & 2032
- Figure 63: South America Renewable Energy Market Revenue (Trillion), by Country 2024 & 2032
- Figure 64: South America Renewable Energy Market Volume (TW), by Country 2024 & 2032
- Figure 65: South America Renewable Energy Market Revenue Share (%), by Country 2024 & 2032
- Figure 66: South America Renewable Energy Market Volume Share (%), by Country 2024 & 2032
List of Tables
- Table 1: Global Renewable Energy Market Revenue Trillion Forecast, by Region 2019 & 2032
- Table 2: Global Renewable Energy Market Volume TW Forecast, by Region 2019 & 2032
- Table 3: Global Renewable Energy Market Revenue Trillion Forecast, by Type 2019 & 2032
- Table 4: Global Renewable Energy Market Volume TW Forecast, by Type 2019 & 2032
- Table 5: Global Renewable Energy Market Revenue Trillion Forecast, by Region 2019 & 2032
- Table 6: Global Renewable Energy Market Volume TW Forecast, by Region 2019 & 2032
- Table 7: Global Renewable Energy Market Revenue Trillion Forecast, by Country 2019 & 2032
- Table 8: Global Renewable Energy Market Volume TW Forecast, by Country 2019 & 2032
- Table 9: United States Renewable Energy Market Revenue (Trillion) Forecast, by Application 2019 & 2032
- Table 10: United States Renewable Energy Market Volume (TW) Forecast, by Application 2019 & 2032
- Table 11: Canada Renewable Energy Market Revenue (Trillion) Forecast, by Application 2019 & 2032
- Table 12: Canada Renewable Energy Market Volume (TW) Forecast, by Application 2019 & 2032
- Table 13: Mexico Renewable Energy Market Revenue (Trillion) Forecast, by Application 2019 & 2032
- Table 14: Mexico Renewable Energy Market Volume (TW) Forecast, by Application 2019 & 2032
- Table 15: Global Renewable Energy Market Revenue Trillion Forecast, by Country 2019 & 2032
- Table 16: Global Renewable Energy Market Volume TW Forecast, by Country 2019 & 2032
- Table 17: Germany Renewable Energy Market Revenue (Trillion) Forecast, by Application 2019 & 2032
- Table 18: Germany Renewable Energy Market Volume (TW) Forecast, by Application 2019 & 2032
- Table 19: United Kingdom Renewable Energy Market Revenue (Trillion) Forecast, by Application 2019 & 2032
- Table 20: United Kingdom Renewable Energy Market Volume (TW) Forecast, by Application 2019 & 2032
- Table 21: France Renewable Energy Market Revenue (Trillion) Forecast, by Application 2019 & 2032
- Table 22: France Renewable Energy Market Volume (TW) Forecast, by Application 2019 & 2032
- Table 23: Spain Renewable Energy Market Revenue (Trillion) Forecast, by Application 2019 & 2032
- Table 24: Spain Renewable Energy Market Volume (TW) Forecast, by Application 2019 & 2032
- Table 25: Italy Renewable Energy Market Revenue (Trillion) Forecast, by Application 2019 & 2032
- Table 26: Italy Renewable Energy Market Volume (TW) Forecast, by Application 2019 & 2032
- Table 27: Spain Renewable Energy Market Revenue (Trillion) Forecast, by Application 2019 & 2032
- Table 28: Spain Renewable Energy Market Volume (TW) Forecast, by Application 2019 & 2032
- Table 29: Belgium Renewable Energy Market Revenue (Trillion) Forecast, by Application 2019 & 2032
- Table 30: Belgium Renewable Energy Market Volume (TW) Forecast, by Application 2019 & 2032
- Table 31: Netherland Renewable Energy Market Revenue (Trillion) Forecast, by Application 2019 & 2032
- Table 32: Netherland Renewable Energy Market Volume (TW) Forecast, by Application 2019 & 2032
- Table 33: Nordics Renewable Energy Market Revenue (Trillion) Forecast, by Application 2019 & 2032
- Table 34: Nordics Renewable Energy Market Volume (TW) Forecast, by Application 2019 & 2032
- Table 35: Rest of Europe Renewable Energy Market Revenue (Trillion) Forecast, by Application 2019 & 2032
- Table 36: Rest of Europe Renewable Energy Market Volume (TW) Forecast, by Application 2019 & 2032
- Table 37: Global Renewable Energy Market Revenue Trillion Forecast, by Country 2019 & 2032
- Table 38: Global Renewable Energy Market Volume TW Forecast, by Country 2019 & 2032
- Table 39: China Renewable Energy Market Revenue (Trillion) Forecast, by Application 2019 & 2032
- Table 40: China Renewable Energy Market Volume (TW) Forecast, by Application 2019 & 2032
- Table 41: Japan Renewable Energy Market Revenue (Trillion) Forecast, by Application 2019 & 2032
- Table 42: Japan Renewable Energy Market Volume (TW) Forecast, by Application 2019 & 2032
- Table 43: India Renewable Energy Market Revenue (Trillion) Forecast, by Application 2019 & 2032
- Table 44: India Renewable Energy Market Volume (TW) Forecast, by Application 2019 & 2032
- Table 45: South Korea Renewable Energy Market Revenue (Trillion) Forecast, by Application 2019 & 2032
- Table 46: South Korea Renewable Energy Market Volume (TW) Forecast, by Application 2019 & 2032
- Table 47: Southeast Asia Renewable Energy Market Revenue (Trillion) Forecast, by Application 2019 & 2032
- Table 48: Southeast Asia Renewable Energy Market Volume (TW) Forecast, by Application 2019 & 2032
- Table 49: Australia Renewable Energy Market Revenue (Trillion) Forecast, by Application 2019 & 2032
- Table 50: Australia Renewable Energy Market Volume (TW) Forecast, by Application 2019 & 2032
- Table 51: Indonesia Renewable Energy Market Revenue (Trillion) Forecast, by Application 2019 & 2032
- Table 52: Indonesia Renewable Energy Market Volume (TW) Forecast, by Application 2019 & 2032
- Table 53: Phillipes Renewable Energy Market Revenue (Trillion) Forecast, by Application 2019 & 2032
- Table 54: Phillipes Renewable Energy Market Volume (TW) Forecast, by Application 2019 & 2032
- Table 55: Singapore Renewable Energy Market Revenue (Trillion) Forecast, by Application 2019 & 2032
- Table 56: Singapore Renewable Energy Market Volume (TW) Forecast, by Application 2019 & 2032
- Table 57: Thailandc Renewable Energy Market Revenue (Trillion) Forecast, by Application 2019 & 2032
- Table 58: Thailandc Renewable Energy Market Volume (TW) Forecast, by Application 2019 & 2032
- Table 59: Rest of Asia Pacific Renewable Energy Market Revenue (Trillion) Forecast, by Application 2019 & 2032
- Table 60: Rest of Asia Pacific Renewable Energy Market Volume (TW) Forecast, by Application 2019 & 2032
- Table 61: Global Renewable Energy Market Revenue Trillion Forecast, by Country 2019 & 2032
- Table 62: Global Renewable Energy Market Volume TW Forecast, by Country 2019 & 2032
- Table 63: Brazil Renewable Energy Market Revenue (Trillion) Forecast, by Application 2019 & 2032
- Table 64: Brazil Renewable Energy Market Volume (TW) Forecast, by Application 2019 & 2032
- Table 65: Argentina Renewable Energy Market Revenue (Trillion) Forecast, by Application 2019 & 2032
- Table 66: Argentina Renewable Energy Market Volume (TW) Forecast, by Application 2019 & 2032
- Table 67: Peru Renewable Energy Market Revenue (Trillion) Forecast, by Application 2019 & 2032
- Table 68: Peru Renewable Energy Market Volume (TW) Forecast, by Application 2019 & 2032
- Table 69: Chile Renewable Energy Market Revenue (Trillion) Forecast, by Application 2019 & 2032
- Table 70: Chile Renewable Energy Market Volume (TW) Forecast, by Application 2019 & 2032
- Table 71: Colombia Renewable Energy Market Revenue (Trillion) Forecast, by Application 2019 & 2032
- Table 72: Colombia Renewable Energy Market Volume (TW) Forecast, by Application 2019 & 2032
- Table 73: Ecuador Renewable Energy Market Revenue (Trillion) Forecast, by Application 2019 & 2032
- Table 74: Ecuador Renewable Energy Market Volume (TW) Forecast, by Application 2019 & 2032
- Table 75: Venezuela Renewable Energy Market Revenue (Trillion) Forecast, by Application 2019 & 2032
- Table 76: Venezuela Renewable Energy Market Volume (TW) Forecast, by Application 2019 & 2032
- Table 77: Rest of South America Renewable Energy Market Revenue (Trillion) Forecast, by Application 2019 & 2032
- Table 78: Rest of South America Renewable Energy Market Volume (TW) Forecast, by Application 2019 & 2032
- Table 79: Global Renewable Energy Market Revenue Trillion Forecast, by Country 2019 & 2032
- Table 80: Global Renewable Energy Market Volume TW Forecast, by Country 2019 & 2032
- Table 81: United States Renewable Energy Market Revenue (Trillion) Forecast, by Application 2019 & 2032
- Table 82: United States Renewable Energy Market Volume (TW) Forecast, by Application 2019 & 2032
- Table 83: Canada Renewable Energy Market Revenue (Trillion) Forecast, by Application 2019 & 2032
- Table 84: Canada Renewable Energy Market Volume (TW) Forecast, by Application 2019 & 2032
- Table 85: Mexico Renewable Energy Market Revenue (Trillion) Forecast, by Application 2019 & 2032
- Table 86: Mexico Renewable Energy Market Volume (TW) Forecast, by Application 2019 & 2032
- Table 87: Global Renewable Energy Market Revenue Trillion Forecast, by Country 2019 & 2032
- Table 88: Global Renewable Energy Market Volume TW Forecast, by Country 2019 & 2032
- Table 89: United Arab Emirates Renewable Energy Market Revenue (Trillion) Forecast, by Application 2019 & 2032
- Table 90: United Arab Emirates Renewable Energy Market Volume (TW) Forecast, by Application 2019 & 2032
- Table 91: Saudi Arabia Renewable Energy Market Revenue (Trillion) Forecast, by Application 2019 & 2032
- Table 92: Saudi Arabia Renewable Energy Market Volume (TW) Forecast, by Application 2019 & 2032
- Table 93: South Africa Renewable Energy Market Revenue (Trillion) Forecast, by Application 2019 & 2032
- Table 94: South Africa Renewable Energy Market Volume (TW) Forecast, by Application 2019 & 2032
- Table 95: Rest of Middle East and Africa Renewable Energy Market Revenue (Trillion) Forecast, by Application 2019 & 2032
- Table 96: Rest of Middle East and Africa Renewable Energy Market Volume (TW) Forecast, by Application 2019 & 2032
- Table 97: Global Renewable Energy Market Revenue Trillion Forecast, by Type 2019 & 2032
- Table 98: Global Renewable Energy Market Volume TW Forecast, by Type 2019 & 2032
- Table 99: Global Renewable Energy Market Revenue Trillion Forecast, by Country 2019 & 2032
- Table 100: Global Renewable Energy Market Volume TW Forecast, by Country 2019 & 2032
- Table 101: United States of America Renewable Energy Market Revenue (Trillion) Forecast, by Application 2019 & 2032
- Table 102: United States of America Renewable Energy Market Volume (TW) Forecast, by Application 2019 & 2032
- Table 103: Canada Renewable Energy Market Revenue (Trillion) Forecast, by Application 2019 & 2032
- Table 104: Canada Renewable Energy Market Volume (TW) Forecast, by Application 2019 & 2032
- Table 105: Rest of the North America Renewable Energy Market Revenue (Trillion) Forecast, by Application 2019 & 2032
- Table 106: Rest of the North America Renewable Energy Market Volume (TW) Forecast, by Application 2019 & 2032
- Table 107: Global Renewable Energy Market Revenue Trillion Forecast, by Type 2019 & 2032
- Table 108: Global Renewable Energy Market Volume TW Forecast, by Type 2019 & 2032
- Table 109: Global Renewable Energy Market Revenue Trillion Forecast, by Country 2019 & 2032
- Table 110: Global Renewable Energy Market Volume TW Forecast, by Country 2019 & 2032
- Table 111: United Kingdom Renewable Energy Market Revenue (Trillion) Forecast, by Application 2019 & 2032
- Table 112: United Kingdom Renewable Energy Market Volume (TW) Forecast, by Application 2019 & 2032
- Table 113: Germany Renewable Energy Market Revenue (Trillion) Forecast, by Application 2019 & 2032
- Table 114: Germany Renewable Energy Market Volume (TW) Forecast, by Application 2019 & 2032
- Table 115: France Renewable Energy Market Revenue (Trillion) Forecast, by Application 2019 & 2032
- Table 116: France Renewable Energy Market Volume (TW) Forecast, by Application 2019 & 2032
- Table 117: Spain Renewable Energy Market Revenue (Trillion) Forecast, by Application 2019 & 2032
- Table 118: Spain Renewable Energy Market Volume (TW) Forecast, by Application 2019 & 2032
- Table 119: NORDIC Renewable Energy Market Revenue (Trillion) Forecast, by Application 2019 & 2032
- Table 120: NORDIC Renewable Energy Market Volume (TW) Forecast, by Application 2019 & 2032
- Table 121: Turkey Renewable Energy Market Revenue (Trillion) Forecast, by Application 2019 & 2032
- Table 122: Turkey Renewable Energy Market Volume (TW) Forecast, by Application 2019 & 2032
- Table 123: Russia Renewable Energy Market Revenue (Trillion) Forecast, by Application 2019 & 2032
- Table 124: Russia Renewable Energy Market Volume (TW) Forecast, by Application 2019 & 2032
- Table 125: Rest of the Europe Renewable Energy Market Revenue (Trillion) Forecast, by Application 2019 & 2032
- Table 126: Rest of the Europe Renewable Energy Market Volume (TW) Forecast, by Application 2019 & 2032
- Table 127: Global Renewable Energy Market Revenue Trillion Forecast, by Type 2019 & 2032
- Table 128: Global Renewable Energy Market Volume TW Forecast, by Type 2019 & 2032
- Table 129: Global Renewable Energy Market Revenue Trillion Forecast, by Country 2019 & 2032
- Table 130: Global Renewable Energy Market Volume TW Forecast, by Country 2019 & 2032
- Table 131: China Renewable Energy Market Revenue (Trillion) Forecast, by Application 2019 & 2032
- Table 132: China Renewable Energy Market Volume (TW) Forecast, by Application 2019 & 2032
- Table 133: India Renewable Energy Market Revenue (Trillion) Forecast, by Application 2019 & 2032
- Table 134: India Renewable Energy Market Volume (TW) Forecast, by Application 2019 & 2032
- Table 135: Japan Renewable Energy Market Revenue (Trillion) Forecast, by Application 2019 & 2032
- Table 136: Japan Renewable Energy Market Volume (TW) Forecast, by Application 2019 & 2032
- Table 137: Malaysia Renewable Energy Market Revenue (Trillion) Forecast, by Application 2019 & 2032
- Table 138: Malaysia Renewable Energy Market Volume (TW) Forecast, by Application 2019 & 2032
- Table 139: Thailand Renewable Energy Market Revenue (Trillion) Forecast, by Application 2019 & 2032
- Table 140: Thailand Renewable Energy Market Volume (TW) Forecast, by Application 2019 & 2032
- Table 141: Indonesia Renewable Energy Market Revenue (Trillion) Forecast, by Application 2019 & 2032
- Table 142: Indonesia Renewable Energy Market Volume (TW) Forecast, by Application 2019 & 2032
- Table 143: Vietnam Renewable Energy Market Revenue (Trillion) Forecast, by Application 2019 & 2032
- Table 144: Vietnam Renewable Energy Market Volume (TW) Forecast, by Application 2019 & 2032
- Table 145: Rest of Asia Pacific Renewable Energy Market Revenue (Trillion) Forecast, by Application 2019 & 2032
- Table 146: Rest of Asia Pacific Renewable Energy Market Volume (TW) Forecast, by Application 2019 & 2032
- Table 147: Global Renewable Energy Market Revenue Trillion Forecast, by Type 2019 & 2032
- Table 148: Global Renewable Energy Market Volume TW Forecast, by Type 2019 & 2032
- Table 149: Global Renewable Energy Market Revenue Trillion Forecast, by Country 2019 & 2032
- Table 150: Global Renewable Energy Market Volume TW Forecast, by Country 2019 & 2032
- Table 151: United Arab Emirates Renewable Energy Market Revenue (Trillion) Forecast, by Application 2019 & 2032
- Table 152: United Arab Emirates Renewable Energy Market Volume (TW) Forecast, by Application 2019 & 2032
- Table 153: Saudi Arabia Renewable Energy Market Revenue (Trillion) Forecast, by Application 2019 & 2032
- Table 154: Saudi Arabia Renewable Energy Market Volume (TW) Forecast, by Application 2019 & 2032
- Table 155: Egypt Renewable Energy Market Revenue (Trillion) Forecast, by Application 2019 & 2032
- Table 156: Egypt Renewable Energy Market Volume (TW) Forecast, by Application 2019 & 2032
- Table 157: Nigeria Renewable Energy Market Revenue (Trillion) Forecast, by Application 2019 & 2032
- Table 158: Nigeria Renewable Energy Market Volume (TW) Forecast, by Application 2019 & 2032
- Table 159: South Africa Renewable Energy Market Revenue (Trillion) Forecast, by Application 2019 & 2032
- Table 160: South Africa Renewable Energy Market Volume (TW) Forecast, by Application 2019 & 2032
- Table 161: Qatar Renewable Energy Market Revenue (Trillion) Forecast, by Application 2019 & 2032
- Table 162: Qatar Renewable Energy Market Volume (TW) Forecast, by Application 2019 & 2032
- Table 163: Rest of the Middle East and Africa Renewable Energy Market Revenue (Trillion) Forecast, by Application 2019 & 2032
- Table 164: Rest of the Middle East and Africa Renewable Energy Market Volume (TW) Forecast, by Application 2019 & 2032
- Table 165: Global Renewable Energy Market Revenue Trillion Forecast, by Type 2019 & 2032
- Table 166: Global Renewable Energy Market Volume TW Forecast, by Type 2019 & 2032
- Table 167: Global Renewable Energy Market Revenue Trillion Forecast, by Country 2019 & 2032
- Table 168: Global Renewable Energy Market Volume TW Forecast, by Country 2019 & 2032
- Table 169: Brazil Renewable Energy Market Revenue (Trillion) Forecast, by Application 2019 & 2032
- Table 170: Brazil Renewable Energy Market Volume (TW) Forecast, by Application 2019 & 2032
- Table 171: Argentina Renewable Energy Market Revenue (Trillion) Forecast, by Application 2019 & 2032
- Table 172: Argentina Renewable Energy Market Volume (TW) Forecast, by Application 2019 & 2032
- Table 173: Colombia Renewable Energy Market Revenue (Trillion) Forecast, by Application 2019 & 2032
- Table 174: Colombia Renewable Energy Market Volume (TW) Forecast, by Application 2019 & 2032
- Table 175: Rest of the South America Renewable Energy Market Revenue (Trillion) Forecast, by Application 2019 & 2032
- Table 176: Rest of the South America Renewable Energy Market Volume (TW) Forecast, by Application 2019 & 2032
Frequently Asked Questions
1. What is the projected Compound Annual Growth Rate (CAGR) of the Renewable Energy Market?
The projected CAGR is approximately 7.09%.
2. Which companies are prominent players in the Renewable Energy Market?
Key companies in the market include 4 Jinko Solar Holding Co Ltd, 2 EDF SA, 2 Vestas Wind Systems AS, 1 First Solar Inc, 5 Berkshire Hathway Energy, Equipment Suppliers, 1 Orsted AS, EPC Developers/Operators/Owners, 3 Canadian Solar Inc, 4 Duke Energy Corporation, 6 Acciona Energia SA, 3 NextEra Energy Inc, 5 General Electric Company, 6 Siemens Gamesa Renewable Energy SA*List Not Exhaustive 6 4 Market Ranking/Share (%) Analysi.
3. What are the main segments of the Renewable Energy Market?
The market segments include Type.
4. Can you provide details about the market size?
The market size is estimated to be USD 1.32 Trillion as of 2022.
5. What are some drivers contributing to market growth?
4.; Favorable Government Policies for Renewable Energy4.; The Declining Price of Solar Panels and Wind Turbine Installations4.; Increasing Investments in Hydropower and Pumped Storage Hydropower Projects4.; Growing Emphasis on Geothermal Energy.
6. What are the notable trends driving market growth?
Hydropower Segment is Expected to Dominate the Market during the Forecast Period.
7. Are there any restraints impacting market growth?
4.; Increasing Penetration of Natural Gas for Power Generation.
8. Can you provide examples of recent developments in the market?
April 2023: ArcelorMittal announced that the company's Brazilian entity, ArcelorMittal Brazil, formed a joint venture with the Brazilian renewable energy company Casa dos Ventos to develop the 554 MW Babilonia wind power project. The project is expected to be developed at a cost of USD 800 million and will be located in the central region of Bahia, northeast Brazil. ArcelorMittal is anticipated to hold a 55% share in the joint venture, and the remaining share will be held by Casa dos Ventos.
9. What pricing options are available for accessing the report?
Pricing options include single-user, multi-user, and enterprise licenses priced at USD 4750, USD 5250, and USD 8750 respectively.
10. Is the market size provided in terms of value or volume?
The market size is provided in terms of value, measured in Trillion and volume, measured in TW.
11. Are there any specific market keywords associated with the report?
Yes, the market keyword associated with the report is "Renewable Energy Market," which aids in identifying and referencing the specific market segment covered.
12. How do I determine which pricing option suits my needs best?
The pricing options vary based on user requirements and access needs. Individual users may opt for single-user licenses, while businesses requiring broader access may choose multi-user or enterprise licenses for cost-effective access to the report.
13. Are there any additional resources or data provided in the Renewable Energy Market report?
While the report offers comprehensive insights, it's advisable to review the specific contents or supplementary materials provided to ascertain if additional resources or data are available.
14. How can I stay updated on further developments or reports in the Renewable Energy Market?
To stay informed about further developments, trends, and reports in the Renewable Energy Market, consider subscribing to industry newsletters, following relevant companies and organizations, or regularly checking reputable industry news sources and publications.
Methodology
Step 1 - Identification of Relevant Samples Size from Population Database


Step 2 - Approaches for Defining Global Market Size (Value, Volume* & Price*)

Note*: In applicable scenarios
Step 3 - Data Sources
Primary Research
- Web Analytics
- Survey Reports
- Research Institute
- Latest Research Reports
- Opinion Leaders
Secondary Research
- Annual Reports
- White Paper
- Latest Press Release
- Industry Association
- Paid Database
- Investor Presentations

Step 4 - Data Triangulation
Involves using different sources of information in order to increase the validity of a study
These sources are likely to be stakeholders in a program - participants, other researchers, program staff, other community members, and so on.
Then we put all data in single framework & apply various statistical tools to find out the dynamic on the market.
During the analysis stage, feedback from the stakeholder groups would be compared to determine areas of agreement as well as areas of divergence
