

Key Insights
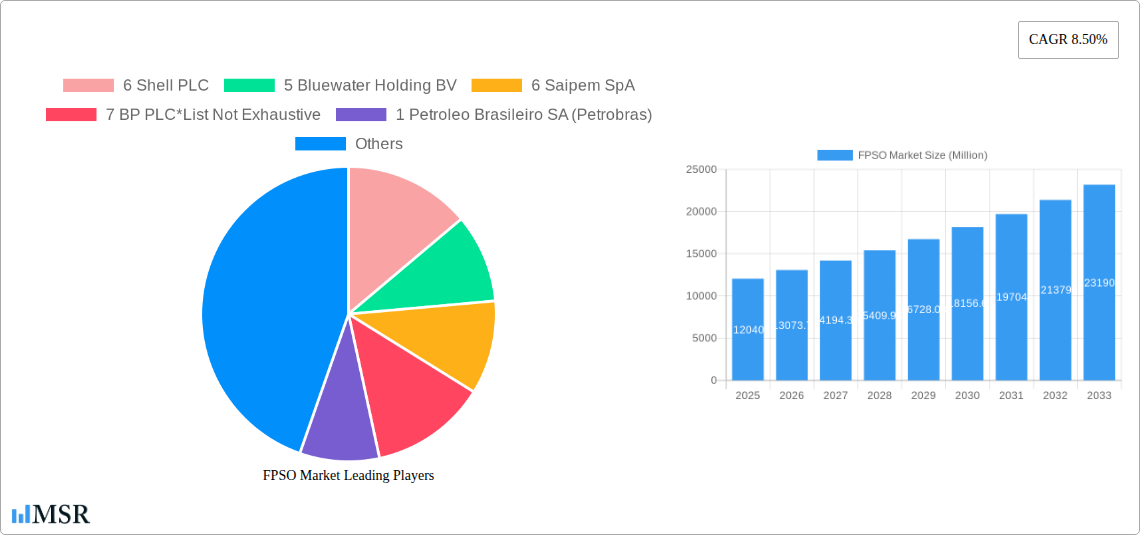
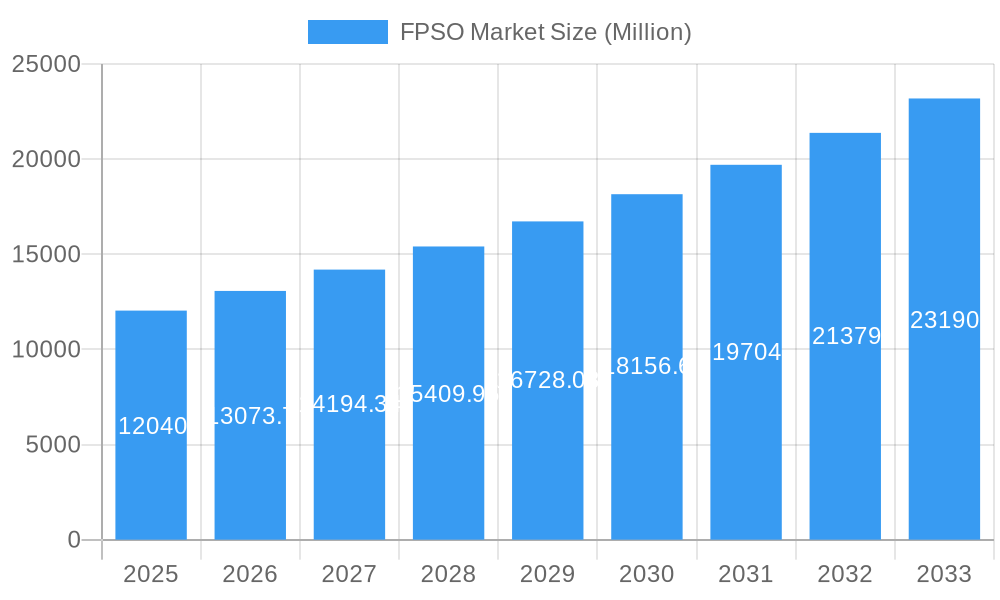
The Floating Production Storage and Offloading (FPSO) market is poised for significant expansion, currently valued at an estimated USD 12.04 billion and projected to grow at a robust Compound Annual Growth Rate (CAGR) of 8.50% through 2033. This impressive growth is primarily driven by the increasing demand for offshore oil and gas exploration and production, particularly in deep and ultra-deepwater environments where traditional fixed platforms are less viable. Key market drivers include the need for cost-effective and flexible production solutions, the development of previously inaccessible offshore reserves, and the ongoing technological advancements in FPSO design and deployment that enhance efficiency and reduce operational risks. Emerging economies in the Asia Pacific and Middle East regions are also contributing to this growth with their expanding energy needs and significant offshore projects.
FPSO Market Market Size (In Billion)
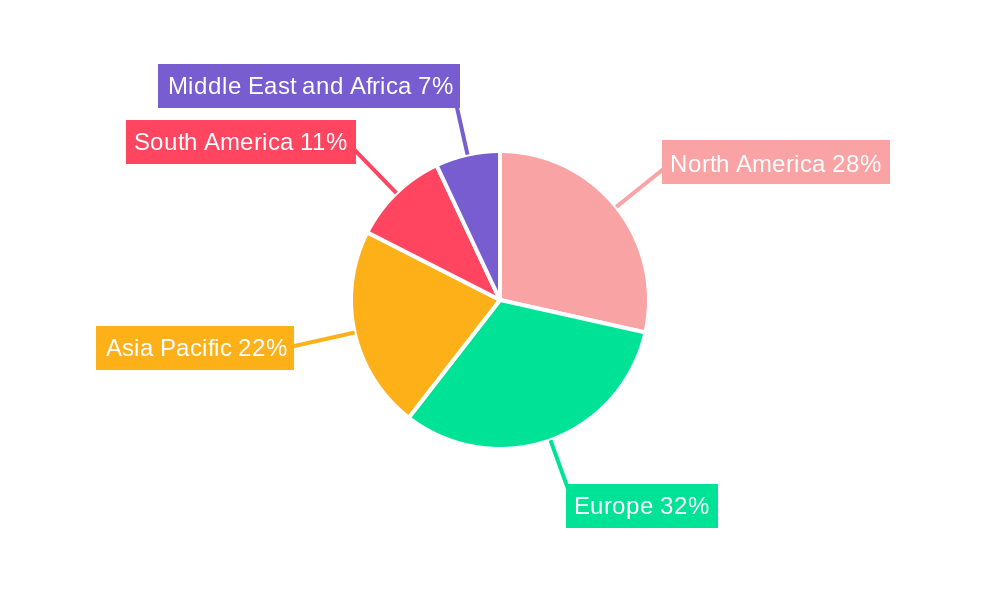
The FPSO market is characterized by a dynamic competitive landscape, with major players like Shell PLC, BP PLC, Saipem SpA, and Bluewater Holding BV actively involved in both operator-owned and contractor-owned segments. The market is segmented by water depth, with deep water and ultra-deep water applications showing the strongest growth potential, reflecting the industry's push into more challenging offshore frontiers. While the market benefits from strong demand, potential restraints include the volatility of crude oil prices, stringent environmental regulations, and the substantial capital investment required for FPSO projects. However, the increasing focus on developing marginal fields and the lifecycle extension of existing offshore assets are expected to mitigate these challenges, ensuring sustained market vitality. Geographically, North America, Europe (particularly with Norway and the UK's offshore activities), and Asia Pacific are leading regions for FPSO deployment, with South America and the Middle East also presenting substantial opportunities.
FPSO Market Company Market Share
Unlocking Offshore Potential: In-Depth FPSO Market Report (2019-2033)
Gain a critical understanding of the global Floating Production, Storage, and Offloading (FPSO) market with this comprehensive report. Covering the historical period from 2019-2024 and projecting through 2033, this analysis provides actionable insights for FPSO operators, FPSO contractors, and other industry stakeholders. We delve into market concentration, key industry trends, dominant market segments, product developments, challenges, growth drivers, emerging opportunities, leading players, and pivotal milestones. Navigate the complex landscape of offshore oil and gas production with data-backed strategies.
FPSO Market Market Concentration & Dynamics
The FPSO market exhibits a moderate level of concentration, with a handful of major players holding significant sway. Modec Inc., a leading FPSO contractor, consistently innovates to secure market share. The industry is characterized by a dynamic innovation ecosystem, driven by the increasing need for efficient and cost-effective extraction solutions in challenging offshore environments. Regulatory frameworks, particularly concerning environmental safety and emissions, are becoming more stringent, influencing technological advancements and operational practices. Substitute products, such as fixed platforms in shallower waters, exist but are less viable for deep and ultra-deep water projects, underscoring the FPSO's strategic importance. End-user trends reveal a growing preference for integrated solutions and lifecycle support from FPSO providers. Merger and acquisition (M&A) activities, while not excessively high, indicate strategic consolidation among key players seeking to expand their capabilities and market reach. For instance, potential M&A involving major entities like Saipem SpA and Petrofac Limited could reshape the competitive landscape.
- Key Dynamics:
- Technological innovation in mooring systems, topside processing, and subsea integration.
- Increasing demand for FPSOs in remote and challenging offshore locations.
- Emphasis on sustainability and reduced environmental impact in FPSO designs and operations.
- Strategic partnerships between FPSO operators and contractors to de-risk projects.
FPSO Market Industry Insights & Trends
The global FPSO market is poised for substantial growth, fueled by the escalating demand for oil and gas resources and the increasing complexity of offshore exploration. The market size is projected to reach xx Million by 2025, with a robust Compound Annual Growth Rate (CAGR) of xx% anticipated during the forecast period of 2025–2033. This growth is primarily driven by the need to access reserves in deep and ultra-deep water environments where traditional fixed platforms are economically or technically unfeasible. Technological disruptions are central to this trend, with continuous advancements in hull designs, turret systems, and processing capabilities enhancing FPSO efficiency and safety. Evolving consumer behaviors, particularly the growing global energy demand and the strategic importance of energy security for nations, further bolster the market. The increasing focus on lifecycle management and the operational longevity of FPSOs is also a significant trend, with operators like SBM Offshore NV investing in advanced maintenance and support services. The transition to cleaner energy sources is also influencing the market, with some FPSOs being adapted for potential future use in carbon capture and storage (CCS) or hydrogen production.
- Growth Drivers:
- Depletion of onshore and shallow-water reserves, pushing exploration into deeper waters.
- Advancements in subsea technology enabling remote field development.
- Government incentives and policies supporting offshore oil and gas production.
- The cost-effectiveness and flexibility of FPSOs for marginal fields and phased developments.
Key Markets & Segments Leading FPSO Market
The Deep Water segment is currently the dominant force in the FPSO market, driven by the exploration and production of hydrocarbon reserves in these challenging offshore regions. Ultra-deep water applications are also experiencing rapid growth as technological capabilities expand. Geographically, regions with significant offshore oil and gas potential, such as North America (particularly the Gulf of Mexico) and South America (Brazil), lead in FPSO deployment. Asia-Pacific is also a rapidly growing market due to significant offshore discoveries and increasing energy demand.
Ownership: Operator-owned FPSOs are prevalent, allowing major oil companies to maintain direct control over their assets and operations. However, Contractor-owned FPSOs are gaining traction, offering flexibility and reduced upfront capital expenditure for operators. This ownership model is particularly attractive for smaller operators or for projects with uncertain reserve volumes.
Water Depth Segments:
- Deep Water: This segment is characterized by numerous large-scale projects, requiring sophisticated FPSO designs capable of handling high pressures and large volumes. The economic viability of deep-water fields often hinges on the efficiency and reliability of FPSO units. Countries like Brazil, with its pre-salt discoveries, are major contributors to this segment's dominance.
- Ultra-deep Water: This is the fastest-growing segment, with FPSO technology pushing the boundaries of exploration depth. Innovations in mooring systems, risers, and subsea equipment are crucial for unlocking reserves in these extreme environments. Projects in the Gulf of Mexico and off the coast of West Africa are significant drivers.
- Shallow Water: While less dominant for new FPSO deployments, existing FPSOs in shallow waters continue to operate, and some smaller fields may still favor this solution for its cost-effectiveness compared to fixed platforms in certain scenarios.
FPSO Market Product Developments
The FPSO market is continuously shaped by product innovations aimed at enhancing efficiency, safety, and environmental performance. Recent developments include advancements in turret and mooring systems for improved stability in harsh weather conditions, modular topside processing units for greater flexibility and faster deployment, and integrated subsea tie-back solutions to optimize field development. The incorporation of digital technologies for real-time monitoring, predictive maintenance, and remote operational support is a key trend, increasing operational uptime and reducing maintenance costs. Furthermore, there is a growing focus on developing FPSOs that can be adapted for future energy transitions, such as supporting carbon capture and storage (CCS) facilities or the production of hydrogen. These innovations provide a competitive edge by reducing project execution risks and improving the overall economic viability of offshore E&P projects.
Challenges in the FPSO Market Market
The FPSO market faces several challenges that can impede growth and project execution. These include:
- Regulatory Hurdles: Increasingly stringent environmental regulations and permitting processes can cause project delays and increase compliance costs.
- Supply Chain Disruptions: Global supply chain volatility, particularly for specialized components and skilled labor, can lead to cost overruns and schedule slippages.
- Competitive Pressures: Intense competition among FPSO manufacturers and contractors can put pressure on profit margins and necessitate continuous cost optimization.
- Technological Complexity: Developing and deploying FPSOs for ultra-deep water and harsh environments requires sophisticated engineering and significant capital investment, posing inherent risks.
- Geopolitical Instability: Fluctuations in oil prices and geopolitical uncertainties can impact investment decisions for new offshore projects.
Forces Driving FPSO Market Growth
The FPSO market is propelled by a confluence of potent forces. The relentless global demand for oil and gas, coupled with the depletion of easily accessible onshore and shallow-water reserves, compels exploration and production into more challenging deep and ultra-deep water frontiers. Technological advancements, particularly in subsea infrastructure, turret systems, and topside processing, have made these complex environments more economically viable. Furthermore, the inherent flexibility and cost-effectiveness of FPSOs for marginal fields and phased developments make them an attractive proposition for operators. Government support through favorable fiscal regimes and regulatory frameworks in many offshore-rich nations also acts as a significant catalyst, encouraging investment in these capital-intensive projects.
Challenges in the FPSO Market Market
(This section appears to be a duplicate of the previous "Challenges in the FPSO Market Market." Assuming this is intended to discuss long-term growth catalysts, here's an interpretation. If it's a strict repetition, it should be removed.)
Long-term growth catalysts for the FPSO market are rooted in sustained innovation and strategic market expansion. The continuous evolution of mooring technologies, subsea processing capabilities, and digitalization for enhanced operational efficiency will unlock new frontiers and optimize existing operations. Strategic partnerships between FPSO operators and FPSO contractors, such as the one between SBM Offshore and Esso Exploration & Production Guyana, are crucial for de-risking complex projects and ensuring reliable, long-term asset performance. Furthermore, the adaptation of FPSO technology for emerging energy sectors, like carbon capture and storage (CCS) and offshore wind power generation support vessels, presents significant diversification opportunities and future market expansion.
Emerging Opportunities in FPSO Market
Emerging opportunities in the FPSO market are diverse and promising. The increasing focus on decarbonization is driving interest in FPSOs that can support carbon capture and storage (CCS) projects, utilizing existing infrastructure and expertise. Furthermore, the development of offshore wind farms is creating opportunities for specialized floating platforms, some of which can leverage FPSO technology for power export and grid integration. The exploration and production of unconventional offshore resources, such as gas hydrates, represent a future frontier. Enhanced digital solutions, including AI-powered predictive maintenance and autonomous operations, offer avenues for improved efficiency and reduced operational costs, creating value for both operators and contractors. Finally, the expansion of FPSO services beyond traditional production to encompass decommissioning and recycling solutions presents new business models.
Leading Players in the FPSO Market Sector
- Modec Inc.
- SBM Offshore NV
- BW Offshore Limited
- Bluewater Holding BV
- Teekay Offshore Partners LP
- Chevron Corporation
- ExxonMobil Corp
- Shell PLC
- BP PLC
- TotalEnergies SE
- Petrofac Limited
- Saipem SpA
- CNOOC Ltd
- Petroleo Brasileiro SA (Petrobras)
Key Milestones in FPSO Market Industry
- May 2023: SBM Offshore and Esso Exploration & Production Guyana entered a 10-year Operations and Maintenance Enabling Agreement, entrusting SBM Offshore with the operations and maintenance of four FPSOs: Liza Destiny, Liza Unity, Prosperity, and ONE GUYANA.
- April 2023: Shell resumed operations at the Pierce field in the United Kingdom Central North Sea following a major upgrade of the Haewene Brim FPSO for gas production, including the installation of a new subsea gas export line.
- April 2023: KBR was awarded an engineering contract for Equinor's Bay du Nord project in offshore Canada, valued at USD 9.4 billion, potentially encompassing detailed design and procurement management services for the FPSO unit.
Strategic Outlook for FPSO Market Market
The strategic outlook for the FPSO market is characterized by sustained growth, driven by the ongoing demand for offshore hydrocarbon resources and technological advancements. Key growth accelerators include the expansion into deeper and more challenging water depths, where FPSOs remain the most viable solution. The increasing emphasis on lifecycle management and operational efficiency will drive demand for integrated services and digital solutions. Strategic partnerships and potential M&A activities among leading FPSO contractors and FPSO operators will likely continue to shape the competitive landscape, leading to greater consolidation and enhanced capabilities. Furthermore, the growing interest in FPSO adaptability for future energy transitions, such as CCS, presents significant long-term market potential and strategic diversification opportunities.
FPSO Market Segmentation
-
1. Ownership
- 1.1. Operator-owned
- 1.2. Contractor-owned
-
2. Water Depth
- 2.1. Shallow Water
- 2.2. Deep Water
- 2.3. Ultra-deep Water
FPSO Market Segmentation By Geography
-
1. North America
- 1.1. United States
- 1.2. Canada
- 1.3. Mexico
- 1.4. Rest of North America
-
2. Europe
- 2.1. Norway
- 2.2. United Kingdom
- 2.3. Russia
- 2.4. Netherland
- 2.5. France
- 2.6. Italy
- 2.7. NORDIC
- 2.8. Germany
- 2.9. Spain
- 2.10. Rest of Europe
-
3. Asia Pacific
- 3.1. China
- 3.2. India
- 3.3. Australia
- 3.4. Indonesia
- 3.5. Malaysia
- 3.6. Thailand
- 3.7. Japan
- 3.8. Vietnam
- 3.9. Rest of Asia Pacific
-
4. South America
- 4.1. Brazil
- 4.2. Argentina
- 4.3. Venezuela
- 4.4. Colombia
- 4.5. Rest of South America
-
5. Middle East and Africa
- 5.1. Saudi Arabia
- 5.2. United Arab Emirates
- 5.3. Nigeria
- 5.4. Algeria
- 5.5. Qatar
- 5.6. South Africa
- 5.7. Egypt
- 5.8. Rest of Middle East and Africa
FPSO Market Regional Market Share
Geographic Coverage of FPSO Market
FPSO Market REPORT HIGHLIGHTS
| Aspects | Details |
|---|---|
| Study Period | 2020-2034 |
| Base Year | 2025 |
| Estimated Year | 2026 |
| Forecast Period | 2026-2034 |
| Historical Period | 2020-2025 |
| Growth Rate | CAGR of 8.50% from 2020-2034 |
| Segmentation |
|
Table of Contents
- 1. Introduction
- 1.1. Research Scope
- 1.2. Market Segmentation
- 1.3. Research Objective
- 1.4. Definitions and Assumptions
- 2. Executive Summary
- 2.1. Market Snapshot
- 3. Market Dynamics
- 3.1. Market Drivers
- 3.2. Market Restrains
- 3.3. Market Trends
- 3.4. Market Opportunities
- 4. Market Factor Analysis
- 4.1. Porters Five Forces
- 4.1.1. Bargaining Power of Suppliers
- 4.1.2. Bargaining Power of Buyers
- 4.1.3. Threat of New Entrants
- 4.1.4. Threat of Substitutes
- 4.1.5. Competitive Rivalry
- 4.2. PESTEL analysis
- 4.3. BCG Analysis
- 4.3.1. Stars (High Growth, High Market Share)
- 4.3.2. Cash Cows (Low Growth, High Market Share)
- 4.3.3. Question Mark (High Growth, Low Market Share)
- 4.3.4. Dogs (Low Growth, Low Market Share)
- 4.4. Ansoff Matrix Analysis
- 4.5. Supply Chain Analysis
- 4.6. Regulatory Landscape
- 4.7. Current Market Potential and Opportunity Assessment (TAM–SAM–SOM Framework)
- 4.8. MSR Analyst Note
- 4.1. Porters Five Forces
- 5. Market Analysis, Insights and Forecast 2021-2033
- 5.1. Market Analysis, Insights and Forecast - by Ownership
- 5.1.1. Operator-owned
- 5.1.2. Contractor-owned
- 5.2. Market Analysis, Insights and Forecast - by Water Depth
- 5.2.1. Shallow Water
- 5.2.2. Deep Water
- 5.2.3. Ultra-deep Water
- 5.3. Market Analysis, Insights and Forecast - by Region
- 5.3.1. North America
- 5.3.2. Europe
- 5.3.3. Asia Pacific
- 5.3.4. South America
- 5.3.5. Middle East and Africa
- 5.1. Market Analysis, Insights and Forecast - by Ownership
- 6. Global FPSO Market Analysis, Insights and Forecast, 2021-2033
- 6.1. Market Analysis, Insights and Forecast - by Ownership
- 6.1.1. Operator-owned
- 6.1.2. Contractor-owned
- 6.2. Market Analysis, Insights and Forecast - by Water Depth
- 6.2.1. Shallow Water
- 6.2.2. Deep Water
- 6.2.3. Ultra-deep Water
- 6.1. Market Analysis, Insights and Forecast - by Ownership
- 7. North America FPSO Market Analysis, Insights and Forecast, 2020-2032
- 7.1. Market Analysis, Insights and Forecast - by Ownership
- 7.1.1. Operator-owned
- 7.1.2. Contractor-owned
- 7.2. Market Analysis, Insights and Forecast - by Water Depth
- 7.2.1. Shallow Water
- 7.2.2. Deep Water
- 7.2.3. Ultra-deep Water
- 7.1. Market Analysis, Insights and Forecast - by Ownership
- 8. Europe FPSO Market Analysis, Insights and Forecast, 2020-2032
- 8.1. Market Analysis, Insights and Forecast - by Ownership
- 8.1.1. Operator-owned
- 8.1.2. Contractor-owned
- 8.2. Market Analysis, Insights and Forecast - by Water Depth
- 8.2.1. Shallow Water
- 8.2.2. Deep Water
- 8.2.3. Ultra-deep Water
- 8.1. Market Analysis, Insights and Forecast - by Ownership
- 9. Asia Pacific FPSO Market Analysis, Insights and Forecast, 2020-2032
- 9.1. Market Analysis, Insights and Forecast - by Ownership
- 9.1.1. Operator-owned
- 9.1.2. Contractor-owned
- 9.2. Market Analysis, Insights and Forecast - by Water Depth
- 9.2.1. Shallow Water
- 9.2.2. Deep Water
- 9.2.3. Ultra-deep Water
- 9.1. Market Analysis, Insights and Forecast - by Ownership
- 10. South America FPSO Market Analysis, Insights and Forecast, 2020-2032
- 10.1. Market Analysis, Insights and Forecast - by Ownership
- 10.1.1. Operator-owned
- 10.1.2. Contractor-owned
- 10.2. Market Analysis, Insights and Forecast - by Water Depth
- 10.2.1. Shallow Water
- 10.2.2. Deep Water
- 10.2.3. Ultra-deep Water
- 10.1. Market Analysis, Insights and Forecast - by Ownership
- 11. Middle East and Africa FPSO Market Analysis, Insights and Forecast, 2020-2032
- 11.1. Market Analysis, Insights and Forecast - by Ownership
- 11.1.1. Operator-owned
- 11.1.2. Contractor-owned
- 11.2. Market Analysis, Insights and Forecast - by Water Depth
- 11.2.1. Shallow Water
- 11.2.2. Deep Water
- 11.2.3. Ultra-deep Water
- 11.1. Market Analysis, Insights and Forecast - by Ownership
- 12. Competitive Analysis
- 12.1. Company Profiles
- 12.1.1 6 Shell PLC
- 12.1.1.1. Company Overview
- 12.1.1.2. Products
- 12.1.1.3. Company Financials
- 12.1.1.4. SWOT Analysis
- 12.1.2 5 Bluewater Holding BV
- 12.1.2.1. Company Overview
- 12.1.2.2. Products
- 12.1.2.3. Company Financials
- 12.1.2.4. SWOT Analysis
- 12.1.3 6 Saipem SpA
- 12.1.3.1. Company Overview
- 12.1.3.2. Products
- 12.1.3.3. Company Financials
- 12.1.3.4. SWOT Analysis
- 12.1.4 7 BP PLC*List Not Exhaustive
- 12.1.4.1. Company Overview
- 12.1.4.2. Products
- 12.1.4.3. Company Financials
- 12.1.4.4. SWOT Analysis
- 12.1.5 1 Petroleo Brasileiro SA (Petrobras)
- 12.1.5.1. Company Overview
- 12.1.5.2. Products
- 12.1.5.3. Company Financials
- 12.1.5.4. SWOT Analysis
- 12.1.6 4 Teekay Offshore Partners LP
- 12.1.6.1. Company Overview
- 12.1.6.2. Products
- 12.1.6.3. Company Financials
- 12.1.6.4. SWOT Analysis
- 12.1.7 5 Chevron Corporation
- 12.1.7.1. Company Overview
- 12.1.7.2. Products
- 12.1.7.3. Company Financials
- 12.1.7.4. SWOT Analysis
- 12.1.8 3 TotalEnergies SE
- 12.1.8.1. Company Overview
- 12.1.8.2. Products
- 12.1.8.3. Company Financials
- 12.1.8.4. SWOT Analysis
- 12.1.9 7 Petrofac Limited
- 12.1.9.1. Company Overview
- 12.1.9.2. Products
- 12.1.9.3. Company Financials
- 12.1.9.4. SWOT Analysis
- 12.1.10 4 ExxonMobil Corp
- 12.1.10.1. Company Overview
- 12.1.10.2. Products
- 12.1.10.3. Company Financials
- 12.1.10.4. SWOT Analysis
- 12.1.11 1 Modec Inc
- 12.1.11.1. Company Overview
- 12.1.11.2. Products
- 12.1.11.3. Company Financials
- 12.1.11.4. SWOT Analysis
- 12.1.12 3 BW Offshore Limited
- 12.1.12.1. Company Overview
- 12.1.12.2. Products
- 12.1.12.3. Company Financials
- 12.1.12.4. SWOT Analysis
- 12.1.13 FPSO Operators
- 12.1.13.1. Company Overview
- 12.1.13.2. Products
- 12.1.13.3. Company Financials
- 12.1.13.4. SWOT Analysis
- 12.1.14 2 SBM Offshore NV
- 12.1.14.1. Company Overview
- 12.1.14.2. Products
- 12.1.14.3. Company Financials
- 12.1.14.4. SWOT Analysis
- 12.1.15 2 CNOOC Ltd
- 12.1.15.1. Company Overview
- 12.1.15.2. Products
- 12.1.15.3. Company Financials
- 12.1.15.4. SWOT Analysis
- 12.1.16 FPSO Contractors
- 12.1.16.1. Company Overview
- 12.1.16.2. Products
- 12.1.16.3. Company Financials
- 12.1.16.4. SWOT Analysis
- 12.1.1 6 Shell PLC
- 12.2. Market Entropy
- 12.2.1 Company's Key Areas Served
- 12.2.2 Recent Developments
- 12.3. Company Market Share Analysis 2025
- 12.3.1 Top 5 Companies Market Share Analysis
- 12.3.2 Top 3 Companies Market Share Analysis
- 12.4. List of Potential Customers
- 13. Research Methodology
List of Figures
- Figure 1: Global FPSO Market Revenue Breakdown (Million, %) by Region 2025 & 2033
- Figure 2: North America FPSO Market Revenue (Million), by Ownership 2025 & 2033
- Figure 3: North America FPSO Market Revenue Share (%), by Ownership 2025 & 2033
- Figure 4: North America FPSO Market Revenue (Million), by Water Depth 2025 & 2033
- Figure 5: North America FPSO Market Revenue Share (%), by Water Depth 2025 & 2033
- Figure 6: North America FPSO Market Revenue (Million), by Country 2025 & 2033
- Figure 7: North America FPSO Market Revenue Share (%), by Country 2025 & 2033
- Figure 8: Europe FPSO Market Revenue (Million), by Ownership 2025 & 2033
- Figure 9: Europe FPSO Market Revenue Share (%), by Ownership 2025 & 2033
- Figure 10: Europe FPSO Market Revenue (Million), by Water Depth 2025 & 2033
- Figure 11: Europe FPSO Market Revenue Share (%), by Water Depth 2025 & 2033
- Figure 12: Europe FPSO Market Revenue (Million), by Country 2025 & 2033
- Figure 13: Europe FPSO Market Revenue Share (%), by Country 2025 & 2033
- Figure 14: Asia Pacific FPSO Market Revenue (Million), by Ownership 2025 & 2033
- Figure 15: Asia Pacific FPSO Market Revenue Share (%), by Ownership 2025 & 2033
- Figure 16: Asia Pacific FPSO Market Revenue (Million), by Water Depth 2025 & 2033
- Figure 17: Asia Pacific FPSO Market Revenue Share (%), by Water Depth 2025 & 2033
- Figure 18: Asia Pacific FPSO Market Revenue (Million), by Country 2025 & 2033
- Figure 19: Asia Pacific FPSO Market Revenue Share (%), by Country 2025 & 2033
- Figure 20: South America FPSO Market Revenue (Million), by Ownership 2025 & 2033
- Figure 21: South America FPSO Market Revenue Share (%), by Ownership 2025 & 2033
- Figure 22: South America FPSO Market Revenue (Million), by Water Depth 2025 & 2033
- Figure 23: South America FPSO Market Revenue Share (%), by Water Depth 2025 & 2033
- Figure 24: South America FPSO Market Revenue (Million), by Country 2025 & 2033
- Figure 25: South America FPSO Market Revenue Share (%), by Country 2025 & 2033
- Figure 26: Middle East and Africa FPSO Market Revenue (Million), by Ownership 2025 & 2033
- Figure 27: Middle East and Africa FPSO Market Revenue Share (%), by Ownership 2025 & 2033
- Figure 28: Middle East and Africa FPSO Market Revenue (Million), by Water Depth 2025 & 2033
- Figure 29: Middle East and Africa FPSO Market Revenue Share (%), by Water Depth 2025 & 2033
- Figure 30: Middle East and Africa FPSO Market Revenue (Million), by Country 2025 & 2033
- Figure 31: Middle East and Africa FPSO Market Revenue Share (%), by Country 2025 & 2033
List of Tables
- Table 1: Global FPSO Market Revenue Million Forecast, by Ownership 2020 & 2033
- Table 2: Global FPSO Market Revenue Million Forecast, by Water Depth 2020 & 2033
- Table 3: Global FPSO Market Revenue Million Forecast, by Region 2020 & 2033
- Table 4: Global FPSO Market Revenue Million Forecast, by Ownership 2020 & 2033
- Table 5: Global FPSO Market Revenue Million Forecast, by Water Depth 2020 & 2033
- Table 6: Global FPSO Market Revenue Million Forecast, by Country 2020 & 2033
- Table 7: United States FPSO Market Revenue (Million) Forecast, by Application 2020 & 2033
- Table 8: Canada FPSO Market Revenue (Million) Forecast, by Application 2020 & 2033
- Table 9: Mexico FPSO Market Revenue (Million) Forecast, by Application 2020 & 2033
- Table 10: Rest of North America FPSO Market Revenue (Million) Forecast, by Application 2020 & 2033
- Table 11: Global FPSO Market Revenue Million Forecast, by Ownership 2020 & 2033
- Table 12: Global FPSO Market Revenue Million Forecast, by Water Depth 2020 & 2033
- Table 13: Global FPSO Market Revenue Million Forecast, by Country 2020 & 2033
- Table 14: Norway FPSO Market Revenue (Million) Forecast, by Application 2020 & 2033
- Table 15: United Kingdom FPSO Market Revenue (Million) Forecast, by Application 2020 & 2033
- Table 16: Russia FPSO Market Revenue (Million) Forecast, by Application 2020 & 2033
- Table 17: Netherland FPSO Market Revenue (Million) Forecast, by Application 2020 & 2033
- Table 18: France FPSO Market Revenue (Million) Forecast, by Application 2020 & 2033
- Table 19: Italy FPSO Market Revenue (Million) Forecast, by Application 2020 & 2033
- Table 20: NORDIC FPSO Market Revenue (Million) Forecast, by Application 2020 & 2033
- Table 21: Germany FPSO Market Revenue (Million) Forecast, by Application 2020 & 2033
- Table 22: Spain FPSO Market Revenue (Million) Forecast, by Application 2020 & 2033
- Table 23: Rest of Europe FPSO Market Revenue (Million) Forecast, by Application 2020 & 2033
- Table 24: Global FPSO Market Revenue Million Forecast, by Ownership 2020 & 2033
- Table 25: Global FPSO Market Revenue Million Forecast, by Water Depth 2020 & 2033
- Table 26: Global FPSO Market Revenue Million Forecast, by Country 2020 & 2033
- Table 27: China FPSO Market Revenue (Million) Forecast, by Application 2020 & 2033
- Table 28: India FPSO Market Revenue (Million) Forecast, by Application 2020 & 2033
- Table 29: Australia FPSO Market Revenue (Million) Forecast, by Application 2020 & 2033
- Table 30: Indonesia FPSO Market Revenue (Million) Forecast, by Application 2020 & 2033
- Table 31: Malaysia FPSO Market Revenue (Million) Forecast, by Application 2020 & 2033
- Table 32: Thailand FPSO Market Revenue (Million) Forecast, by Application 2020 & 2033
- Table 33: Japan FPSO Market Revenue (Million) Forecast, by Application 2020 & 2033
- Table 34: Vietnam FPSO Market Revenue (Million) Forecast, by Application 2020 & 2033
- Table 35: Rest of Asia Pacific FPSO Market Revenue (Million) Forecast, by Application 2020 & 2033
- Table 36: Global FPSO Market Revenue Million Forecast, by Ownership 2020 & 2033
- Table 37: Global FPSO Market Revenue Million Forecast, by Water Depth 2020 & 2033
- Table 38: Global FPSO Market Revenue Million Forecast, by Country 2020 & 2033
- Table 39: Brazil FPSO Market Revenue (Million) Forecast, by Application 2020 & 2033
- Table 40: Argentina FPSO Market Revenue (Million) Forecast, by Application 2020 & 2033
- Table 41: Venezuela FPSO Market Revenue (Million) Forecast, by Application 2020 & 2033
- Table 42: Colombia FPSO Market Revenue (Million) Forecast, by Application 2020 & 2033
- Table 43: Rest of South America FPSO Market Revenue (Million) Forecast, by Application 2020 & 2033
- Table 44: Global FPSO Market Revenue Million Forecast, by Ownership 2020 & 2033
- Table 45: Global FPSO Market Revenue Million Forecast, by Water Depth 2020 & 2033
- Table 46: Global FPSO Market Revenue Million Forecast, by Country 2020 & 2033
- Table 47: Saudi Arabia FPSO Market Revenue (Million) Forecast, by Application 2020 & 2033
- Table 48: United Arab Emirates FPSO Market Revenue (Million) Forecast, by Application 2020 & 2033
- Table 49: Nigeria FPSO Market Revenue (Million) Forecast, by Application 2020 & 2033
- Table 50: Algeria FPSO Market Revenue (Million) Forecast, by Application 2020 & 2033
- Table 51: Qatar FPSO Market Revenue (Million) Forecast, by Application 2020 & 2033
- Table 52: South Africa FPSO Market Revenue (Million) Forecast, by Application 2020 & 2033
- Table 53: Egypt FPSO Market Revenue (Million) Forecast, by Application 2020 & 2033
- Table 54: Rest of Middle East and Africa FPSO Market Revenue (Million) Forecast, by Application 2020 & 2033
Frequently Asked Questions
1. What is the projected Compound Annual Growth Rate (CAGR) of the FPSO Market?
The projected CAGR is approximately 8.50%.
2. Which companies are prominent players in the FPSO Market?
Key companies in the market include 6 Shell PLC, 5 Bluewater Holding BV, 6 Saipem SpA, 7 BP PLC*List Not Exhaustive, 1 Petroleo Brasileiro SA (Petrobras), 4 Teekay Offshore Partners LP, 5 Chevron Corporation, 3 TotalEnergies SE, 7 Petrofac Limited, 4 ExxonMobil Corp, 1 Modec Inc, 3 BW Offshore Limited, FPSO Operators, 2 SBM Offshore NV, 2 CNOOC Ltd, FPSO Contractors.
3. What are the main segments of the FPSO Market?
The market segments include Ownership, Water Depth.
4. Can you provide details about the market size?
The market size is estimated to be USD 12.04 Million as of 2022.
5. What are some drivers contributing to market growth?
4.; Increasing Offshore Oil and Gas Exploration and Production Activities4.; Growing Demand for Energy.
6. What are the notable trends driving market growth?
Contractor-owned FPSO Expected to Dominate the Market.
7. Are there any restraints impacting market growth?
4.; High Upfront Costs.
8. Can you provide examples of recent developments in the market?
May 2023: SBM Offshore and Esso Exploration & Production Guyana entered a 10-year Operations and Maintenance Enabling Agreement. The agreement entails SBM Offshore being responsible for the operations and maintenance of four FPSOs: Liza Destiny, Liza Unity, Prosperity, and ONE GUYANA.
9. What pricing options are available for accessing the report?
Pricing options include single-user, multi-user, and enterprise licenses priced at USD 4750, USD 5250, and USD 8750 respectively.
10. Is the market size provided in terms of value or volume?
The market size is provided in terms of value, measured in Million.
11. Are there any specific market keywords associated with the report?
Yes, the market keyword associated with the report is "FPSO Market," which aids in identifying and referencing the specific market segment covered.
12. How do I determine which pricing option suits my needs best?
The pricing options vary based on user requirements and access needs. Individual users may opt for single-user licenses, while businesses requiring broader access may choose multi-user or enterprise licenses for cost-effective access to the report.
13. Are there any additional resources or data provided in the FPSO Market report?
While the report offers comprehensive insights, it's advisable to review the specific contents or supplementary materials provided to ascertain if additional resources or data are available.
14. How can I stay updated on further developments or reports in the FPSO Market?
To stay informed about further developments, trends, and reports in the FPSO Market, consider subscribing to industry newsletters, following relevant companies and organizations, or regularly checking reputable industry news sources and publications.
Methodology
Step 1 - Identification of Relevant Samples Size from Population Database


Step 2 - Approaches for Defining Global Market Size (Value, Volume* & Price*)

Note*: In applicable scenarios
Step 3 - Data Sources
Primary Research
- Web Analytics
- Survey Reports
- Research Institute
- Latest Research Reports
- Opinion Leaders
Secondary Research
- Annual Reports
- White Paper
- Latest Press Release
- Industry Association
- Paid Database
- Investor Presentations

Step 4 - Data Triangulation
Involves using different sources of information in order to increase the validity of a study
These sources are likely to be stakeholders in a program - participants, other researchers, program staff, other community members, and so on.
Then we put all data in single framework & apply various statistical tools to find out the dynamic on the market.
During the analysis stage, feedback from the stakeholder groups would be compared to determine areas of agreement as well as areas of divergence