

Key Insights
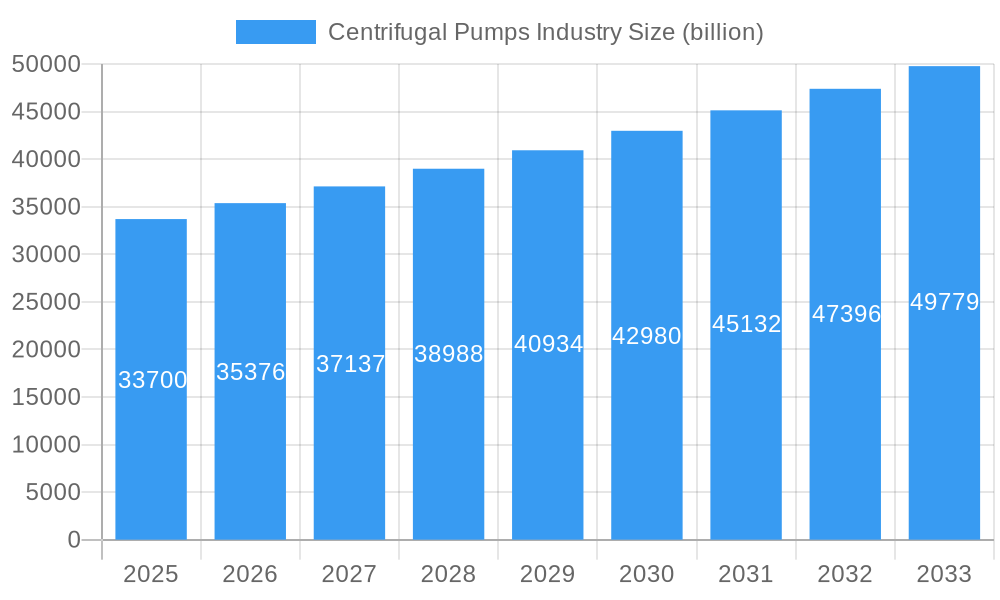
The global centrifugal pumps market is poised for robust expansion, estimated at $33.7 billion in 2025, with a projected Compound Annual Growth Rate (CAGR) of 5.1% through 2033. This significant growth is primarily fueled by increasing demand from critical sectors such as oil and gas, power generation, and various industrial applications. The oil and gas industry, in particular, requires high-performance centrifugal pumps for exploration, production, and refining processes, making it a dominant end-user segment. Similarly, the burgeoning power generation sector, driven by both traditional and renewable energy initiatives, relies heavily on centrifugal pumps for water circulation, steam generation, and cooling systems. Emerging economies are witnessing a surge in infrastructure development, further augmenting the demand for these essential fluid handling solutions.
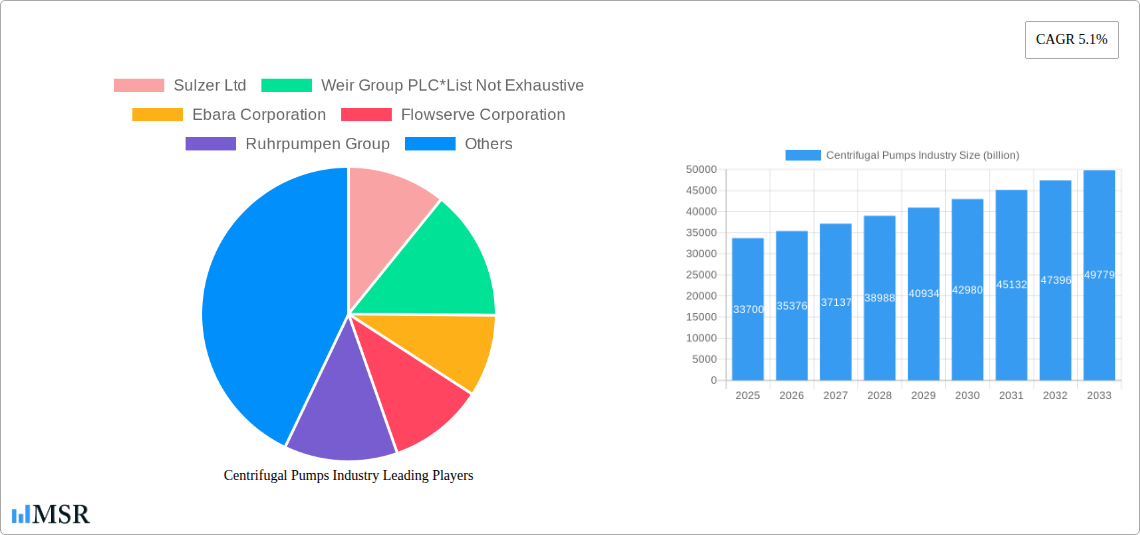
Centrifugal Pumps Industry Market Size (In Billion)
The centrifugal pumps market is characterized by continuous technological advancements aimed at improving efficiency, durability, and environmental compliance. Innovations in impeller design, such as the prevalent use of enclosed impellers for higher efficiency and reduced cavitation, alongside advancements in materials science for enhanced corrosion and abrasion resistance, are key trends. The market also sees a growing adoption of smart and connected pumps with integrated sensors and IoT capabilities, enabling predictive maintenance and optimized operational performance. While the market exhibits strong growth potential, certain factors could influence its trajectory. Stringent environmental regulations regarding energy efficiency and emissions can act as a restraint, pushing manufacturers towards developing more sustainable and energy-saving pump technologies. Furthermore, the high initial capital investment for advanced centrifugal pump systems might pose a challenge for some smaller enterprises.
Centrifugal Pumps Industry Company Market Share
Centrifugal Pumps Industry Market Report: Comprehensive Analysis & Future Outlook (2019–2033)
This in-depth report provides a definitive analysis of the global Centrifugal Pumps industry, offering crucial insights for stakeholders seeking to navigate this dynamic market. Spanning a study period from 2019 to 2033, with a base and estimated year of 2025 and a forecast period from 2025 to 2033, this report delves into historical trends, current market dynamics, and future projections. The global centrifugal pumps market is anticipated to reach trillions of dollars by 2033, exhibiting robust growth driven by increasing demand across key sectors like oil and gas, power generation, and water management.
Centrifugal Pumps Industry Market Concentration & Dynamics
The centrifugal pumps market exhibits a moderately concentrated landscape, with key players vying for significant market share. Innovation ecosystems are thriving, driven by technological advancements in energy efficiency, smart monitoring, and material science. Regulatory frameworks, particularly those focused on environmental standards and energy conservation, play a pivotal role in shaping product development and market entry. Substitute products, while present in niche applications, generally offer limited alternatives to the versatility and efficiency of centrifugal pumps in high-volume fluid transfer. End-user trends indicate a growing preference for intelligent, IoT-enabled pumps that offer predictive maintenance and real-time operational optimization. Mergers and acquisitions (M&A) activity is a significant dynamic, with companies strategically acquiring capabilities and market access to expand their global footprint. Over the historical period (2019-2024), there were approximately 50 significant M&A deals, contributing to market consolidation and technological integration.
Centrifugal Pumps Industry Industry Insights & Trends
The global centrifugal pumps market is poised for substantial growth, driven by a confluence of factors and evolving industry trends. The market size in the estimated year of 2025 is projected to be in the hundreds of billions of dollars, with a Compound Annual Growth Rate (CAGR) of approximately 5-7% anticipated during the forecast period (2025–2033). Key growth drivers include the escalating demand for water and wastewater management solutions, particularly in developing economies undergoing rapid urbanization and industrialization. The continuous expansion of the oil and gas sector, encompassing upstream exploration and downstream refining operations, necessitates a steady supply of high-performance centrifugal pumps for various fluid handling applications. Furthermore, the global transition towards renewable energy sources, such as solar and wind power, is spurring investments in associated infrastructure that relies heavily on efficient pumping systems for cooling, circulation, and water management. Technological disruptions are significantly influencing market dynamics. The integration of advanced materials, such as corrosion-resistant alloys and composites, is enhancing pump durability and performance in harsh environments. The advent of smart pumps, equipped with IoT capabilities, sensors, and advanced analytics, is revolutionizing operational efficiency, enabling predictive maintenance, and minimizing downtime. This shift towards digitalized pumping solutions caters to end-users’ growing demand for optimized performance and reduced operational expenditures. Evolving consumer behaviors, characterized by a stronger emphasis on sustainability and energy efficiency, are compelling manufacturers to develop pumps with lower energy consumption and a reduced environmental footprint. Industry players are increasingly focusing on developing energy-efficient designs, optimizing hydraulic performance, and implementing variable speed drives to meet these stringent requirements. The increasing need for robust and reliable fluid handling in critical infrastructure projects, such as dam construction, irrigation systems, and large-scale industrial plants, further propels the demand for advanced centrifugal pump technologies.
Key Markets & Segments Leading Centrifugal Pumps Industry
The global centrifugal pumps industry is a multifaceted market, with distinct regions, segments, and end-user industries exhibiting varying growth trajectories and dominance.
Dominant Regions & Countries:
- Asia Pacific: This region is a significant powerhouse, driven by rapid industrialization, massive infrastructure development projects, and a growing population requiring enhanced water and wastewater management. Countries like China and India are at the forefront of this growth, fueled by substantial investments in manufacturing, energy, and infrastructure.
- North America: This mature market continues to be a key contributor, driven by its extensive oil and gas industry, significant power generation capacity, and ongoing upgrades to aging water infrastructure.
Leading Segments:
- Stage: Multi-stage Pumps: These pumps are critical for applications requiring high pressure and flow rates, such as in oil and gas extraction, large-scale water supply, and industrial processing. Their ability to handle demanding conditions makes them indispensable.
- End-User: Oil and Gas: This sector remains a primary consumer of centrifugal pumps, utilized across the entire value chain from exploration and production to refining and petrochemicals. The increasing complexity of extraction processes and the need for efficient fluid transfer ensure sustained demand.
- Impeller Type: Enclosed Impellers: Enclosed impellers offer superior efficiency and hydraulic performance in many applications, especially those involving cleaner fluids. Their design minimizes leakage and maximizes fluid velocity, leading to optimized energy usage and higher throughput.
Drivers for Segment Dominance:
- Economic Growth & Industrialization: Strong economic performance in emerging economies fuels industrial expansion, leading to increased demand for fluid handling solutions.
- Infrastructure Development: Government investments in water supply, wastewater treatment, power grids, and transportation networks directly translate to a higher need for centrifugal pumps.
- Technological Advancements: Innovations in pump design, materials, and smart technologies enhance performance and efficiency, driving adoption in specialized applications.
- Resource Management: The global focus on efficient water management and the continued importance of energy resources ensure sustained demand from these sectors.
Centrifugal Pumps Industry Product Developments
Centrifugal pump manufacturers are continuously innovating to enhance efficiency, reliability, and intelligence. Recent product developments include the introduction of high-efficiency centrifugal pumps, such as the GSD ISH/ISP model, designed for optimal energy consumption. These advanced pumps can be integrated with IoT systems, enabling real-time monitoring, predictive alarms, and fault analysis, thereby optimizing operational states. Furthermore, the development of pumps with specialized materials resistant to corrosion and abrasion is expanding their application in aggressive chemical environments and offshore operations. The focus on modular designs for easier maintenance and the integration of variable speed drives for precise flow control are also key trends, providing competitive edges by reducing operating costs and improving process control for end-users.
Challenges in the Centrifugal Pumps Industry Market
The centrifugal pumps industry faces several critical challenges. Regulatory Hurdles related to increasingly stringent environmental standards and energy efficiency mandates can increase R&D and manufacturing costs. Supply Chain Volatility, particularly for specialized components and raw materials, can lead to production delays and increased expenses. Intense Competitive Pressures from both established players and new market entrants necessitate continuous innovation and cost optimization, impacting profit margins. The High Initial Investment Cost for advanced centrifugal pump systems can be a barrier for smaller enterprises or in price-sensitive markets.
Forces Driving Centrifugal Pumps Industry Growth
Several powerful forces are propelling the growth of the centrifugal pumps industry. Escalating Global Demand for Water and Wastewater Management is a primary driver, as populations grow and urbanization intensifies. The Continued Expansion of the Oil and Gas Sector, despite energy transition trends, still requires significant fluid handling infrastructure. The Global Shift Towards Renewable Energy Sources necessitates robust pumping systems for various applications, including hydropower and geothermal energy. Technological Advancements, such as the integration of smart sensors and IoT for predictive maintenance and operational optimization, are creating new market opportunities and enhancing pump efficiency. Government initiatives and investments in infrastructure development also play a crucial role.
Challenges in the Centrifugal Pumps Industry Market
While growth is robust, the centrifugal pumps industry must navigate significant challenges. Fluctuations in Raw Material Prices, particularly for metals and specialized alloys, can impact manufacturing costs and product pricing strategies. Skilled Labor Shortages in manufacturing and specialized maintenance can hinder production and service delivery. The Increasingly Complex Regulatory Landscape across different regions demands continuous adaptation and investment in compliance. Geopolitical Instability can disrupt global supply chains and affect demand in key markets. Addressing these challenges requires agile strategies, robust risk management, and a commitment to innovation.
Emerging Opportunities in Centrifugal Pumps Industry
Emerging opportunities within the centrifugal pumps industry are ripe for exploration. The growing demand for Smart and IoT-enabled Pumps presents a significant avenue for growth, offering enhanced performance and predictive maintenance capabilities. The expansion of the Water and Wastewater Treatment Sector, especially in developing nations, offers substantial market potential. The increasing adoption of Decentralized Water Systems and Smart Agriculture technologies will require specialized, efficient pumping solutions. Furthermore, the exploration and development of New Energy Technologies, such as hydrogen production and carbon capture, will create novel applications for advanced centrifugal pumps. The focus on Energy Efficiency and Sustainability across all industries is driving demand for ultra-efficient pump designs.
Leading Players in the Centrifugal Pumps Industry Sector
- Sulzer Ltd
- Weir Group PLC
- Ebara Corporation
- Flowserve Corporation
- Ruhrpumpen Group
- Schlumberger Ltd
- KSB SE & Co KGaA
- ITT Inc
- Dover Corporation
- Baker Hughes Company
Key Milestones in Centrifugal Pumps Industry Industry
- April 2022: GSD held an internal product launch of the ISH/ISP high-efficiency centrifugal pump. This pump's ability to integrate sensors for real-time monitoring, predictive alarming, fault analysis, energy efficiency analysis, and operation optimization via an intelligent IoT system signifies a leap in smart pumping technology.
- March 2023: KSB acquired Bharat Pumps, a prominent manufacturer of centrifugal pumps. This strategic acquisition, managed by KSB SupremeServ, aims to expand KSB's aftermarket services and spare parts business, particularly for over 5,000 Bharat Pumps products already installed across various Indian industries.
Strategic Outlook for Centrifugal Pumps Industry Market
The strategic outlook for the centrifugal pumps industry is overwhelmingly positive, characterized by sustained growth and innovation. Future market potential lies in the continued digitalization of pumping systems, offering enhanced efficiency and predictive capabilities. Strategic opportunities exist in expanding market reach in emerging economies, particularly in the water and wastewater infrastructure sectors. Partnerships and collaborations focused on developing advanced, sustainable pumping solutions for the evolving energy landscape, including renewables and emerging technologies, will be crucial. The industry's ability to adapt to stringent environmental regulations and leverage technological advancements will be key to unlocking future growth and maintaining a competitive edge.
Centrifugal Pumps Industry Segmentation
-
1. Stage
- 1.1. Single-stage Pumps
- 1.2. Multi-stage Pumps
-
2. End-User
- 2.1. Oil and Gas
- 2.2. Power Generation
- 2.3. Other End-Users
-
3. Impeller Type
- 3.1. Open
- 3.2. Partially Open
- 3.3. Enclosed
Centrifugal Pumps Industry Segmentation By Geography
- 1. North America
- 2. Europe
- 3. Asia Pacific
- 4. South America
- 5. Middle East and Africa
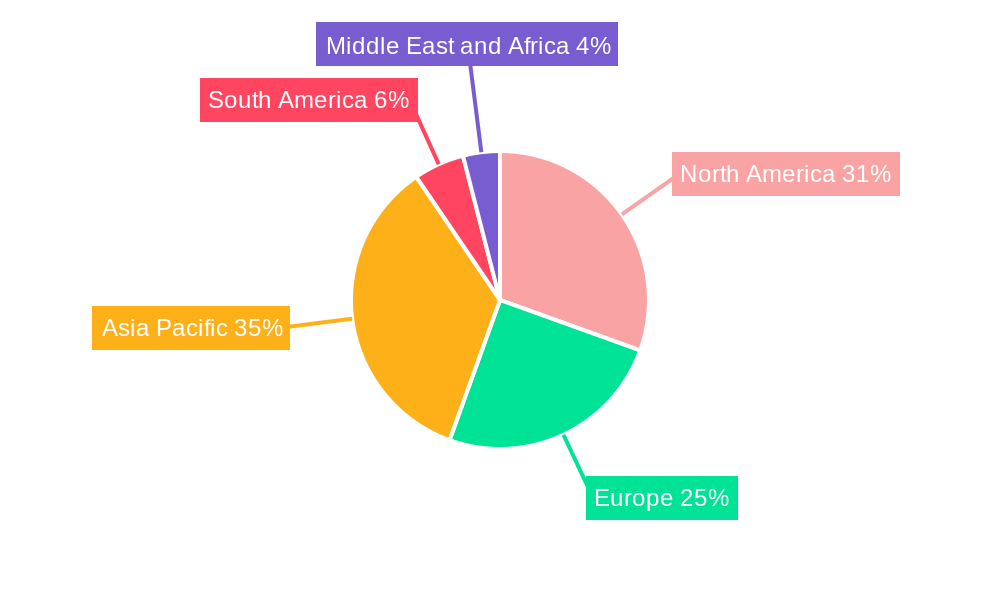
Centrifugal Pumps Industry Regional Market Share
Geographic Coverage of Centrifugal Pumps Industry
Centrifugal Pumps Industry REPORT HIGHLIGHTS
| Aspects | Details |
|---|---|
| Study Period | 2020-2034 |
| Base Year | 2025 |
| Estimated Year | 2026 |
| Forecast Period | 2026-2034 |
| Historical Period | 2020-2025 |
| Growth Rate | CAGR of 5.1% from 2020-2034 |
| Segmentation |
|
Table of Contents
- 1. Introduction
- 1.1. Research Scope
- 1.2. Market Segmentation
- 1.3. Research Objective
- 1.4. Definitions and Assumptions
- 2. Executive Summary
- 2.1. Market Snapshot
- 3. Market Dynamics
- 3.1. Market Drivers
- 3.2. Market Restrains
- 3.3. Market Trends
- 3.4. Market Opportunities
- 4. Market Factor Analysis
- 4.1. Porters Five Forces
- 4.1.1. Bargaining Power of Suppliers
- 4.1.2. Bargaining Power of Buyers
- 4.1.3. Threat of New Entrants
- 4.1.4. Threat of Substitutes
- 4.1.5. Competitive Rivalry
- 4.2. PESTEL analysis
- 4.3. BCG Analysis
- 4.3.1. Stars (High Growth, High Market Share)
- 4.3.2. Cash Cows (Low Growth, High Market Share)
- 4.3.3. Question Mark (High Growth, Low Market Share)
- 4.3.4. Dogs (Low Growth, Low Market Share)
- 4.4. Ansoff Matrix Analysis
- 4.5. Supply Chain Analysis
- 4.6. Regulatory Landscape
- 4.7. Current Market Potential and Opportunity Assessment (TAM–SAM–SOM Framework)
- 4.8. MSR Analyst Note
- 4.1. Porters Five Forces
- 5. Market Analysis, Insights and Forecast 2021-2033
- 5.1. Market Analysis, Insights and Forecast - by Stage
- 5.1.1. Single-stage Pumps
- 5.1.2. Multi-stage Pumps
- 5.2. Market Analysis, Insights and Forecast - by End-User
- 5.2.1. Oil and Gas
- 5.2.2. Power Generation
- 5.2.3. Other End-Users
- 5.3. Market Analysis, Insights and Forecast - by Impeller Type
- 5.3.1. Open
- 5.3.2. Partially Open
- 5.3.3. Enclosed
- 5.4. Market Analysis, Insights and Forecast - by Region
- 5.4.1. North America
- 5.4.2. Europe
- 5.4.3. Asia Pacific
- 5.4.4. South America
- 5.4.5. Middle East and Africa
- 5.1. Market Analysis, Insights and Forecast - by Stage
- 6. Global Centrifugal Pumps Industry Analysis, Insights and Forecast, 2021-2033
- 6.1. Market Analysis, Insights and Forecast - by Stage
- 6.1.1. Single-stage Pumps
- 6.1.2. Multi-stage Pumps
- 6.2. Market Analysis, Insights and Forecast - by End-User
- 6.2.1. Oil and Gas
- 6.2.2. Power Generation
- 6.2.3. Other End-Users
- 6.3. Market Analysis, Insights and Forecast - by Impeller Type
- 6.3.1. Open
- 6.3.2. Partially Open
- 6.3.3. Enclosed
- 6.1. Market Analysis, Insights and Forecast - by Stage
- 7. North America Centrifugal Pumps Industry Analysis, Insights and Forecast, 2020-2032
- 7.1. Market Analysis, Insights and Forecast - by Stage
- 7.1.1. Single-stage Pumps
- 7.1.2. Multi-stage Pumps
- 7.2. Market Analysis, Insights and Forecast - by End-User
- 7.2.1. Oil and Gas
- 7.2.2. Power Generation
- 7.2.3. Other End-Users
- 7.3. Market Analysis, Insights and Forecast - by Impeller Type
- 7.3.1. Open
- 7.3.2. Partially Open
- 7.3.3. Enclosed
- 7.1. Market Analysis, Insights and Forecast - by Stage
- 8. Europe Centrifugal Pumps Industry Analysis, Insights and Forecast, 2020-2032
- 8.1. Market Analysis, Insights and Forecast - by Stage
- 8.1.1. Single-stage Pumps
- 8.1.2. Multi-stage Pumps
- 8.2. Market Analysis, Insights and Forecast - by End-User
- 8.2.1. Oil and Gas
- 8.2.2. Power Generation
- 8.2.3. Other End-Users
- 8.3. Market Analysis, Insights and Forecast - by Impeller Type
- 8.3.1. Open
- 8.3.2. Partially Open
- 8.3.3. Enclosed
- 8.1. Market Analysis, Insights and Forecast - by Stage
- 9. Asia Pacific Centrifugal Pumps Industry Analysis, Insights and Forecast, 2020-2032
- 9.1. Market Analysis, Insights and Forecast - by Stage
- 9.1.1. Single-stage Pumps
- 9.1.2. Multi-stage Pumps
- 9.2. Market Analysis, Insights and Forecast - by End-User
- 9.2.1. Oil and Gas
- 9.2.2. Power Generation
- 9.2.3. Other End-Users
- 9.3. Market Analysis, Insights and Forecast - by Impeller Type
- 9.3.1. Open
- 9.3.2. Partially Open
- 9.3.3. Enclosed
- 9.1. Market Analysis, Insights and Forecast - by Stage
- 10. South America Centrifugal Pumps Industry Analysis, Insights and Forecast, 2020-2032
- 10.1. Market Analysis, Insights and Forecast - by Stage
- 10.1.1. Single-stage Pumps
- 10.1.2. Multi-stage Pumps
- 10.2. Market Analysis, Insights and Forecast - by End-User
- 10.2.1. Oil and Gas
- 10.2.2. Power Generation
- 10.2.3. Other End-Users
- 10.3. Market Analysis, Insights and Forecast - by Impeller Type
- 10.3.1. Open
- 10.3.2. Partially Open
- 10.3.3. Enclosed
- 10.1. Market Analysis, Insights and Forecast - by Stage
- 11. Middle East and Africa Centrifugal Pumps Industry Analysis, Insights and Forecast, 2020-2032
- 11.1. Market Analysis, Insights and Forecast - by Stage
- 11.1.1. Single-stage Pumps
- 11.1.2. Multi-stage Pumps
- 11.2. Market Analysis, Insights and Forecast - by End-User
- 11.2.1. Oil and Gas
- 11.2.2. Power Generation
- 11.2.3. Other End-Users
- 11.3. Market Analysis, Insights and Forecast - by Impeller Type
- 11.3.1. Open
- 11.3.2. Partially Open
- 11.3.3. Enclosed
- 11.1. Market Analysis, Insights and Forecast - by Stage
- 12. Competitive Analysis
- 12.1. Company Profiles
- 12.1.1 Sulzer Ltd
- 12.1.1.1. Company Overview
- 12.1.1.2. Products
- 12.1.1.3. Company Financials
- 12.1.1.4. SWOT Analysis
- 12.1.2 Weir Group PLC*List Not Exhaustive
- 12.1.2.1. Company Overview
- 12.1.2.2. Products
- 12.1.2.3. Company Financials
- 12.1.2.4. SWOT Analysis
- 12.1.3 Ebara Corporation
- 12.1.3.1. Company Overview
- 12.1.3.2. Products
- 12.1.3.3. Company Financials
- 12.1.3.4. SWOT Analysis
- 12.1.4 Flowserve Corporation
- 12.1.4.1. Company Overview
- 12.1.4.2. Products
- 12.1.4.3. Company Financials
- 12.1.4.4. SWOT Analysis
- 12.1.5 Ruhrpumpen Group
- 12.1.5.1. Company Overview
- 12.1.5.2. Products
- 12.1.5.3. Company Financials
- 12.1.5.4. SWOT Analysis
- 12.1.6 Schlumberger Ltd
- 12.1.6.1. Company Overview
- 12.1.6.2. Products
- 12.1.6.3. Company Financials
- 12.1.6.4. SWOT Analysis
- 12.1.7 KSB SE & Co KGaA
- 12.1.7.1. Company Overview
- 12.1.7.2. Products
- 12.1.7.3. Company Financials
- 12.1.7.4. SWOT Analysis
- 12.1.8 ITT Inc
- 12.1.8.1. Company Overview
- 12.1.8.2. Products
- 12.1.8.3. Company Financials
- 12.1.8.4. SWOT Analysis
- 12.1.9 Dover Corporation
- 12.1.9.1. Company Overview
- 12.1.9.2. Products
- 12.1.9.3. Company Financials
- 12.1.9.4. SWOT Analysis
- 12.1.10 Baker Hughes Company
- 12.1.10.1. Company Overview
- 12.1.10.2. Products
- 12.1.10.3. Company Financials
- 12.1.10.4. SWOT Analysis
- 12.1.1 Sulzer Ltd
- 12.2. Market Entropy
- 12.2.1 Company's Key Areas Served
- 12.2.2 Recent Developments
- 12.3. Company Market Share Analysis 2025
- 12.3.1 Top 5 Companies Market Share Analysis
- 12.3.2 Top 3 Companies Market Share Analysis
- 12.4. List of Potential Customers
- 13. Research Methodology
List of Figures
- Figure 1: Global Centrifugal Pumps Industry Revenue Breakdown (billion, %) by Region 2025 & 2033
- Figure 2: Global Centrifugal Pumps Industry Volume Breakdown (K Units, %) by Region 2025 & 2033
- Figure 3: North America Centrifugal Pumps Industry Revenue (billion), by Stage 2025 & 2033
- Figure 4: North America Centrifugal Pumps Industry Volume (K Units), by Stage 2025 & 2033
- Figure 5: North America Centrifugal Pumps Industry Revenue Share (%), by Stage 2025 & 2033
- Figure 6: North America Centrifugal Pumps Industry Volume Share (%), by Stage 2025 & 2033
- Figure 7: North America Centrifugal Pumps Industry Revenue (billion), by End-User 2025 & 2033
- Figure 8: North America Centrifugal Pumps Industry Volume (K Units), by End-User 2025 & 2033
- Figure 9: North America Centrifugal Pumps Industry Revenue Share (%), by End-User 2025 & 2033
- Figure 10: North America Centrifugal Pumps Industry Volume Share (%), by End-User 2025 & 2033
- Figure 11: North America Centrifugal Pumps Industry Revenue (billion), by Impeller Type 2025 & 2033
- Figure 12: North America Centrifugal Pumps Industry Volume (K Units), by Impeller Type 2025 & 2033
- Figure 13: North America Centrifugal Pumps Industry Revenue Share (%), by Impeller Type 2025 & 2033
- Figure 14: North America Centrifugal Pumps Industry Volume Share (%), by Impeller Type 2025 & 2033
- Figure 15: North America Centrifugal Pumps Industry Revenue (billion), by Country 2025 & 2033
- Figure 16: North America Centrifugal Pumps Industry Volume (K Units), by Country 2025 & 2033
- Figure 17: North America Centrifugal Pumps Industry Revenue Share (%), by Country 2025 & 2033
- Figure 18: North America Centrifugal Pumps Industry Volume Share (%), by Country 2025 & 2033
- Figure 19: Europe Centrifugal Pumps Industry Revenue (billion), by Stage 2025 & 2033
- Figure 20: Europe Centrifugal Pumps Industry Volume (K Units), by Stage 2025 & 2033
- Figure 21: Europe Centrifugal Pumps Industry Revenue Share (%), by Stage 2025 & 2033
- Figure 22: Europe Centrifugal Pumps Industry Volume Share (%), by Stage 2025 & 2033
- Figure 23: Europe Centrifugal Pumps Industry Revenue (billion), by End-User 2025 & 2033
- Figure 24: Europe Centrifugal Pumps Industry Volume (K Units), by End-User 2025 & 2033
- Figure 25: Europe Centrifugal Pumps Industry Revenue Share (%), by End-User 2025 & 2033
- Figure 26: Europe Centrifugal Pumps Industry Volume Share (%), by End-User 2025 & 2033
- Figure 27: Europe Centrifugal Pumps Industry Revenue (billion), by Impeller Type 2025 & 2033
- Figure 28: Europe Centrifugal Pumps Industry Volume (K Units), by Impeller Type 2025 & 2033
- Figure 29: Europe Centrifugal Pumps Industry Revenue Share (%), by Impeller Type 2025 & 2033
- Figure 30: Europe Centrifugal Pumps Industry Volume Share (%), by Impeller Type 2025 & 2033
- Figure 31: Europe Centrifugal Pumps Industry Revenue (billion), by Country 2025 & 2033
- Figure 32: Europe Centrifugal Pumps Industry Volume (K Units), by Country 2025 & 2033
- Figure 33: Europe Centrifugal Pumps Industry Revenue Share (%), by Country 2025 & 2033
- Figure 34: Europe Centrifugal Pumps Industry Volume Share (%), by Country 2025 & 2033
- Figure 35: Asia Pacific Centrifugal Pumps Industry Revenue (billion), by Stage 2025 & 2033
- Figure 36: Asia Pacific Centrifugal Pumps Industry Volume (K Units), by Stage 2025 & 2033
- Figure 37: Asia Pacific Centrifugal Pumps Industry Revenue Share (%), by Stage 2025 & 2033
- Figure 38: Asia Pacific Centrifugal Pumps Industry Volume Share (%), by Stage 2025 & 2033
- Figure 39: Asia Pacific Centrifugal Pumps Industry Revenue (billion), by End-User 2025 & 2033
- Figure 40: Asia Pacific Centrifugal Pumps Industry Volume (K Units), by End-User 2025 & 2033
- Figure 41: Asia Pacific Centrifugal Pumps Industry Revenue Share (%), by End-User 2025 & 2033
- Figure 42: Asia Pacific Centrifugal Pumps Industry Volume Share (%), by End-User 2025 & 2033
- Figure 43: Asia Pacific Centrifugal Pumps Industry Revenue (billion), by Impeller Type 2025 & 2033
- Figure 44: Asia Pacific Centrifugal Pumps Industry Volume (K Units), by Impeller Type 2025 & 2033
- Figure 45: Asia Pacific Centrifugal Pumps Industry Revenue Share (%), by Impeller Type 2025 & 2033
- Figure 46: Asia Pacific Centrifugal Pumps Industry Volume Share (%), by Impeller Type 2025 & 2033
- Figure 47: Asia Pacific Centrifugal Pumps Industry Revenue (billion), by Country 2025 & 2033
- Figure 48: Asia Pacific Centrifugal Pumps Industry Volume (K Units), by Country 2025 & 2033
- Figure 49: Asia Pacific Centrifugal Pumps Industry Revenue Share (%), by Country 2025 & 2033
- Figure 50: Asia Pacific Centrifugal Pumps Industry Volume Share (%), by Country 2025 & 2033
- Figure 51: South America Centrifugal Pumps Industry Revenue (billion), by Stage 2025 & 2033
- Figure 52: South America Centrifugal Pumps Industry Volume (K Units), by Stage 2025 & 2033
- Figure 53: South America Centrifugal Pumps Industry Revenue Share (%), by Stage 2025 & 2033
- Figure 54: South America Centrifugal Pumps Industry Volume Share (%), by Stage 2025 & 2033
- Figure 55: South America Centrifugal Pumps Industry Revenue (billion), by End-User 2025 & 2033
- Figure 56: South America Centrifugal Pumps Industry Volume (K Units), by End-User 2025 & 2033
- Figure 57: South America Centrifugal Pumps Industry Revenue Share (%), by End-User 2025 & 2033
- Figure 58: South America Centrifugal Pumps Industry Volume Share (%), by End-User 2025 & 2033
- Figure 59: South America Centrifugal Pumps Industry Revenue (billion), by Impeller Type 2025 & 2033
- Figure 60: South America Centrifugal Pumps Industry Volume (K Units), by Impeller Type 2025 & 2033
- Figure 61: South America Centrifugal Pumps Industry Revenue Share (%), by Impeller Type 2025 & 2033
- Figure 62: South America Centrifugal Pumps Industry Volume Share (%), by Impeller Type 2025 & 2033
- Figure 63: South America Centrifugal Pumps Industry Revenue (billion), by Country 2025 & 2033
- Figure 64: South America Centrifugal Pumps Industry Volume (K Units), by Country 2025 & 2033
- Figure 65: South America Centrifugal Pumps Industry Revenue Share (%), by Country 2025 & 2033
- Figure 66: South America Centrifugal Pumps Industry Volume Share (%), by Country 2025 & 2033
- Figure 67: Middle East and Africa Centrifugal Pumps Industry Revenue (billion), by Stage 2025 & 2033
- Figure 68: Middle East and Africa Centrifugal Pumps Industry Volume (K Units), by Stage 2025 & 2033
- Figure 69: Middle East and Africa Centrifugal Pumps Industry Revenue Share (%), by Stage 2025 & 2033
- Figure 70: Middle East and Africa Centrifugal Pumps Industry Volume Share (%), by Stage 2025 & 2033
- Figure 71: Middle East and Africa Centrifugal Pumps Industry Revenue (billion), by End-User 2025 & 2033
- Figure 72: Middle East and Africa Centrifugal Pumps Industry Volume (K Units), by End-User 2025 & 2033
- Figure 73: Middle East and Africa Centrifugal Pumps Industry Revenue Share (%), by End-User 2025 & 2033
- Figure 74: Middle East and Africa Centrifugal Pumps Industry Volume Share (%), by End-User 2025 & 2033
- Figure 75: Middle East and Africa Centrifugal Pumps Industry Revenue (billion), by Impeller Type 2025 & 2033
- Figure 76: Middle East and Africa Centrifugal Pumps Industry Volume (K Units), by Impeller Type 2025 & 2033
- Figure 77: Middle East and Africa Centrifugal Pumps Industry Revenue Share (%), by Impeller Type 2025 & 2033
- Figure 78: Middle East and Africa Centrifugal Pumps Industry Volume Share (%), by Impeller Type 2025 & 2033
- Figure 79: Middle East and Africa Centrifugal Pumps Industry Revenue (billion), by Country 2025 & 2033
- Figure 80: Middle East and Africa Centrifugal Pumps Industry Volume (K Units), by Country 2025 & 2033
- Figure 81: Middle East and Africa Centrifugal Pumps Industry Revenue Share (%), by Country 2025 & 2033
- Figure 82: Middle East and Africa Centrifugal Pumps Industry Volume Share (%), by Country 2025 & 2033
List of Tables
- Table 1: Global Centrifugal Pumps Industry Revenue billion Forecast, by Stage 2020 & 2033
- Table 2: Global Centrifugal Pumps Industry Volume K Units Forecast, by Stage 2020 & 2033
- Table 3: Global Centrifugal Pumps Industry Revenue billion Forecast, by End-User 2020 & 2033
- Table 4: Global Centrifugal Pumps Industry Volume K Units Forecast, by End-User 2020 & 2033
- Table 5: Global Centrifugal Pumps Industry Revenue billion Forecast, by Impeller Type 2020 & 2033
- Table 6: Global Centrifugal Pumps Industry Volume K Units Forecast, by Impeller Type 2020 & 2033
- Table 7: Global Centrifugal Pumps Industry Revenue billion Forecast, by Region 2020 & 2033
- Table 8: Global Centrifugal Pumps Industry Volume K Units Forecast, by Region 2020 & 2033
- Table 9: Global Centrifugal Pumps Industry Revenue billion Forecast, by Stage 2020 & 2033
- Table 10: Global Centrifugal Pumps Industry Volume K Units Forecast, by Stage 2020 & 2033
- Table 11: Global Centrifugal Pumps Industry Revenue billion Forecast, by End-User 2020 & 2033
- Table 12: Global Centrifugal Pumps Industry Volume K Units Forecast, by End-User 2020 & 2033
- Table 13: Global Centrifugal Pumps Industry Revenue billion Forecast, by Impeller Type 2020 & 2033
- Table 14: Global Centrifugal Pumps Industry Volume K Units Forecast, by Impeller Type 2020 & 2033
- Table 15: Global Centrifugal Pumps Industry Revenue billion Forecast, by Country 2020 & 2033
- Table 16: Global Centrifugal Pumps Industry Volume K Units Forecast, by Country 2020 & 2033
- Table 17: Global Centrifugal Pumps Industry Revenue billion Forecast, by Stage 2020 & 2033
- Table 18: Global Centrifugal Pumps Industry Volume K Units Forecast, by Stage 2020 & 2033
- Table 19: Global Centrifugal Pumps Industry Revenue billion Forecast, by End-User 2020 & 2033
- Table 20: Global Centrifugal Pumps Industry Volume K Units Forecast, by End-User 2020 & 2033
- Table 21: Global Centrifugal Pumps Industry Revenue billion Forecast, by Impeller Type 2020 & 2033
- Table 22: Global Centrifugal Pumps Industry Volume K Units Forecast, by Impeller Type 2020 & 2033
- Table 23: Global Centrifugal Pumps Industry Revenue billion Forecast, by Country 2020 & 2033
- Table 24: Global Centrifugal Pumps Industry Volume K Units Forecast, by Country 2020 & 2033
- Table 25: Global Centrifugal Pumps Industry Revenue billion Forecast, by Stage 2020 & 2033
- Table 26: Global Centrifugal Pumps Industry Volume K Units Forecast, by Stage 2020 & 2033
- Table 27: Global Centrifugal Pumps Industry Revenue billion Forecast, by End-User 2020 & 2033
- Table 28: Global Centrifugal Pumps Industry Volume K Units Forecast, by End-User 2020 & 2033
- Table 29: Global Centrifugal Pumps Industry Revenue billion Forecast, by Impeller Type 2020 & 2033
- Table 30: Global Centrifugal Pumps Industry Volume K Units Forecast, by Impeller Type 2020 & 2033
- Table 31: Global Centrifugal Pumps Industry Revenue billion Forecast, by Country 2020 & 2033
- Table 32: Global Centrifugal Pumps Industry Volume K Units Forecast, by Country 2020 & 2033
- Table 33: Global Centrifugal Pumps Industry Revenue billion Forecast, by Stage 2020 & 2033
- Table 34: Global Centrifugal Pumps Industry Volume K Units Forecast, by Stage 2020 & 2033
- Table 35: Global Centrifugal Pumps Industry Revenue billion Forecast, by End-User 2020 & 2033
- Table 36: Global Centrifugal Pumps Industry Volume K Units Forecast, by End-User 2020 & 2033
- Table 37: Global Centrifugal Pumps Industry Revenue billion Forecast, by Impeller Type 2020 & 2033
- Table 38: Global Centrifugal Pumps Industry Volume K Units Forecast, by Impeller Type 2020 & 2033
- Table 39: Global Centrifugal Pumps Industry Revenue billion Forecast, by Country 2020 & 2033
- Table 40: Global Centrifugal Pumps Industry Volume K Units Forecast, by Country 2020 & 2033
- Table 41: Global Centrifugal Pumps Industry Revenue billion Forecast, by Stage 2020 & 2033
- Table 42: Global Centrifugal Pumps Industry Volume K Units Forecast, by Stage 2020 & 2033
- Table 43: Global Centrifugal Pumps Industry Revenue billion Forecast, by End-User 2020 & 2033
- Table 44: Global Centrifugal Pumps Industry Volume K Units Forecast, by End-User 2020 & 2033
- Table 45: Global Centrifugal Pumps Industry Revenue billion Forecast, by Impeller Type 2020 & 2033
- Table 46: Global Centrifugal Pumps Industry Volume K Units Forecast, by Impeller Type 2020 & 2033
- Table 47: Global Centrifugal Pumps Industry Revenue billion Forecast, by Country 2020 & 2033
- Table 48: Global Centrifugal Pumps Industry Volume K Units Forecast, by Country 2020 & 2033
Frequently Asked Questions
1. What is the projected Compound Annual Growth Rate (CAGR) of the Centrifugal Pumps Industry?
The projected CAGR is approximately 5.1%.
2. Which companies are prominent players in the Centrifugal Pumps Industry?
Key companies in the market include Sulzer Ltd, Weir Group PLC*List Not Exhaustive, Ebara Corporation, Flowserve Corporation, Ruhrpumpen Group, Schlumberger Ltd, KSB SE & Co KGaA, ITT Inc, Dover Corporation, Baker Hughes Company.
3. What are the main segments of the Centrifugal Pumps Industry?
The market segments include Stage, End-User, Impeller Type.
4. Can you provide details about the market size?
The market size is estimated to be USD 33.7 billion as of 2022.
5. What are some drivers contributing to market growth?
Growing demand for natural gas and developing gas infrastructure and increasing offshore oil and Gas Exploration Activities.
6. What are the notable trends driving market growth?
Oil and Gas Segment to Dominate the Market.
7. Are there any restraints impacting market growth?
Adoption of Cleaner Alternatives.
8. Can you provide examples of recent developments in the market?
April 2022: GSD held an internal product launch of the ISH/ISP high-efficiency centrifugal pump. ISH/ISP high-efficiency centrifugal pump can be equipped with sensors at the reserved position in the design to realize the real-time monitoring, predictive alarm, fault analysis, energy efficiency analysis and operation state optimization of the equipment by matching with the GSD intelligent IOT system.
9. What pricing options are available for accessing the report?
Pricing options include single-user, multi-user, and enterprise licenses priced at USD 4750, USD 5250, and USD 8750 respectively.
10. Is the market size provided in terms of value or volume?
The market size is provided in terms of value, measured in billion and volume, measured in K Units.
11. Are there any specific market keywords associated with the report?
Yes, the market keyword associated with the report is "Centrifugal Pumps Industry," which aids in identifying and referencing the specific market segment covered.
12. How do I determine which pricing option suits my needs best?
The pricing options vary based on user requirements and access needs. Individual users may opt for single-user licenses, while businesses requiring broader access may choose multi-user or enterprise licenses for cost-effective access to the report.
13. Are there any additional resources or data provided in the Centrifugal Pumps Industry report?
While the report offers comprehensive insights, it's advisable to review the specific contents or supplementary materials provided to ascertain if additional resources or data are available.
14. How can I stay updated on further developments or reports in the Centrifugal Pumps Industry?
To stay informed about further developments, trends, and reports in the Centrifugal Pumps Industry, consider subscribing to industry newsletters, following relevant companies and organizations, or regularly checking reputable industry news sources and publications.
Methodology
Step 1 - Identification of Relevant Samples Size from Population Database


Step 2 - Approaches for Defining Global Market Size (Value, Volume* & Price*)

Note*: In applicable scenarios
Step 3 - Data Sources
Primary Research
- Web Analytics
- Survey Reports
- Research Institute
- Latest Research Reports
- Opinion Leaders
Secondary Research
- Annual Reports
- White Paper
- Latest Press Release
- Industry Association
- Paid Database
- Investor Presentations

Step 4 - Data Triangulation
Involves using different sources of information in order to increase the validity of a study
These sources are likely to be stakeholders in a program - participants, other researchers, program staff, other community members, and so on.
Then we put all data in single framework & apply various statistical tools to find out the dynamic on the market.
During the analysis stage, feedback from the stakeholder groups would be compared to determine areas of agreement as well as areas of divergence