

Key Insights
The global Power Distribution Cables market is projected to reach $232.28 billion by 2025, exhibiting a robust Compound Annual Growth Rate (CAGR) of 6.8% from 2025 to 2033. This growth is driven by escalating global electricity demand, urbanization, industrial expansion, and the widespread adoption of renewable energy. Significant investments in grid modernization, network expansion to underserved regions, and the integration of smart grid technologies are key market drivers. The electrification of transportation, particularly the growth of electric vehicle charging infrastructure, will further necessitate advanced power distribution cable deployment.
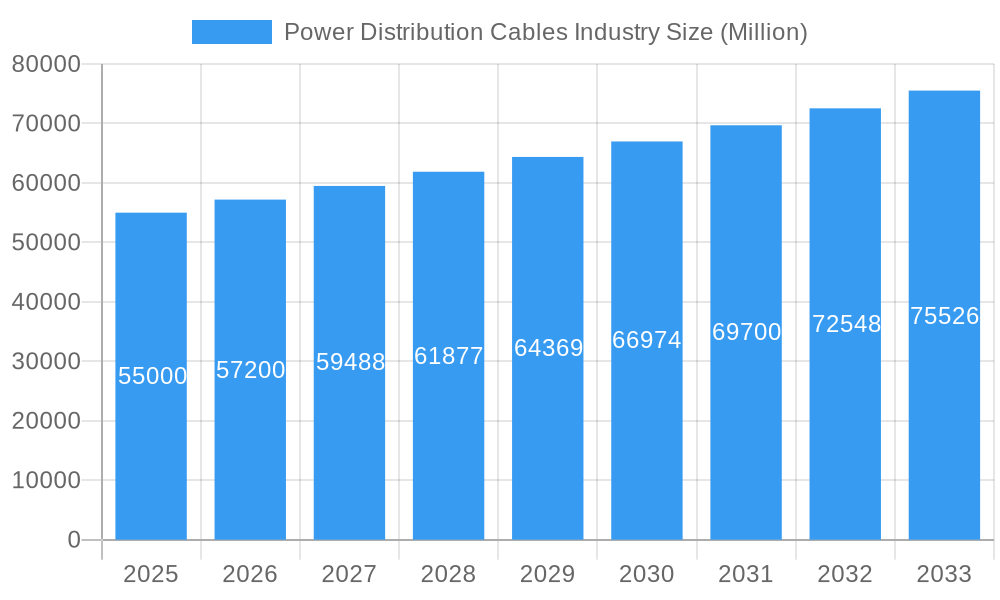
Power Distribution Cables Industry Market Size (In Billion)
The market is segmented by voltage level (Low, Medium, High) and deployment location (Overhead, Underground, Submarine). Underground and submarine cables are increasingly favored for their aesthetic advantages, enhanced safety, and resilience to weather disruptions, especially in urban areas and offshore energy projects. Leading industry players, including Nexans SA, Sumitomo Electric Industries Limited, and Prysmian SpA, are focusing on R&D, product innovation, and market expansion. While fluctuating raw material prices and stringent environmental regulations pose challenges, the outlook for the power distribution cables market remains highly positive due to their indispensable role in global energy infrastructure.
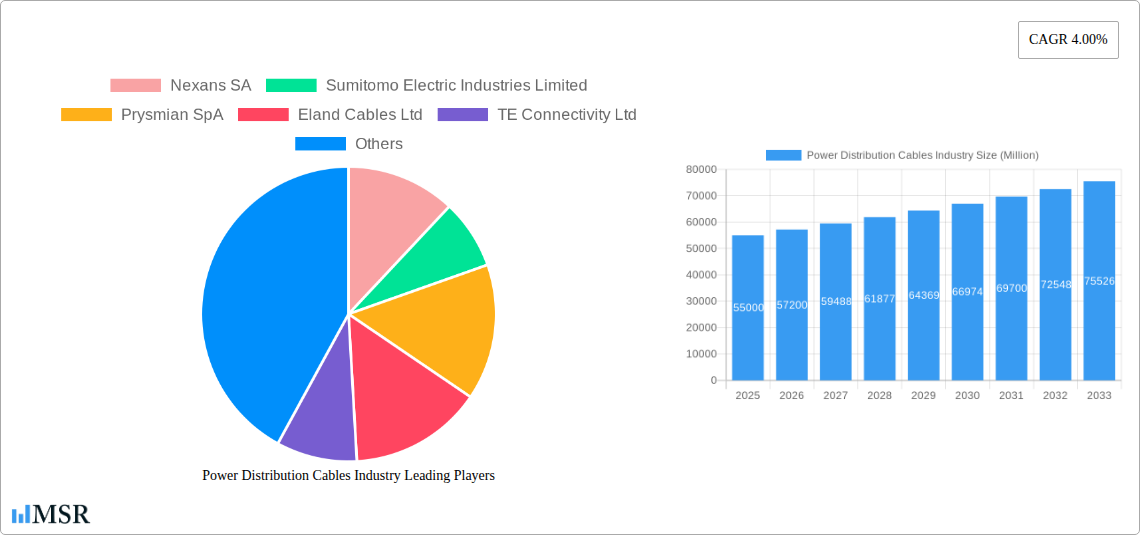
Power Distribution Cables Industry Company Market Share
Power Distribution Cables Industry Market Concentration & Dynamics
The Power Distribution Cables Industry exhibits moderate to high market concentration, with leading global manufacturers dominating a significant portion of the market share. The innovation ecosystem is driven by continuous R&D in materials science, insulation technologies, and enhanced transmission efficiency for both AC and DC applications. Regulatory frameworks, particularly those surrounding grid modernization, renewable energy integration, and safety standards, play a crucial role in shaping market dynamics. The threat of substitute products is minimal, as power distribution cables are indispensable for energy transmission. End-user trends are increasingly focused on sustainability, grid resilience, and the deployment of smart grid technologies, fueling demand for advanced cable solutions. Mergers and acquisitions (M&A) activities are strategic, aimed at expanding geographical reach, acquiring specialized technologies, and consolidating market positions. For instance, recent M&A deals have targeted companies with expertise in offshore wind farm cable solutions and undergrounding infrastructure. The number of significant M&A deals in the past five years is estimated to be around 40, with an average deal value exceeding 100 Million. Key players like Prysmian SpA and Nexans SA have been actively involved in consolidating their global presence through strategic acquisitions.
Power Distribution Cables Industry Industry Insights & Trends
The global Power Distribution Cables Industry is poised for significant growth, projected to reach an estimated market size of 150,000 Million by 2033, exhibiting a compound annual growth rate (CAGR) of approximately 5.5% during the forecast period (2025–2033). This robust growth is propelled by escalating global electricity demand, driven by industrial expansion, urbanization, and the increasing adoption of electric vehicles. Technological disruptions are central to this evolution, with a notable surge in the demand for high-voltage AC power cables and HVDC cable systems to facilitate efficient long-distance power transmission and integration of renewable energy sources. The development of advanced insulation materials, such as XLPE (cross-linked polyethylene), and innovative cable designs are enhancing performance, durability, and safety. Evolving consumer behaviors are characterized by a growing preference for sustainable energy solutions and a demand for reliable and resilient power grids. This is translating into increased investments in grid modernization projects, including the undergrounding of power lines to improve aesthetics and reduce vulnerability to extreme weather events. The increasing focus on offshore wind farms further accentuates the need for specialized submarine power cables. Market participants are observing a clear trend towards higher voltage capacity cables to meet the growing energy needs of developing economies and to support the expansion of international power grids. The base year (2025) shows a market size of approximately 105,000 Million, with substantial growth anticipated.
Key Markets & Segments Leading Power Distribution Cables Industry
The Power Distribution Cables Industry is experiencing dynamic shifts across its key segments and geographical markets. The High Voltage Level segment is a dominant force, driven by the global imperative to transmit large volumes of electricity efficiently over long distances, crucial for connecting remote renewable energy sources and powering expanding urban centers. The increasing investment in offshore wind farms, requiring specialized submarine power cables, is a significant contributor to the growth of this segment.
- Drivers for High Voltage Segment Dominance:
- Renewable Energy Integration: The proliferation of offshore wind and large-scale solar farms necessitates robust high-voltage AC power cables and HVDC cable systems for efficient grid integration.
- Grid Modernization Projects: Governments worldwide are investing heavily in upgrading aging grid infrastructure, with a focus on higher capacity and more resilient transmission solutions.
- Intercontinental Power Connectivity: The development of cross-border power transmission networks further bolsters the demand for high-voltage and submarine power cables.
The Underground Deployment location is also a rapidly growing segment. This surge is attributed to increasing urbanization, a growing emphasis on grid reliability and resilience against weather-related outages, and aesthetic considerations in densely populated areas.
- Drivers for Underground Deployment Growth:
- Urbanization and Infrastructure Development: As cities expand, undergrounding power lines becomes essential for managing space and ensuring continuous power supply.
- Resilience Against Extreme Weather: The increasing frequency and intensity of extreme weather events make underground cables a more reliable option, reducing downtime and repair costs.
- Public Safety and Aesthetics: Minimizing overhead power lines improves urban aesthetics and reduces risks associated with falling poles or damaged wires.
Geographically, regions with significant investments in renewable energy infrastructure, such as Europe and North America, are leading the market. Asia Pacific, with its rapidly expanding industrial base and growing population, presents substantial growth opportunities for all segments of the Power Distribution Cables Industry, particularly for Medium Voltage and Low Voltage cables supporting industrial and residential expansion. The Submarine segment is experiencing exceptional growth driven by offshore wind energy development in the North Sea and other coastal regions globally.
Power Distribution Cables Industry Product Developments
Product development in the Power Distribution Cables Industry is heavily focused on enhancing efficiency, durability, and sustainability. Innovations include advanced insulation materials that allow for higher operating temperatures and increased current carrying capacity, enabling more compact and cost-effective cable designs. The development of self-healing insulation, enhanced fire-retardant properties, and improved resistance to environmental factors like moisture and UV radiation are key areas of focus. Furthermore, the integration of sensing technologies within cables for real-time monitoring of performance and potential issues is gaining traction, contributing to predictive maintenance and enhanced grid reliability. The market relevance of these developments lies in their ability to support the evolving needs of the energy sector, from massive offshore wind farms requiring specialized submarine power cables to urban environments demanding efficient and reliable underground solutions. These advancements are crucial for meeting the increasing energy demands and the transition towards a greener energy future.
Challenges in the Power Distribution Cables Industry Market
Despite robust growth, the Power Distribution Cables Industry faces several challenges. Volatile raw material prices, particularly for copper and aluminum, can significantly impact manufacturing costs and profitability, with price fluctuations often exceeding 10% annually. Stringent environmental regulations regarding manufacturing processes and the disposal of old cables add complexity and cost. The lengthy lead times for specialized cable orders, sometimes exceeding 12 months for complex projects, can strain project timelines and require careful inventory management. Furthermore, intense competition among a growing number of manufacturers, particularly in emerging markets, can lead to price pressures, especially for standard cable types. Supply chain disruptions, as seen during global health crises or geopolitical events, can impact the availability of key components and raw materials, leading to production delays.
Forces Driving Power Distribution Cables Industry Growth
Several powerful forces are driving the expansion of the Power Distribution Cables Industry. The global transition towards renewable energy sources like wind and solar is a primary catalyst, necessitating extensive high-voltage AC power cables and HVDC cable systems for grid integration, particularly for offshore wind farms requiring submarine power cables. Ongoing infrastructure development and modernization projects worldwide, aimed at enhancing grid reliability and capacity, are fueling demand for both overhead and underground cable solutions. The increasing electrification of transportation, with the proliferation of electric vehicles, is creating new demand for charging infrastructure and grid upgrades. Furthermore, supportive government policies and incentives for clean energy adoption and grid modernization are providing a significant impetus for market growth.
Challenges in the Power Distribution Cables Industry Market
Long-term growth catalysts for the Power Distribution Cables Industry are deeply intertwined with global energy trends. The accelerating decarbonization efforts worldwide are creating sustained demand for transmission infrastructure to connect new renewable energy generation sites. Innovations in high-capacity HVDC cable systems will be crucial for enabling large-scale energy transfer across vast distances and continents. The increasing focus on smart grids and distributed energy resources will also drive the need for advanced cabling solutions that can accommodate bidirectional power flow and facilitate sophisticated grid management. Partnerships between cable manufacturers, utility companies, and technology providers will be essential for developing and deploying these cutting-edge solutions. Market expansions into developing economies with growing energy needs and significant infrastructure deficits represent another key long-term growth avenue.
Emerging Opportunities in Power Distribution Cables Industry
Emerging opportunities in the Power Distribution Cables Industry are abundant and diverse. The rapid expansion of offshore wind energy projects globally, particularly in Europe and Asia, presents a substantial market for submarine power cables. The growing adoption of electric vehicle charging infrastructure, both in residential and public spaces, is creating new avenues for underground and low-voltage cable installations. The development of advanced grid technologies, such as microgrids and decentralized energy systems, will require specialized and flexible cabling solutions. Furthermore, opportunities exist in the development of cables with enhanced environmental footprints, utilizing recycled materials and designed for greater recyclability. The increasing demand for energy storage solutions also indirectly drives the need for robust power distribution infrastructure.
Leading Players in the Power Distribution Cables Industry Sector
- Nexans SA
- Sumitomo Electric Industries Limited
- Prysmian SpA
- Eland Cables Ltd
- TE Connectivity Ltd
- NKT A/S
- Brugg Kabel AG
- ABB Limited
Key Milestones in Power Distribution Cables Industry Industry
- December 2022: NKT was awarded a turnkey cable system contract for the electrification of the North of Alvheim (NOA) and Krafla offshore fields in the North Sea's NOAKA area. More than 255 kilometers of 145kV high-voltage AC power cables will be designed, manufactured, and installed by the cable-laying vessel NKT Victoria. This project highlights the growing importance of specialized offshore submarine power cables and the capabilities of leading manufacturers in executing complex energy infrastructure projects.
- February 2022: Sumitomo Electric Industries, Ltd. was granted a Limited Notice to Proceed (LNTP) by Samsung C&T Corporation to supply a direct High-Voltage Current (HVDC) cable to Abu Dhabi National Oil Company (ADNOC) in the United Arab Emirates (UAE). The project is worth approximately USD 200 million, and system operations are planned to begin in 2025. This milestone underscores the increasing demand for advanced HVDC cable systems in critical energy infrastructure projects, especially in regions with growing energy demands.
Strategic Outlook for Power Distribution Cables Industry Market
The strategic outlook for the Power Distribution Cables Industry is exceptionally positive, driven by a confluence of global megatrends. Continued investments in renewable energy integration, grid modernization, and the electrification of key sectors will sustain robust demand for high-voltage AC power cables, HVDC cable systems, and specialized submarine power cables. Opportunities for growth lie in expanding geographical reach into emerging markets, developing innovative cable solutions with enhanced sustainability features, and forging strategic partnerships with key stakeholders in the energy value chain. The industry's ability to adapt to evolving technological landscapes and regulatory environments will be crucial for maximizing future market potential and securing a leading position in the global energy transition.
Power Distribution Cables Industry Segmentation
-
1. Voltage Level
- 1.1. Low
- 1.2. Medium
- 1.3. High
-
2. Location of Deployment
- 2.1. Overhead
- 2.2. Underground
- 2.3. Submarine
Power Distribution Cables Industry Segmentation By Geography
- 1. North America
- 2. Europe
- 3. Asia Pacific
- 4. South America
- 5. Middle East and Africa
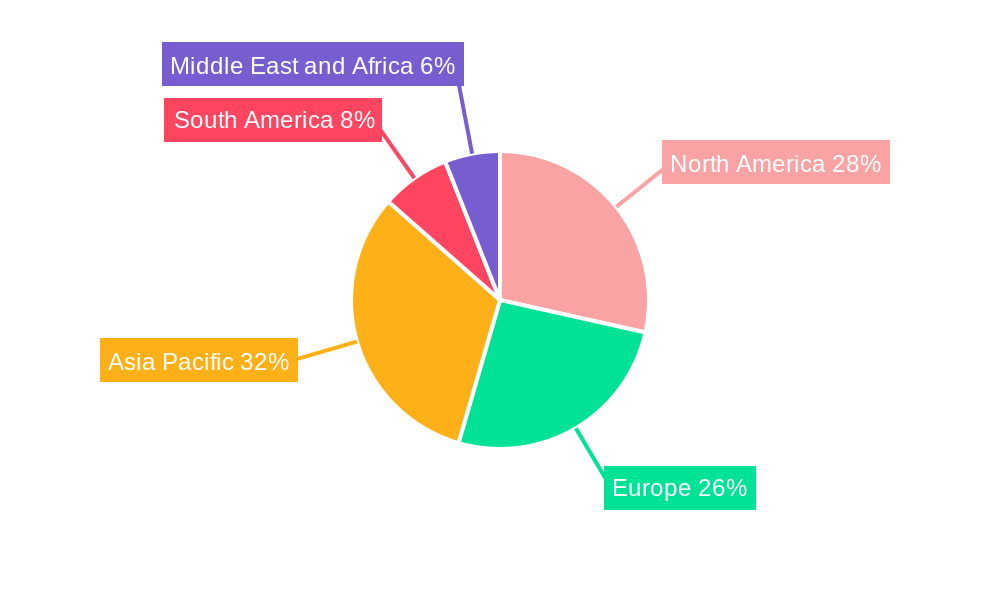
Power Distribution Cables Industry Regional Market Share
Geographic Coverage of Power Distribution Cables Industry
Power Distribution Cables Industry REPORT HIGHLIGHTS
| Aspects | Details |
|---|---|
| Study Period | 2020-2034 |
| Base Year | 2025 |
| Estimated Year | 2026 |
| Forecast Period | 2026-2034 |
| Historical Period | 2020-2025 |
| Growth Rate | CAGR of 6.8% from 2020-2034 |
| Segmentation |
|
Table of Contents
- 1. Introduction
- 1.1. Research Scope
- 1.2. Market Segmentation
- 1.3. Research Objective
- 1.4. Definitions and Assumptions
- 2. Executive Summary
- 2.1. Market Snapshot
- 3. Market Dynamics
- 3.1. Market Drivers
- 3.2. Market Restrains
- 3.3. Market Trends
- 3.4. Market Opportunities
- 4. Market Factor Analysis
- 4.1. Porters Five Forces
- 4.1.1. Bargaining Power of Suppliers
- 4.1.2. Bargaining Power of Buyers
- 4.1.3. Threat of New Entrants
- 4.1.4. Threat of Substitutes
- 4.1.5. Competitive Rivalry
- 4.2. PESTEL analysis
- 4.3. BCG Analysis
- 4.3.1. Stars (High Growth, High Market Share)
- 4.3.2. Cash Cows (Low Growth, High Market Share)
- 4.3.3. Question Mark (High Growth, Low Market Share)
- 4.3.4. Dogs (Low Growth, Low Market Share)
- 4.4. Ansoff Matrix Analysis
- 4.5. Supply Chain Analysis
- 4.6. Regulatory Landscape
- 4.7. Current Market Potential and Opportunity Assessment (TAM–SAM–SOM Framework)
- 4.8. MSR Analyst Note
- 4.1. Porters Five Forces
- 5. Market Analysis, Insights and Forecast 2021-2033
- 5.1. Market Analysis, Insights and Forecast - by Voltage Level
- 5.1.1. Low
- 5.1.2. Medium
- 5.1.3. High
- 5.2. Market Analysis, Insights and Forecast - by Location of Deployment
- 5.2.1. Overhead
- 5.2.2. Underground
- 5.2.3. Submarine
- 5.3. Market Analysis, Insights and Forecast - by Region
- 5.3.1. North America
- 5.3.2. Europe
- 5.3.3. Asia Pacific
- 5.3.4. South America
- 5.3.5. Middle East and Africa
- 5.1. Market Analysis, Insights and Forecast - by Voltage Level
- 6. Global Power Distribution Cables Industry Analysis, Insights and Forecast, 2021-2033
- 6.1. Market Analysis, Insights and Forecast - by Voltage Level
- 6.1.1. Low
- 6.1.2. Medium
- 6.1.3. High
- 6.2. Market Analysis, Insights and Forecast - by Location of Deployment
- 6.2.1. Overhead
- 6.2.2. Underground
- 6.2.3. Submarine
- 6.1. Market Analysis, Insights and Forecast - by Voltage Level
- 7. North America Power Distribution Cables Industry Analysis, Insights and Forecast, 2020-2032
- 7.1. Market Analysis, Insights and Forecast - by Voltage Level
- 7.1.1. Low
- 7.1.2. Medium
- 7.1.3. High
- 7.2. Market Analysis, Insights and Forecast - by Location of Deployment
- 7.2.1. Overhead
- 7.2.2. Underground
- 7.2.3. Submarine
- 7.1. Market Analysis, Insights and Forecast - by Voltage Level
- 8. Europe Power Distribution Cables Industry Analysis, Insights and Forecast, 2020-2032
- 8.1. Market Analysis, Insights and Forecast - by Voltage Level
- 8.1.1. Low
- 8.1.2. Medium
- 8.1.3. High
- 8.2. Market Analysis, Insights and Forecast - by Location of Deployment
- 8.2.1. Overhead
- 8.2.2. Underground
- 8.2.3. Submarine
- 8.1. Market Analysis, Insights and Forecast - by Voltage Level
- 9. Asia Pacific Power Distribution Cables Industry Analysis, Insights and Forecast, 2020-2032
- 9.1. Market Analysis, Insights and Forecast - by Voltage Level
- 9.1.1. Low
- 9.1.2. Medium
- 9.1.3. High
- 9.2. Market Analysis, Insights and Forecast - by Location of Deployment
- 9.2.1. Overhead
- 9.2.2. Underground
- 9.2.3. Submarine
- 9.1. Market Analysis, Insights and Forecast - by Voltage Level
- 10. South America Power Distribution Cables Industry Analysis, Insights and Forecast, 2020-2032
- 10.1. Market Analysis, Insights and Forecast - by Voltage Level
- 10.1.1. Low
- 10.1.2. Medium
- 10.1.3. High
- 10.2. Market Analysis, Insights and Forecast - by Location of Deployment
- 10.2.1. Overhead
- 10.2.2. Underground
- 10.2.3. Submarine
- 10.1. Market Analysis, Insights and Forecast - by Voltage Level
- 11. Middle East and Africa Power Distribution Cables Industry Analysis, Insights and Forecast, 2020-2032
- 11.1. Market Analysis, Insights and Forecast - by Voltage Level
- 11.1.1. Low
- 11.1.2. Medium
- 11.1.3. High
- 11.2. Market Analysis, Insights and Forecast - by Location of Deployment
- 11.2.1. Overhead
- 11.2.2. Underground
- 11.2.3. Submarine
- 11.1. Market Analysis, Insights and Forecast - by Voltage Level
- 12. Competitive Analysis
- 12.1. Company Profiles
- 12.1.1 Nexans SA
- 12.1.1.1. Company Overview
- 12.1.1.2. Products
- 12.1.1.3. Company Financials
- 12.1.1.4. SWOT Analysis
- 12.1.2 Sumitomo Electric Industries Limited
- 12.1.2.1. Company Overview
- 12.1.2.2. Products
- 12.1.2.3. Company Financials
- 12.1.2.4. SWOT Analysis
- 12.1.3 Prysmian SpA
- 12.1.3.1. Company Overview
- 12.1.3.2. Products
- 12.1.3.3. Company Financials
- 12.1.3.4. SWOT Analysis
- 12.1.4 Eland Cables Ltd
- 12.1.4.1. Company Overview
- 12.1.4.2. Products
- 12.1.4.3. Company Financials
- 12.1.4.4. SWOT Analysis
- 12.1.5 TE Connectivity Ltd
- 12.1.5.1. Company Overview
- 12.1.5.2. Products
- 12.1.5.3. Company Financials
- 12.1.5.4. SWOT Analysis
- 12.1.6 NKT A/S
- 12.1.6.1. Company Overview
- 12.1.6.2. Products
- 12.1.6.3. Company Financials
- 12.1.6.4. SWOT Analysis
- 12.1.7 Brugg Kabel AG
- 12.1.7.1. Company Overview
- 12.1.7.2. Products
- 12.1.7.3. Company Financials
- 12.1.7.4. SWOT Analysis
- 12.1.8 ABB Limited
- 12.1.8.1. Company Overview
- 12.1.8.2. Products
- 12.1.8.3. Company Financials
- 12.1.8.4. SWOT Analysis
- 12.1.1 Nexans SA
- 12.2. Market Entropy
- 12.2.1 Company's Key Areas Served
- 12.2.2 Recent Developments
- 12.3. Company Market Share Analysis 2025
- 12.3.1 Top 5 Companies Market Share Analysis
- 12.3.2 Top 3 Companies Market Share Analysis
- 12.4. List of Potential Customers
- 13. Research Methodology
List of Figures
- Figure 1: Global Power Distribution Cables Industry Revenue Breakdown (billion, %) by Region 2025 & 2033
- Figure 2: North America Power Distribution Cables Industry Revenue (billion), by Voltage Level 2025 & 2033
- Figure 3: North America Power Distribution Cables Industry Revenue Share (%), by Voltage Level 2025 & 2033
- Figure 4: North America Power Distribution Cables Industry Revenue (billion), by Location of Deployment 2025 & 2033
- Figure 5: North America Power Distribution Cables Industry Revenue Share (%), by Location of Deployment 2025 & 2033
- Figure 6: North America Power Distribution Cables Industry Revenue (billion), by Country 2025 & 2033
- Figure 7: North America Power Distribution Cables Industry Revenue Share (%), by Country 2025 & 2033
- Figure 8: Europe Power Distribution Cables Industry Revenue (billion), by Voltage Level 2025 & 2033
- Figure 9: Europe Power Distribution Cables Industry Revenue Share (%), by Voltage Level 2025 & 2033
- Figure 10: Europe Power Distribution Cables Industry Revenue (billion), by Location of Deployment 2025 & 2033
- Figure 11: Europe Power Distribution Cables Industry Revenue Share (%), by Location of Deployment 2025 & 2033
- Figure 12: Europe Power Distribution Cables Industry Revenue (billion), by Country 2025 & 2033
- Figure 13: Europe Power Distribution Cables Industry Revenue Share (%), by Country 2025 & 2033
- Figure 14: Asia Pacific Power Distribution Cables Industry Revenue (billion), by Voltage Level 2025 & 2033
- Figure 15: Asia Pacific Power Distribution Cables Industry Revenue Share (%), by Voltage Level 2025 & 2033
- Figure 16: Asia Pacific Power Distribution Cables Industry Revenue (billion), by Location of Deployment 2025 & 2033
- Figure 17: Asia Pacific Power Distribution Cables Industry Revenue Share (%), by Location of Deployment 2025 & 2033
- Figure 18: Asia Pacific Power Distribution Cables Industry Revenue (billion), by Country 2025 & 2033
- Figure 19: Asia Pacific Power Distribution Cables Industry Revenue Share (%), by Country 2025 & 2033
- Figure 20: South America Power Distribution Cables Industry Revenue (billion), by Voltage Level 2025 & 2033
- Figure 21: South America Power Distribution Cables Industry Revenue Share (%), by Voltage Level 2025 & 2033
- Figure 22: South America Power Distribution Cables Industry Revenue (billion), by Location of Deployment 2025 & 2033
- Figure 23: South America Power Distribution Cables Industry Revenue Share (%), by Location of Deployment 2025 & 2033
- Figure 24: South America Power Distribution Cables Industry Revenue (billion), by Country 2025 & 2033
- Figure 25: South America Power Distribution Cables Industry Revenue Share (%), by Country 2025 & 2033
- Figure 26: Middle East and Africa Power Distribution Cables Industry Revenue (billion), by Voltage Level 2025 & 2033
- Figure 27: Middle East and Africa Power Distribution Cables Industry Revenue Share (%), by Voltage Level 2025 & 2033
- Figure 28: Middle East and Africa Power Distribution Cables Industry Revenue (billion), by Location of Deployment 2025 & 2033
- Figure 29: Middle East and Africa Power Distribution Cables Industry Revenue Share (%), by Location of Deployment 2025 & 2033
- Figure 30: Middle East and Africa Power Distribution Cables Industry Revenue (billion), by Country 2025 & 2033
- Figure 31: Middle East and Africa Power Distribution Cables Industry Revenue Share (%), by Country 2025 & 2033
List of Tables
- Table 1: Global Power Distribution Cables Industry Revenue billion Forecast, by Voltage Level 2020 & 2033
- Table 2: Global Power Distribution Cables Industry Revenue billion Forecast, by Location of Deployment 2020 & 2033
- Table 3: Global Power Distribution Cables Industry Revenue billion Forecast, by Region 2020 & 2033
- Table 4: Global Power Distribution Cables Industry Revenue billion Forecast, by Voltage Level 2020 & 2033
- Table 5: Global Power Distribution Cables Industry Revenue billion Forecast, by Location of Deployment 2020 & 2033
- Table 6: Global Power Distribution Cables Industry Revenue billion Forecast, by Country 2020 & 2033
- Table 7: Global Power Distribution Cables Industry Revenue billion Forecast, by Voltage Level 2020 & 2033
- Table 8: Global Power Distribution Cables Industry Revenue billion Forecast, by Location of Deployment 2020 & 2033
- Table 9: Global Power Distribution Cables Industry Revenue billion Forecast, by Country 2020 & 2033
- Table 10: Global Power Distribution Cables Industry Revenue billion Forecast, by Voltage Level 2020 & 2033
- Table 11: Global Power Distribution Cables Industry Revenue billion Forecast, by Location of Deployment 2020 & 2033
- Table 12: Global Power Distribution Cables Industry Revenue billion Forecast, by Country 2020 & 2033
- Table 13: Global Power Distribution Cables Industry Revenue billion Forecast, by Voltage Level 2020 & 2033
- Table 14: Global Power Distribution Cables Industry Revenue billion Forecast, by Location of Deployment 2020 & 2033
- Table 15: Global Power Distribution Cables Industry Revenue billion Forecast, by Country 2020 & 2033
- Table 16: Global Power Distribution Cables Industry Revenue billion Forecast, by Voltage Level 2020 & 2033
- Table 17: Global Power Distribution Cables Industry Revenue billion Forecast, by Location of Deployment 2020 & 2033
- Table 18: Global Power Distribution Cables Industry Revenue billion Forecast, by Country 2020 & 2033
Frequently Asked Questions
1. What is the projected Compound Annual Growth Rate (CAGR) of the Power Distribution Cables Industry?
The projected CAGR is approximately 6.8%.
2. Which companies are prominent players in the Power Distribution Cables Industry?
Key companies in the market include Nexans SA, Sumitomo Electric Industries Limited, Prysmian SpA, Eland Cables Ltd, TE Connectivity Ltd, NKT A/S, Brugg Kabel AG, ABB Limited.
3. What are the main segments of the Power Distribution Cables Industry?
The market segments include Voltage Level, Location of Deployment.
4. Can you provide details about the market size?
The market size is estimated to be USD 232.28 billion as of 2022.
5. What are some drivers contributing to market growth?
Urbanization is a major driver for the power distribution cables market. As cities expand. there is a need for reliable and upgraded electrical infrastructure to meet the growing energy demand. Developing countries. in particular. are investing heavily in modernizing their power distribution systems to accommodate population growth and economic expansion..
6. What are the notable trends driving market growth?
The smart grid is a major trend in the power distribution sector. Smart grids use advanced communication and control technologies to improve the reliability and efficiency of power distribution. They enable real-time monitoring. fault detection. and optimization of energy use. reducing losses and enhancing grid stability..
7. Are there any restraints impacting market growth?
The initial capital investment required to manufacture and install power distribution cables can be significant. This includes costs related to raw materials. manufacturing processes. and installation infrastructure..
8. Can you provide examples of recent developments in the market?
December 2022: NKT was awarded a turnkey cable system contract for the electrification of the North of Alvheim (NOA) and Krafla offshore fields in the North Sea's NOAKA area. More than 255 kilometers of 145kV high-voltage AC power cables will be designed, manufactured, and installed by the cable-laying vessel NKT Victoria.
9. What pricing options are available for accessing the report?
Pricing options include single-user, multi-user, and enterprise licenses priced at USD 4750, USD 5250, and USD 8750 respectively.
10. Is the market size provided in terms of value or volume?
The market size is provided in terms of value, measured in billion.
11. Are there any specific market keywords associated with the report?
Yes, the market keyword associated with the report is "Power Distribution Cables Industry," which aids in identifying and referencing the specific market segment covered.
12. How do I determine which pricing option suits my needs best?
The pricing options vary based on user requirements and access needs. Individual users may opt for single-user licenses, while businesses requiring broader access may choose multi-user or enterprise licenses for cost-effective access to the report.
13. Are there any additional resources or data provided in the Power Distribution Cables Industry report?
While the report offers comprehensive insights, it's advisable to review the specific contents or supplementary materials provided to ascertain if additional resources or data are available.
14. How can I stay updated on further developments or reports in the Power Distribution Cables Industry?
To stay informed about further developments, trends, and reports in the Power Distribution Cables Industry, consider subscribing to industry newsletters, following relevant companies and organizations, or regularly checking reputable industry news sources and publications.
Methodology
Step 1 - Identification of Relevant Samples Size from Population Database


Step 2 - Approaches for Defining Global Market Size (Value, Volume* & Price*)

Note*: In applicable scenarios
Step 3 - Data Sources
Primary Research
- Web Analytics
- Survey Reports
- Research Institute
- Latest Research Reports
- Opinion Leaders
Secondary Research
- Annual Reports
- White Paper
- Latest Press Release
- Industry Association
- Paid Database
- Investor Presentations

Step 4 - Data Triangulation
Involves using different sources of information in order to increase the validity of a study
These sources are likely to be stakeholders in a program - participants, other researchers, program staff, other community members, and so on.
Then we put all data in single framework & apply various statistical tools to find out the dynamic on the market.
During the analysis stage, feedback from the stakeholder groups would be compared to determine areas of agreement as well as areas of divergence