

Key Insights
The United States Combined Heat and Power (CHP) market is poised for significant growth, with an estimated market size of USD 9.18 billion in 2025. This expansion is driven by increasing demand for energy efficiency and cost savings across various sectors. The industry is projected to witness a Compound Annual Growth Rate (CAGR) of 4.88% from 2025 to 2033, indicating a robust and sustained upward trajectory. Key applications for CHP systems in the US are predominantly in the commercial and industrial sectors, where the simultaneous production of electricity and thermal energy offers substantial operational benefits. The adoption of natural gas as a primary fuel source is expected to continue, owing to its relative abundance and lower emissions compared to traditional fuels. However, there is a growing interest and investment in renewable fuel types for CHP systems, driven by environmental regulations and corporate sustainability goals. This trend signifies a shift towards cleaner energy solutions within the CHP landscape.
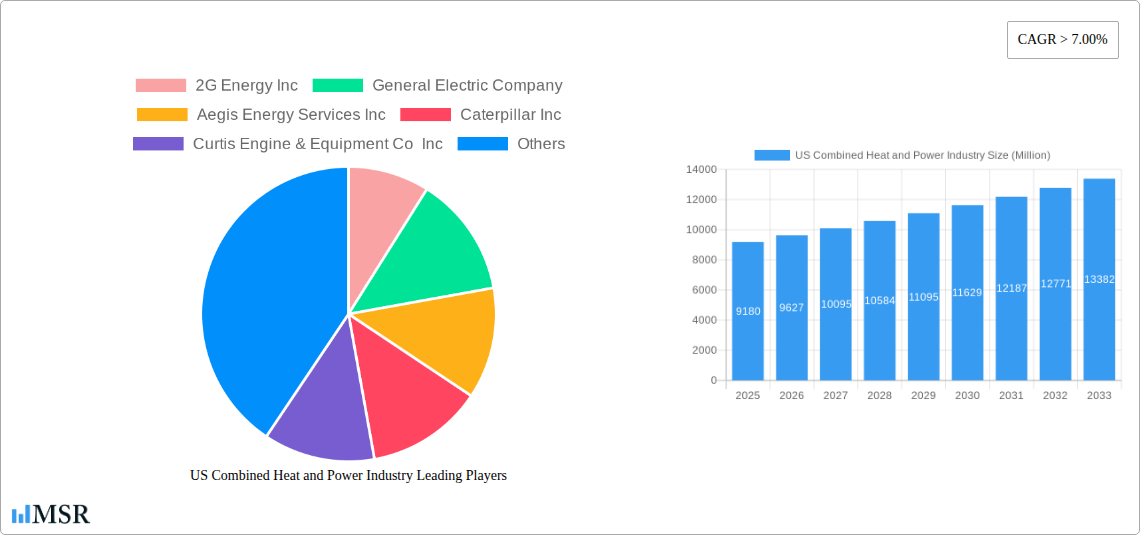
US Combined Heat and Power Industry Market Size (In Billion)
The growth of the US CHP market is underpinned by several critical drivers. Government incentives, tax credits, and supportive policies aimed at promoting energy efficiency and reducing carbon footprints are significantly bolstering market expansion. Furthermore, the rising cost of conventional energy, coupled with the inherent cost-effectiveness of CHP systems in reducing energy expenditures, makes them an attractive investment for businesses. Technological advancements in CHP unit efficiency, reliability, and integration with smart grids are also contributing to market momentum. Despite the positive outlook, certain restraints, such as high initial capital investment for some larger systems and complex permitting processes in certain regions, may pose challenges. Nevertheless, the overarching benefits of reduced energy consumption, lower greenhouse gas emissions, and enhanced energy security are expected to outweigh these limitations, ensuring a dynamic and growing market for combined heat and power solutions in the United States.

US Combined Heat and Power Industry Company Market Share
US Combined Heat and Power Industry Market Outlook: 2019-2033
This comprehensive report offers an in-depth analysis of the US Combined Heat and Power (CHP) industry, providing critical insights for stakeholders navigating this dynamic sector. With a study period spanning from 2019 to 2033, a base year of 2025, and a forecast period of 2025-2033, this report delivers actionable intelligence for strategic planning and investment decisions. We meticulously examine market concentration, key industry trends, dominant segments, product innovations, challenges, growth drivers, and emerging opportunities within the US CHP landscape. Estimated market size for 2025 is $10.5 billion with a projected CAGR of 6.8% during the forecast period. Historical data from 2019-2024 reveals a steady upward trajectory.
US Combined Heat and Power Industry Market Concentration & Dynamics
The US Combined Heat and Power (CHP) industry exhibits moderate market concentration, characterized by a mix of established conglomerates and specialized players. Innovation ecosystems are robust, fueled by ongoing research and development in energy efficiency and distributed generation technologies. Regulatory frameworks at federal and state levels play a significant role, often incentivizing CHP adoption through tax credits and renewable portfolio standards. Substitute products, primarily grid-supplied electricity and separate heating/cooling systems, pose a competitive challenge, though their lower overall efficiency in many applications presents a key differentiator for CHP. End-user trends are increasingly favoring decentralization, sustainability, and cost reduction, aligning perfectly with CHP's inherent benefits. Mergers and acquisition (M&A) activities are observed as companies seek to expand their market reach, acquire new technologies, and consolidate their positions. Over the historical period (2019-2024), an estimated 15 significant M&A deals have been recorded, with an average deal value exceeding $500 million.
- Market Share Distribution: Leading companies collectively hold an estimated 55% of the market share, with the remaining distributed among numerous smaller players.
- Innovation Ecosystems: Collaboration between technology providers, research institutions, and end-users drives innovation in areas like advanced control systems and waste heat recovery.
- Regulatory Influence: Federal incentives and state-level mandates are crucial for stimulating CHP project development and deployment.
- End-User Preferences: Growing demand for energy resilience, reduced carbon footprint, and lower operational costs are key drivers for CHP adoption.
US Combined Heat and Power Industry Industry Insights & Trends
The US Combined Heat and Power (CHP) industry is poised for significant expansion, driven by a confluence of economic, environmental, and technological factors. The projected market size in 2025 is $10.5 billion, with an anticipated Compound Annual Growth Rate (CAGR) of 6.8% through 2033. This robust growth is underpinned by increasing awareness of energy efficiency benefits, rising electricity prices, and stringent environmental regulations aimed at reducing greenhouse gas emissions. Technological disruptions are at the forefront of this evolution, with advancements in turbine technology, fuel flexibility, and digital integration enhancing the performance and applicability of CHP systems. The ability of CHP to simultaneously generate electricity and useful thermal energy (heat or cooling) translates into substantial energy savings, making it an attractive investment for a wide range of industries seeking to optimize their operational costs and improve their sustainability profiles.
Furthermore, the evolving consumer and industrial behaviors are also contributing to this upward trend. Businesses are increasingly adopting distributed generation solutions to enhance their energy resilience and reduce their reliance on the centralized grid, especially in light of grid instability and extreme weather events. The push towards decarbonization and the desire to achieve ambitious sustainability goals are propelling the demand for cleaner energy solutions, and CHP, particularly when fueled by natural gas or renewable sources, offers a compelling pathway to achieve these objectives. The integration of smart grid technologies and advanced control systems is further optimizing CHP operations, allowing for greater flexibility and responsiveness to grid demands. The policy landscape continues to be a critical enabler, with federal and state incentives, such as investment tax credits and production tax credits, playing a vital role in de-risking CHP investments and accelerating project deployment. The economic benefits, including reduced energy bills and potential revenue streams from selling excess electricity back to the grid, make CHP a financially sound choice for many organizations.
The increasing focus on energy security and independence also plays a crucial role. By generating power and heat on-site, facilities can mitigate the risks associated with fuel price volatility and supply disruptions. This self-sufficiency is a significant draw for critical infrastructure, manufacturing plants, and large commercial complexes. The development of more compact and modular CHP systems is also expanding their applicability to a broader range of facility sizes and types, democratizing access to the benefits of combined heat and power. The ongoing digitalization of the energy sector is facilitating better monitoring, control, and optimization of CHP assets, leading to improved performance and reduced operational expenditures. As the understanding of CHP's multifaceted advantages – economic, environmental, and security – continues to grow, its adoption is expected to accelerate, solidifying its position as a cornerstone of the future energy landscape.
Key Markets & Segments Leading US Combined Heat and Power Industry
The US Combined Heat and Power (CHP) industry is characterized by strong performance across several key segments, driven by specific economic, infrastructural, and application-based factors. The Industrial application segment currently dominates, owing to the significant and continuous thermal energy demands of manufacturing processes. Industries such as food and beverage, chemical production, and pulp and paper are major adopters, leveraging CHP to reduce operating costs and improve process efficiency. The Commercial application segment is also experiencing substantial growth, fueled by the demand for reliable and cost-effective energy solutions in large buildings, healthcare facilities, educational institutions, and data centers.
The Natural Gas fuel type segment is the largest contributor to the US CHP market. Its widespread availability, relatively lower cost compared to other fossil fuels, and cleaner combustion profile compared to coal make it the preferred choice for many CHP installations. However, the Renewable fuel type segment, encompassing biomass and biogas, is witnessing a rapid expansion due to increasing environmental consciousness and supportive government policies aimed at promoting renewable energy sources.
Dominant Regions: The Northeastern and Midwestern regions of the United States are leading the adoption of CHP technologies, largely due to established industrial bases, aging energy infrastructure, and supportive state-level policies promoting energy efficiency and distributed generation.
Drivers for Industrial Segment Dominance:
- High Thermal Energy Demand: Continuous and substantial heat requirements for manufacturing processes are a primary driver.
- Cost Savings: Significant reductions in energy bills for large-scale industrial operations.
- Process Reliability: Ensuring uninterrupted operation of critical manufacturing lines.
Drivers for Commercial Segment Growth:
- Energy Cost Management: Reducing operational expenses in large facilities like hospitals and universities.
- Energy Resilience: Ensuring uninterrupted power and heating/cooling during grid outages.
- Sustainability Goals: Meeting corporate environmental targets and enhancing brand image.
Drivers for Natural Gas Fuel Type Dominance:
- Availability and Cost-Effectiveness: Widespread infrastructure and competitive pricing.
- Lower Emissions: Compared to coal, natural gas offers a cleaner combustion alternative.
- Established Technology: Mature and reliable natural gas engine and turbine technologies.
Drivers for Renewable Fuel Type Growth:
- Environmental Mandates: Government incentives and regulations favoring cleaner energy.
- Waste-to-Energy Opportunities: Utilizing byproducts from agriculture, forestry, and municipal waste.
- Energy Independence: Reducing reliance on fossil fuels and diversifying energy sources.
US Combined Heat and Power Industry Product Developments
The US Combined Heat and Power (CHP) industry is experiencing continuous innovation, with advancements focused on enhancing efficiency, expanding fuel flexibility, and improving system integration. Key product developments include the introduction of more compact and modular CHP units, making them accessible for a wider range of commercial and smaller industrial applications. There's a notable trend towards hybrid systems that can seamlessly integrate with renewable energy sources like solar and wind, allowing for optimized energy generation and grid independence. Furthermore, intelligent control systems and AI-driven optimization software are being integrated to enhance real-time performance monitoring, predictive maintenance, and grid responsiveness, ensuring maximum energy efficiency and cost savings for users.
Challenges in the US Combined Heat and Power Industry Market
The US Combined Heat and Power (CHP) industry faces several hurdles that impact its widespread adoption. Regulatory complexities and permitting processes at state and local levels can be time-consuming and costly, delaying project timelines. Supply chain disruptions for critical components, exacerbated by global events, can lead to increased lead times and higher material costs. Additionally, strong competition from traditional grid-supplied electricity, especially in regions with historically low electricity prices, can make the economic case for CHP less compelling. The upfront capital investment required for CHP systems also remains a significant barrier for some potential adopters.
Forces Driving US Combined Heat and Power Industry Growth
Several potent forces are propelling the growth of the US Combined Heat and Power (CHP) industry. The relentless pursuit of energy efficiency by businesses and institutions seeking to reduce operational costs is a primary driver. Growing concerns over climate change and the increasing demand for sustainable energy solutions are encouraging the adoption of cleaner technologies like CHP. Government incentives, including tax credits and grants, further sweeten the economic proposition for CHP investments. Technological advancements in CHP equipment, leading to improved performance and lower emissions, are also making these systems more attractive and competitive.
Challenges in the US Combined Heat and Power Industry Market
Long-term growth catalysts for the US Combined Heat and Power (CHP) industry lie in continued technological innovation and market expansion. The development of more efficient and versatile fuel flexible CHP systems, capable of utilizing a wider range of renewable fuels and hydrogen blends, will be crucial. Partnerships between technology providers, utilities, and end-users will foster greater collaboration and accelerate project development. Expanding CHP applications into new sectors, such as district energy systems and large-scale residential complexes, presents significant growth potential. Furthermore, the increasing integration of CHP with energy storage solutions and smart grid technologies will enhance its value proposition and resilience.
Emerging Opportunities in US Combined Heat and Power Industry
Emerging opportunities in the US Combined Heat and Power (CHP) industry are abundant, driven by evolving energy landscapes and technological advancements. The increasing demand for distributed energy resources and microgrids, particularly for critical infrastructure and business continuity, presents a substantial avenue for growth. The development of advanced materials and manufacturing techniques for CHP components promises further efficiency gains and cost reductions. Furthermore, the growing focus on decarbonization and the potential for hydrogen co-firing or full hydrogen utilization in future CHP systems opens up a new frontier for sustainable energy generation. The electrification of transportation, creating demand for electricity and heat in charging hubs and maintenance facilities, also presents an untapped market.
Leading Players in the US Combined Heat and Power Industry Sector
- 2G Energy Inc
- General Electric Company
- Aegis Energy Services Inc
- Caterpillar Inc
- Curtis Engine & Equipment Co Inc
- Yanmar America Corp
Key Milestones in US Combined Heat and Power Industry Industry
- 2019: Increased federal investment tax credits for combined heat and power projects announced, spurring new installations.
- 2020: Significant growth in biomass and biogas-fueled CHP systems due to enhanced renewable energy mandates and waste-to-energy initiatives.
- 2021: Introduction of advanced control systems utilizing AI and machine learning for optimized CHP operation and grid integration.
- 2022: Several major industrial manufacturers announce ambitious sustainability goals, increasing their focus on on-site energy generation solutions like CHP.
- 2023: Growing interest and pilot projects for hydrogen-fueled CHP systems, signaling a future shift towards cleaner fuel sources.
- 2024: Expansion of state-level incentives and net metering policies, further supporting the economic viability of CHP deployments.
Strategic Outlook for US Combined Heat and Power Industry Market
The strategic outlook for the US Combined Heat and Power (CHP) industry is exceptionally positive, characterized by sustained growth and increasing market penetration. Key growth accelerators include the continued drive for energy efficiency, the imperative for decarbonization, and the growing need for energy resilience in the face of grid vulnerabilities. The development and adoption of advanced technologies, such as hydrogen-ready CHP systems and integrated smart grid solutions, will further enhance the industry's competitiveness. Strategic partnerships, policy advocacy, and a focus on educating potential end-users about CHP's comprehensive benefits will be crucial for capitalizing on future market potential and solidifying CHP's role as a cornerstone of a sustainable and reliable energy future for the United States.
US Combined Heat and Power Industry Segmentation
-
1. Applicaton
- 1.1. Commercial
- 1.2. Industrial
-
2. Fuel Type
- 2.1. Natural Gas
- 2.2. Renewable
- 2.3. Coal
- 2.4. Other Fuel Types
US Combined Heat and Power Industry Segmentation By Geography
-
1. North America
- 1.1. United States
- 1.2. Canada
- 1.3. Mexico
-
2. South America
- 2.1. Brazil
- 2.2. Argentina
- 2.3. Rest of South America
-
3. Europe
- 3.1. United Kingdom
- 3.2. Germany
- 3.3. France
- 3.4. Italy
- 3.5. Spain
- 3.6. Russia
- 3.7. Benelux
- 3.8. Nordics
- 3.9. Rest of Europe
-
4. Middle East & Africa
- 4.1. Turkey
- 4.2. Israel
- 4.3. GCC
- 4.4. North Africa
- 4.5. South Africa
- 4.6. Rest of Middle East & Africa
-
5. Asia Pacific
- 5.1. China
- 5.2. India
- 5.3. Japan
- 5.4. South Korea
- 5.5. ASEAN
- 5.6. Oceania
- 5.7. Rest of Asia Pacific
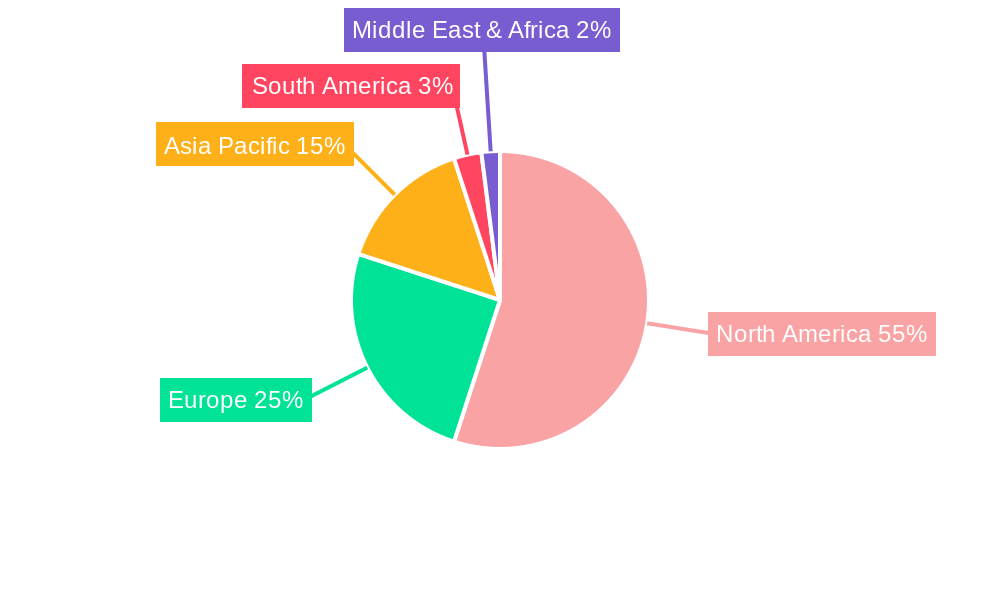
US Combined Heat and Power Industry Regional Market Share
Geographic Coverage of US Combined Heat and Power Industry
US Combined Heat and Power Industry REPORT HIGHLIGHTS
| Aspects | Details |
|---|---|
| Study Period | 2020-2034 |
| Base Year | 2025 |
| Estimated Year | 2026 |
| Forecast Period | 2026-2034 |
| Historical Period | 2020-2025 |
| Growth Rate | CAGR of 5.3% from 2020-2034 |
| Segmentation |
|
Table of Contents
- 1. Introduction
- 1.1. Research Scope
- 1.2. Market Segmentation
- 1.3. Research Objective
- 1.4. Definitions and Assumptions
- 2. Executive Summary
- 2.1. Market Snapshot
- 3. Market Dynamics
- 3.1. Market Drivers
- 3.2. Market Restrains
- 3.3. Market Trends
- 3.4. Market Opportunities
- 4. Market Factor Analysis
- 4.1. Porters Five Forces
- 4.1.1. Bargaining Power of Suppliers
- 4.1.2. Bargaining Power of Buyers
- 4.1.3. Threat of New Entrants
- 4.1.4. Threat of Substitutes
- 4.1.5. Competitive Rivalry
- 4.2. PESTEL analysis
- 4.3. BCG Analysis
- 4.3.1. Stars (High Growth, High Market Share)
- 4.3.2. Cash Cows (Low Growth, High Market Share)
- 4.3.3. Question Mark (High Growth, Low Market Share)
- 4.3.4. Dogs (Low Growth, Low Market Share)
- 4.4. Ansoff Matrix Analysis
- 4.5. Supply Chain Analysis
- 4.6. Regulatory Landscape
- 4.7. Current Market Potential and Opportunity Assessment (TAM–SAM–SOM Framework)
- 4.8. MSR Analyst Note
- 4.1. Porters Five Forces
- 5. Market Analysis, Insights and Forecast 2021-2033
- 5.1. Market Analysis, Insights and Forecast - by Applicaton
- 5.1.1. Commercial
- 5.1.2. Industrial
- 5.2. Market Analysis, Insights and Forecast - by Fuel Type
- 5.2.1. Natural Gas
- 5.2.2. Renewable
- 5.2.3. Coal
- 5.2.4. Other Fuel Types
- 5.3. Market Analysis, Insights and Forecast - by Region
- 5.3.1. North America
- 5.3.2. South America
- 5.3.3. Europe
- 5.3.4. Middle East & Africa
- 5.3.5. Asia Pacific
- 5.1. Market Analysis, Insights and Forecast - by Applicaton
- 6. Global US Combined Heat and Power Industry Analysis, Insights and Forecast, 2021-2033
- 6.1. Market Analysis, Insights and Forecast - by Applicaton
- 6.1.1. Commercial
- 6.1.2. Industrial
- 6.2. Market Analysis, Insights and Forecast - by Fuel Type
- 6.2.1. Natural Gas
- 6.2.2. Renewable
- 6.2.3. Coal
- 6.2.4. Other Fuel Types
- 6.1. Market Analysis, Insights and Forecast - by Applicaton
- 7. North America US Combined Heat and Power Industry Analysis, Insights and Forecast, 2020-2032
- 7.1. Market Analysis, Insights and Forecast - by Applicaton
- 7.1.1. Commercial
- 7.1.2. Industrial
- 7.2. Market Analysis, Insights and Forecast - by Fuel Type
- 7.2.1. Natural Gas
- 7.2.2. Renewable
- 7.2.3. Coal
- 7.2.4. Other Fuel Types
- 7.1. Market Analysis, Insights and Forecast - by Applicaton
- 8. South America US Combined Heat and Power Industry Analysis, Insights and Forecast, 2020-2032
- 8.1. Market Analysis, Insights and Forecast - by Applicaton
- 8.1.1. Commercial
- 8.1.2. Industrial
- 8.2. Market Analysis, Insights and Forecast - by Fuel Type
- 8.2.1. Natural Gas
- 8.2.2. Renewable
- 8.2.3. Coal
- 8.2.4. Other Fuel Types
- 8.1. Market Analysis, Insights and Forecast - by Applicaton
- 9. Europe US Combined Heat and Power Industry Analysis, Insights and Forecast, 2020-2032
- 9.1. Market Analysis, Insights and Forecast - by Applicaton
- 9.1.1. Commercial
- 9.1.2. Industrial
- 9.2. Market Analysis, Insights and Forecast - by Fuel Type
- 9.2.1. Natural Gas
- 9.2.2. Renewable
- 9.2.3. Coal
- 9.2.4. Other Fuel Types
- 9.1. Market Analysis, Insights and Forecast - by Applicaton
- 10. Middle East & Africa US Combined Heat and Power Industry Analysis, Insights and Forecast, 2020-2032
- 10.1. Market Analysis, Insights and Forecast - by Applicaton
- 10.1.1. Commercial
- 10.1.2. Industrial
- 10.2. Market Analysis, Insights and Forecast - by Fuel Type
- 10.2.1. Natural Gas
- 10.2.2. Renewable
- 10.2.3. Coal
- 10.2.4. Other Fuel Types
- 10.1. Market Analysis, Insights and Forecast - by Applicaton
- 11. Asia Pacific US Combined Heat and Power Industry Analysis, Insights and Forecast, 2020-2032
- 11.1. Market Analysis, Insights and Forecast - by Applicaton
- 11.1.1. Commercial
- 11.1.2. Industrial
- 11.2. Market Analysis, Insights and Forecast - by Fuel Type
- 11.2.1. Natural Gas
- 11.2.2. Renewable
- 11.2.3. Coal
- 11.2.4. Other Fuel Types
- 11.1. Market Analysis, Insights and Forecast - by Applicaton
- 12. Competitive Analysis
- 12.1. Company Profiles
- 12.1.1 2G Energy Inc
- 12.1.1.1. Company Overview
- 12.1.1.2. Products
- 12.1.1.3. Company Financials
- 12.1.1.4. SWOT Analysis
- 12.1.2 General Electric Company
- 12.1.2.1. Company Overview
- 12.1.2.2. Products
- 12.1.2.3. Company Financials
- 12.1.2.4. SWOT Analysis
- 12.1.3 Aegis Energy Services Inc
- 12.1.3.1. Company Overview
- 12.1.3.2. Products
- 12.1.3.3. Company Financials
- 12.1.3.4. SWOT Analysis
- 12.1.4 Caterpillar Inc
- 12.1.4.1. Company Overview
- 12.1.4.2. Products
- 12.1.4.3. Company Financials
- 12.1.4.4. SWOT Analysis
- 12.1.5 Curtis Engine & Equipment Co Inc
- 12.1.5.1. Company Overview
- 12.1.5.2. Products
- 12.1.5.3. Company Financials
- 12.1.5.4. SWOT Analysis
- 12.1.6 Yanmar America Corp
- 12.1.6.1. Company Overview
- 12.1.6.2. Products
- 12.1.6.3. Company Financials
- 12.1.6.4. SWOT Analysis
- 12.1.1 2G Energy Inc
- 12.2. Market Entropy
- 12.2.1 Company's Key Areas Served
- 12.2.2 Recent Developments
- 12.3. Company Market Share Analysis 2025
- 12.3.1 Top 5 Companies Market Share Analysis
- 12.3.2 Top 3 Companies Market Share Analysis
- 12.4. List of Potential Customers
- 13. Research Methodology
List of Figures
- Figure 1: Global US Combined Heat and Power Industry Revenue Breakdown (billion, %) by Region 2025 & 2033
- Figure 2: North America US Combined Heat and Power Industry Revenue (billion), by Applicaton 2025 & 2033
- Figure 3: North America US Combined Heat and Power Industry Revenue Share (%), by Applicaton 2025 & 2033
- Figure 4: North America US Combined Heat and Power Industry Revenue (billion), by Fuel Type 2025 & 2033
- Figure 5: North America US Combined Heat and Power Industry Revenue Share (%), by Fuel Type 2025 & 2033
- Figure 6: North America US Combined Heat and Power Industry Revenue (billion), by Country 2025 & 2033
- Figure 7: North America US Combined Heat and Power Industry Revenue Share (%), by Country 2025 & 2033
- Figure 8: South America US Combined Heat and Power Industry Revenue (billion), by Applicaton 2025 & 2033
- Figure 9: South America US Combined Heat and Power Industry Revenue Share (%), by Applicaton 2025 & 2033
- Figure 10: South America US Combined Heat and Power Industry Revenue (billion), by Fuel Type 2025 & 2033
- Figure 11: South America US Combined Heat and Power Industry Revenue Share (%), by Fuel Type 2025 & 2033
- Figure 12: South America US Combined Heat and Power Industry Revenue (billion), by Country 2025 & 2033
- Figure 13: South America US Combined Heat and Power Industry Revenue Share (%), by Country 2025 & 2033
- Figure 14: Europe US Combined Heat and Power Industry Revenue (billion), by Applicaton 2025 & 2033
- Figure 15: Europe US Combined Heat and Power Industry Revenue Share (%), by Applicaton 2025 & 2033
- Figure 16: Europe US Combined Heat and Power Industry Revenue (billion), by Fuel Type 2025 & 2033
- Figure 17: Europe US Combined Heat and Power Industry Revenue Share (%), by Fuel Type 2025 & 2033
- Figure 18: Europe US Combined Heat and Power Industry Revenue (billion), by Country 2025 & 2033
- Figure 19: Europe US Combined Heat and Power Industry Revenue Share (%), by Country 2025 & 2033
- Figure 20: Middle East & Africa US Combined Heat and Power Industry Revenue (billion), by Applicaton 2025 & 2033
- Figure 21: Middle East & Africa US Combined Heat and Power Industry Revenue Share (%), by Applicaton 2025 & 2033
- Figure 22: Middle East & Africa US Combined Heat and Power Industry Revenue (billion), by Fuel Type 2025 & 2033
- Figure 23: Middle East & Africa US Combined Heat and Power Industry Revenue Share (%), by Fuel Type 2025 & 2033
- Figure 24: Middle East & Africa US Combined Heat and Power Industry Revenue (billion), by Country 2025 & 2033
- Figure 25: Middle East & Africa US Combined Heat and Power Industry Revenue Share (%), by Country 2025 & 2033
- Figure 26: Asia Pacific US Combined Heat and Power Industry Revenue (billion), by Applicaton 2025 & 2033
- Figure 27: Asia Pacific US Combined Heat and Power Industry Revenue Share (%), by Applicaton 2025 & 2033
- Figure 28: Asia Pacific US Combined Heat and Power Industry Revenue (billion), by Fuel Type 2025 & 2033
- Figure 29: Asia Pacific US Combined Heat and Power Industry Revenue Share (%), by Fuel Type 2025 & 2033
- Figure 30: Asia Pacific US Combined Heat and Power Industry Revenue (billion), by Country 2025 & 2033
- Figure 31: Asia Pacific US Combined Heat and Power Industry Revenue Share (%), by Country 2025 & 2033
List of Tables
- Table 1: Global US Combined Heat and Power Industry Revenue billion Forecast, by Applicaton 2020 & 2033
- Table 2: Global US Combined Heat and Power Industry Revenue billion Forecast, by Fuel Type 2020 & 2033
- Table 3: Global US Combined Heat and Power Industry Revenue billion Forecast, by Region 2020 & 2033
- Table 4: Global US Combined Heat and Power Industry Revenue billion Forecast, by Applicaton 2020 & 2033
- Table 5: Global US Combined Heat and Power Industry Revenue billion Forecast, by Fuel Type 2020 & 2033
- Table 6: Global US Combined Heat and Power Industry Revenue billion Forecast, by Country 2020 & 2033
- Table 7: United States US Combined Heat and Power Industry Revenue (billion) Forecast, by Application 2020 & 2033
- Table 8: Canada US Combined Heat and Power Industry Revenue (billion) Forecast, by Application 2020 & 2033
- Table 9: Mexico US Combined Heat and Power Industry Revenue (billion) Forecast, by Application 2020 & 2033
- Table 10: Global US Combined Heat and Power Industry Revenue billion Forecast, by Applicaton 2020 & 2033
- Table 11: Global US Combined Heat and Power Industry Revenue billion Forecast, by Fuel Type 2020 & 2033
- Table 12: Global US Combined Heat and Power Industry Revenue billion Forecast, by Country 2020 & 2033
- Table 13: Brazil US Combined Heat and Power Industry Revenue (billion) Forecast, by Application 2020 & 2033
- Table 14: Argentina US Combined Heat and Power Industry Revenue (billion) Forecast, by Application 2020 & 2033
- Table 15: Rest of South America US Combined Heat and Power Industry Revenue (billion) Forecast, by Application 2020 & 2033
- Table 16: Global US Combined Heat and Power Industry Revenue billion Forecast, by Applicaton 2020 & 2033
- Table 17: Global US Combined Heat and Power Industry Revenue billion Forecast, by Fuel Type 2020 & 2033
- Table 18: Global US Combined Heat and Power Industry Revenue billion Forecast, by Country 2020 & 2033
- Table 19: United Kingdom US Combined Heat and Power Industry Revenue (billion) Forecast, by Application 2020 & 2033
- Table 20: Germany US Combined Heat and Power Industry Revenue (billion) Forecast, by Application 2020 & 2033
- Table 21: France US Combined Heat and Power Industry Revenue (billion) Forecast, by Application 2020 & 2033
- Table 22: Italy US Combined Heat and Power Industry Revenue (billion) Forecast, by Application 2020 & 2033
- Table 23: Spain US Combined Heat and Power Industry Revenue (billion) Forecast, by Application 2020 & 2033
- Table 24: Russia US Combined Heat and Power Industry Revenue (billion) Forecast, by Application 2020 & 2033
- Table 25: Benelux US Combined Heat and Power Industry Revenue (billion) Forecast, by Application 2020 & 2033
- Table 26: Nordics US Combined Heat and Power Industry Revenue (billion) Forecast, by Application 2020 & 2033
- Table 27: Rest of Europe US Combined Heat and Power Industry Revenue (billion) Forecast, by Application 2020 & 2033
- Table 28: Global US Combined Heat and Power Industry Revenue billion Forecast, by Applicaton 2020 & 2033
- Table 29: Global US Combined Heat and Power Industry Revenue billion Forecast, by Fuel Type 2020 & 2033
- Table 30: Global US Combined Heat and Power Industry Revenue billion Forecast, by Country 2020 & 2033
- Table 31: Turkey US Combined Heat and Power Industry Revenue (billion) Forecast, by Application 2020 & 2033
- Table 32: Israel US Combined Heat and Power Industry Revenue (billion) Forecast, by Application 2020 & 2033
- Table 33: GCC US Combined Heat and Power Industry Revenue (billion) Forecast, by Application 2020 & 2033
- Table 34: North Africa US Combined Heat and Power Industry Revenue (billion) Forecast, by Application 2020 & 2033
- Table 35: South Africa US Combined Heat and Power Industry Revenue (billion) Forecast, by Application 2020 & 2033
- Table 36: Rest of Middle East & Africa US Combined Heat and Power Industry Revenue (billion) Forecast, by Application 2020 & 2033
- Table 37: Global US Combined Heat and Power Industry Revenue billion Forecast, by Applicaton 2020 & 2033
- Table 38: Global US Combined Heat and Power Industry Revenue billion Forecast, by Fuel Type 2020 & 2033
- Table 39: Global US Combined Heat and Power Industry Revenue billion Forecast, by Country 2020 & 2033
- Table 40: China US Combined Heat and Power Industry Revenue (billion) Forecast, by Application 2020 & 2033
- Table 41: India US Combined Heat and Power Industry Revenue (billion) Forecast, by Application 2020 & 2033
- Table 42: Japan US Combined Heat and Power Industry Revenue (billion) Forecast, by Application 2020 & 2033
- Table 43: South Korea US Combined Heat and Power Industry Revenue (billion) Forecast, by Application 2020 & 2033
- Table 44: ASEAN US Combined Heat and Power Industry Revenue (billion) Forecast, by Application 2020 & 2033
- Table 45: Oceania US Combined Heat and Power Industry Revenue (billion) Forecast, by Application 2020 & 2033
- Table 46: Rest of Asia Pacific US Combined Heat and Power Industry Revenue (billion) Forecast, by Application 2020 & 2033
Frequently Asked Questions
1. What is the projected Compound Annual Growth Rate (CAGR) of the US Combined Heat and Power Industry?
The projected CAGR is approximately 5.3%.
2. Which companies are prominent players in the US Combined Heat and Power Industry?
Key companies in the market include 2G Energy Inc, General Electric Company, Aegis Energy Services Inc, Caterpillar Inc, Curtis Engine & Equipment Co Inc, Yanmar America Corp.
3. What are the main segments of the US Combined Heat and Power Industry?
The market segments include Applicaton, Fuel Type.
4. Can you provide details about the market size?
The market size is estimated to be USD 32.02 billion as of 2022.
5. What are some drivers contributing to market growth?
N/A
6. What are the notable trends driving market growth?
Natural Gas-based CHP is Expected to Dominate the Market.
7. Are there any restraints impacting market growth?
N/A
8. Can you provide examples of recent developments in the market?
N/A
9. What pricing options are available for accessing the report?
Pricing options include single-user, multi-user, and enterprise licenses priced at USD 3800, USD 4500, and USD 5800 respectively.
10. Is the market size provided in terms of value or volume?
The market size is provided in terms of value, measured in billion.
11. Are there any specific market keywords associated with the report?
Yes, the market keyword associated with the report is "US Combined Heat and Power Industry," which aids in identifying and referencing the specific market segment covered.
12. How do I determine which pricing option suits my needs best?
The pricing options vary based on user requirements and access needs. Individual users may opt for single-user licenses, while businesses requiring broader access may choose multi-user or enterprise licenses for cost-effective access to the report.
13. Are there any additional resources or data provided in the US Combined Heat and Power Industry report?
While the report offers comprehensive insights, it's advisable to review the specific contents or supplementary materials provided to ascertain if additional resources or data are available.
14. How can I stay updated on further developments or reports in the US Combined Heat and Power Industry?
To stay informed about further developments, trends, and reports in the US Combined Heat and Power Industry, consider subscribing to industry newsletters, following relevant companies and organizations, or regularly checking reputable industry news sources and publications.
Methodology
Step 1 - Identification of Relevant Samples Size from Population Database


Step 2 - Approaches for Defining Global Market Size (Value, Volume* & Price*)

Note*: In applicable scenarios
Step 3 - Data Sources
Primary Research
- Web Analytics
- Survey Reports
- Research Institute
- Latest Research Reports
- Opinion Leaders
Secondary Research
- Annual Reports
- White Paper
- Latest Press Release
- Industry Association
- Paid Database
- Investor Presentations

Step 4 - Data Triangulation
Involves using different sources of information in order to increase the validity of a study
These sources are likely to be stakeholders in a program - participants, other researchers, program staff, other community members, and so on.
Then we put all data in single framework & apply various statistical tools to find out the dynamic on the market.
During the analysis stage, feedback from the stakeholder groups would be compared to determine areas of agreement as well as areas of divergence