

Key Insights
The GCC solar photovoltaic (PV) industry is experiencing robust growth, driven by supportive government policies aimed at diversifying energy sources and reducing reliance on fossil fuels. The region's abundant sunshine and increasing energy demand create a fertile ground for solar PV adoption. A CAGR exceeding 12.50% indicates a significant expansion of the market, projected to reach substantial value within the forecast period (2025-2033). Key drivers include ambitious national renewable energy targets, decreasing solar PV system costs, and growing awareness of environmental sustainability. Furthermore, large-scale solar power projects, both utility-scale and commercial & industrial, are fueling this expansion. While regulatory frameworks and grid infrastructure limitations present some restraints, ongoing investments in grid modernization and supportive financing mechanisms are mitigating these challenges. The residential segment, though currently smaller, shows promise for future growth as technology advancements make solar PV more accessible and affordable for homeowners. Leading players like Masdar and ACWA Power are driving significant projects, alongside international companies such as JinkoSolar and First Solar, contributing to a dynamic and competitive market landscape. The market segmentation reveals strong growth across all deployment types, with utility-scale projects leading the charge, followed by commercial and industrial applications, and residential installations showcasing increasing potential.
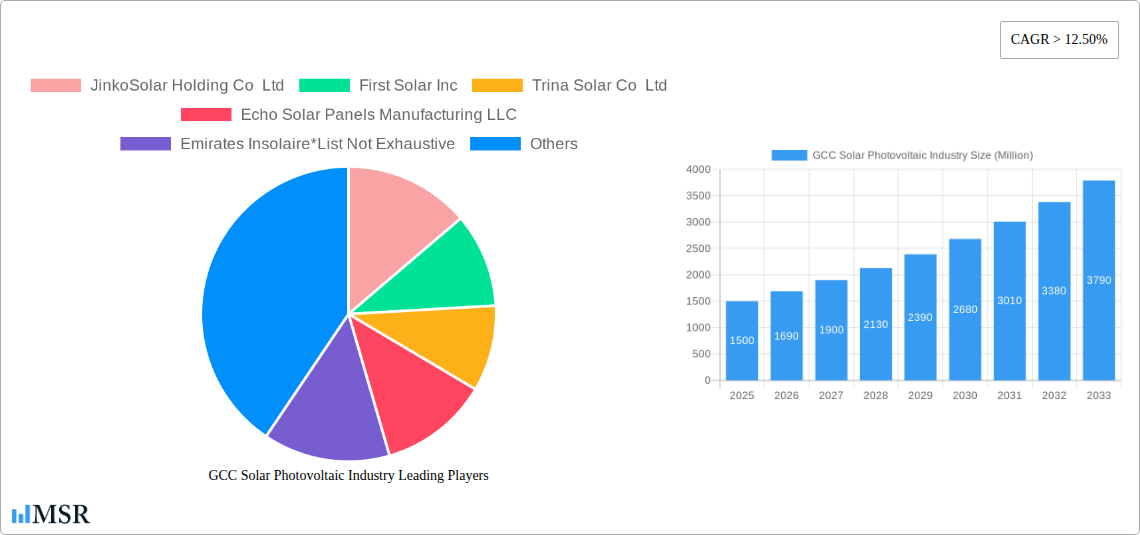
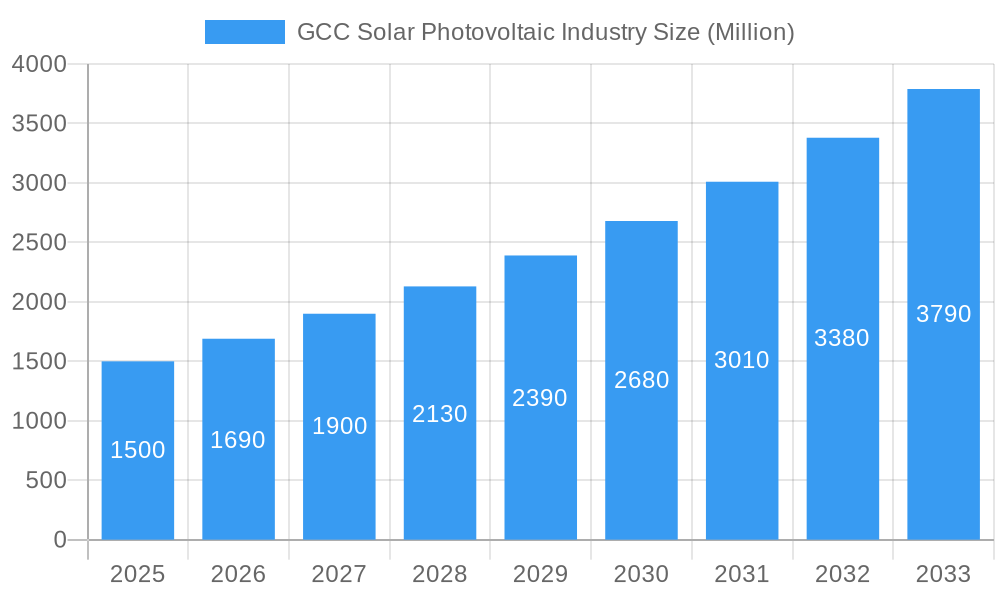
GCC Solar Photovoltaic Industry Market Size (In Billion)
The GCC's strategic location and commitment to sustainable development position it as a key player in the global solar energy market. The projected growth is further fueled by increasing private sector investment, coupled with public-private partnerships fostering innovation and technological advancements. The continued focus on research and development, aimed at enhancing efficiency and reducing costs of solar PV technology, will play a crucial role in accelerating market penetration. Factors like land availability, favorable climate conditions, and potential for energy export further bolster the outlook. Although challenges such as fluctuating oil prices and potential supply chain disruptions exist, the overall trajectory of the GCC solar PV industry remains exceptionally positive, underpinned by consistent government support and a burgeoning demand for clean energy.
GCC Solar Photovoltaic Industry Company Market Share
GCC Solar Photovoltaic Industry: A Comprehensive Market Report (2019-2033)
This in-depth report provides a comprehensive analysis of the GCC solar photovoltaic (PV) industry, offering invaluable insights for investors, industry stakeholders, and strategic decision-makers. Covering the period 2019-2033, with a focus on 2025, this report meticulously examines market dynamics, key players, technological advancements, and future growth prospects within the rapidly expanding GCC renewable energy sector. Expect detailed data on market size, CAGR, and M&A activity, providing a clear roadmap for navigating this lucrative market.
GCC Solar Photovoltaic Industry Market Concentration & Dynamics
The GCC solar PV market exhibits a moderately concentrated landscape, with several major players vying for market share. Key players include JinkoSolar Holding Co Ltd, First Solar Inc, Trina Solar Co Ltd, and Canadian Solar Inc, among others. While precise market share figures vary by segment (utility, commercial & industrial, residential), the top five players collectively hold an estimated xx% market share in 2025. Innovation is driven by both international players and local companies like Emirates Insolaire and Echo Solar Panels Manufacturing LLC, fostering a dynamic ecosystem. The regulatory landscape, while increasingly supportive of renewable energy adoption, still faces some challenges in standardization and streamlining permitting processes. Substitute products, such as other renewable energy sources (wind power) and traditional fossil fuels, exert competitive pressure. End-user trends reveal a strong shift toward renewable energy adoption, particularly amongst large commercial and industrial consumers and government initiatives. M&A activity in the sector has been moderate, with approximately xx major deals recorded during the historical period (2019-2024), suggesting further consolidation is likely.
GCC Solar Photovoltaic Industry Industry Insights & Trends
The GCC solar PV industry is experiencing robust growth, driven by ambitious government targets for renewable energy integration, declining solar PV technology costs, and increasing awareness of environmental sustainability. The market size in 2025 is estimated at USD xx Million, with a Compound Annual Growth Rate (CAGR) of xx% projected between 2025 and 2033. Technological disruptions, particularly in areas like thin-film solar technology and improved energy storage solutions, continue to enhance efficiency and reduce costs. Consumer behavior is evolving towards greater acceptance and demand for clean energy solutions, fueled by environmental concerns and economic incentives. Government support through subsidies, tax breaks, and feed-in tariffs further incentivizes solar PV adoption across all segments. Significant investment in large-scale solar power projects, like the Sakaka PV IPP, is setting a powerful precedent for future development.
Key Markets & Segments Leading GCC Solar Photovoltaic Industry
The utility-scale segment currently dominates the GCC solar PV market, fueled by large-scale government-backed projects and the significant economies of scale achievable in utility-sized deployments. The commercial and industrial segment is also experiencing significant growth, driven by the increasing adoption of on-site solar power generation to reduce energy costs and improve sustainability credentials.
Utility Segment Drivers:
- Government support through renewable energy targets and attractive tariffs.
- Large-scale project development by leading players like ACWA Power and Masdar.
- Abundant solar irradiance across the GCC region.
Commercial & Industrial Segment Drivers:
- Reduction in energy costs and improved operational efficiency.
- Increased corporate sustainability commitments and ESG (environmental, social, and governance) initiatives.
- Availability of financing options and government incentives.
The residential segment is showing growth, albeit at a slower pace compared to utility and commercial & industrial sectors, primarily due to higher upfront investment costs and limited awareness among individual homeowners.
GCC Solar Photovoltaic Industry Product Developments
The GCC solar PV industry is witnessing significant product innovations, including advancements in module efficiency, improved energy storage solutions, and the integration of smart grid technologies. These developments are enhancing the competitiveness of solar PV systems, particularly in terms of cost-effectiveness, reliability, and overall performance. Furthermore, new applications of solar technology, such as solar-powered water desalination plants, are emerging and creating additional opportunities for industry growth.
Challenges in the GCC Solar Photovoltaic Industry Market
The GCC solar PV market faces several challenges, including the intermittent nature of solar energy, the need for reliable energy storage solutions, and the high upfront capital costs associated with large-scale projects. Supply chain disruptions and competition from other renewable energy sources and fossil fuels also impact market dynamics. Regulatory hurdles and bureaucratic processes can delay project implementation, potentially impacting overall growth. These challenges can reduce investment, create delays in project execution and increase costs which requires policy adjustments.
Forces Driving GCC Solar Photovoltaic Industry Growth
Several factors are driving the substantial growth trajectory of the GCC solar PV industry. These include supportive government policies and regulations, which incentivize renewable energy development. The decreasing cost of solar PV technology, coupled with advancements in efficiency, make it an increasingly cost-competitive energy source compared to traditional fossil fuels. Furthermore, the abundant solar irradiance across the GCC region offers a significant resource advantage for solar power generation. Private sector investments and partnerships are bolstering this growth, driving further expansion of the industry.
Long-Term Growth Catalysts in the GCC Solar Photovoltaic Industry
Long-term growth in the GCC solar PV industry is fueled by continued technological innovation, strategic partnerships between international and local companies, and expansion into new market segments. Further integration of solar PV into smart grids, coupled with the development of robust energy storage technologies, will be crucial in overcoming intermittency issues. The growing demand for sustainable energy solutions across all sectors will propel further investments in large-scale renewable energy projects throughout the GCC.
Emerging Opportunities in GCC Solar Photovoltaic Industry
Significant opportunities exist for growth in the GCC solar PV market. These include the expansion into rural and remote areas with limited access to grid electricity, the development of innovative solar PV applications in various sectors, and the increasing adoption of rooftop solar systems in residential and commercial buildings. Furthermore, the rise of agrivoltaics (combining agriculture and solar power generation) presents a compelling opportunity for sustainable development. The integration of solar PV into smart cities and the development of decentralized energy systems also offer a multitude of opportunities.
Leading Players in the GCC Solar Photovoltaic Industry Sector
- JinkoSolar Holding Co Ltd
- First Solar Inc
- Trina Solar Co Ltd
- Echo Solar Panels Manufacturing LLC
- Emirates Insolaire
- Sunergy Solar
- Canadian Solar Inc
- Dubai Electricity and Water Authority
- Masdar Abu Dhabi Future Energy Company
- ACWA Power
Key Milestones in GCC Solar Photovoltaic Industry Industry
- April 2021: ACWA Power inaugurated the 300 MW Sakaka PV IPP, Saudi Arabia's first utility-scale renewable energy project (SAR 1.2 billion investment; USD 2.3417 cents/kWh tariff).
- Early 2020: Hanergy Thin Film Power Group announced plans for a USD 1 billion thin-film industrial park in Saudi Arabia.
Strategic Outlook for GCC Solar Photovoltaic Industry Market
The GCC solar PV market holds immense potential for future growth, driven by ambitious renewable energy targets, declining technology costs, and increasing investor interest. Strategic opportunities abound for companies focusing on innovation, efficiency improvements, and the development of integrated energy solutions. The focus on large-scale projects and the growing importance of energy storage will shape the future landscape of the GCC solar PV industry, creating a dynamic and rewarding market for stakeholders willing to embrace the challenges and opportunities ahead.
GCC Solar Photovoltaic Industry Segmentation
-
1. Deployment
- 1.1. Utility
- 1.2. Commercial and Industrial
- 1.3. Residential
-
2. Geography
- 2.1. United Arab Emirates
- 2.2. Saudi Arabia
- 2.3. Rest of GCC
GCC Solar Photovoltaic Industry Segmentation By Geography
- 1. United Arab Emirates
- 2. Saudi Arabia
- 3. Rest of GCC
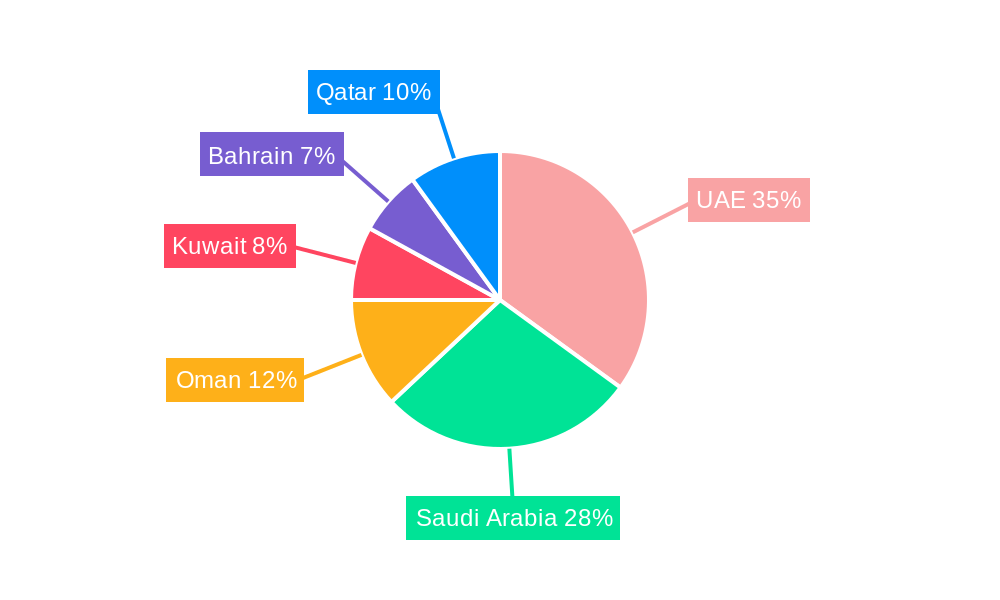
GCC Solar Photovoltaic Industry Regional Market Share
Geographic Coverage of GCC Solar Photovoltaic Industry
GCC Solar Photovoltaic Industry REPORT HIGHLIGHTS
| Aspects | Details |
|---|---|
| Study Period | 2020-2034 |
| Base Year | 2025 |
| Estimated Year | 2026 |
| Forecast Period | 2026-2034 |
| Historical Period | 2020-2025 |
| Growth Rate | CAGR of 10.8% from 2020-2034 |
| Segmentation |
|
Table of Contents
- 1. Introduction
- 1.1. Research Scope
- 1.2. Market Segmentation
- 1.3. Research Objective
- 1.4. Definitions and Assumptions
- 2. Executive Summary
- 2.1. Market Snapshot
- 3. Market Dynamics
- 3.1. Market Drivers
- 3.2. Market Restrains
- 3.3. Market Trends
- 3.4. Market Opportunities
- 4. Market Factor Analysis
- 4.1. Porters Five Forces
- 4.1.1. Bargaining Power of Suppliers
- 4.1.2. Bargaining Power of Buyers
- 4.1.3. Threat of New Entrants
- 4.1.4. Threat of Substitutes
- 4.1.5. Competitive Rivalry
- 4.2. PESTEL analysis
- 4.3. BCG Analysis
- 4.3.1. Stars (High Growth, High Market Share)
- 4.3.2. Cash Cows (Low Growth, High Market Share)
- 4.3.3. Question Mark (High Growth, Low Market Share)
- 4.3.4. Dogs (Low Growth, Low Market Share)
- 4.4. Ansoff Matrix Analysis
- 4.5. Supply Chain Analysis
- 4.6. Regulatory Landscape
- 4.7. Current Market Potential and Opportunity Assessment (TAM–SAM–SOM Framework)
- 4.8. MSR Analyst Note
- 4.1. Porters Five Forces
- 5. Market Analysis, Insights and Forecast 2021-2033
- 5.1. Market Analysis, Insights and Forecast - by Deployment
- 5.1.1. Utility
- 5.1.2. Commercial and Industrial
- 5.1.3. Residential
- 5.2. Market Analysis, Insights and Forecast - by Geography
- 5.2.1. United Arab Emirates
- 5.2.2. Saudi Arabia
- 5.2.3. Rest of GCC
- 5.3. Market Analysis, Insights and Forecast - by Region
- 5.3.1. United Arab Emirates
- 5.3.2. Saudi Arabia
- 5.3.3. Rest of GCC
- 5.1. Market Analysis, Insights and Forecast - by Deployment
- 6. Global GCC Solar Photovoltaic Industry Analysis, Insights and Forecast, 2021-2033
- 6.1. Market Analysis, Insights and Forecast - by Deployment
- 6.1.1. Utility
- 6.1.2. Commercial and Industrial
- 6.1.3. Residential
- 6.2. Market Analysis, Insights and Forecast - by Geography
- 6.2.1. United Arab Emirates
- 6.2.2. Saudi Arabia
- 6.2.3. Rest of GCC
- 6.1. Market Analysis, Insights and Forecast - by Deployment
- 7. United Arab Emirates GCC Solar Photovoltaic Industry Analysis, Insights and Forecast, 2020-2032
- 7.1. Market Analysis, Insights and Forecast - by Deployment
- 7.1.1. Utility
- 7.1.2. Commercial and Industrial
- 7.1.3. Residential
- 7.2. Market Analysis, Insights and Forecast - by Geography
- 7.2.1. United Arab Emirates
- 7.2.2. Saudi Arabia
- 7.2.3. Rest of GCC
- 7.1. Market Analysis, Insights and Forecast - by Deployment
- 8. Saudi Arabia GCC Solar Photovoltaic Industry Analysis, Insights and Forecast, 2020-2032
- 8.1. Market Analysis, Insights and Forecast - by Deployment
- 8.1.1. Utility
- 8.1.2. Commercial and Industrial
- 8.1.3. Residential
- 8.2. Market Analysis, Insights and Forecast - by Geography
- 8.2.1. United Arab Emirates
- 8.2.2. Saudi Arabia
- 8.2.3. Rest of GCC
- 8.1. Market Analysis, Insights and Forecast - by Deployment
- 9. Rest of GCC GCC Solar Photovoltaic Industry Analysis, Insights and Forecast, 2020-2032
- 9.1. Market Analysis, Insights and Forecast - by Deployment
- 9.1.1. Utility
- 9.1.2. Commercial and Industrial
- 9.1.3. Residential
- 9.2. Market Analysis, Insights and Forecast - by Geography
- 9.2.1. United Arab Emirates
- 9.2.2. Saudi Arabia
- 9.2.3. Rest of GCC
- 9.1. Market Analysis, Insights and Forecast - by Deployment
- 10. Competitive Analysis
- 10.1. Company Profiles
- 10.1.1 JinkoSolar Holding Co Ltd
- 10.1.1.1. Company Overview
- 10.1.1.2. Products
- 10.1.1.3. Company Financials
- 10.1.1.4. SWOT Analysis
- 10.1.2 First Solar Inc
- 10.1.2.1. Company Overview
- 10.1.2.2. Products
- 10.1.2.3. Company Financials
- 10.1.2.4. SWOT Analysis
- 10.1.3 Trina Solar Co Ltd
- 10.1.3.1. Company Overview
- 10.1.3.2. Products
- 10.1.3.3. Company Financials
- 10.1.3.4. SWOT Analysis
- 10.1.4 Echo Solar Panels Manufacturing LLC
- 10.1.4.1. Company Overview
- 10.1.4.2. Products
- 10.1.4.3. Company Financials
- 10.1.4.4. SWOT Analysis
- 10.1.5 Emirates Insolaire*List Not Exhaustive
- 10.1.5.1. Company Overview
- 10.1.5.2. Products
- 10.1.5.3. Company Financials
- 10.1.5.4. SWOT Analysis
- 10.1.6 Sunergy Solar
- 10.1.6.1. Company Overview
- 10.1.6.2. Products
- 10.1.6.3. Company Financials
- 10.1.6.4. SWOT Analysis
- 10.1.7 Canadian Solar Inc
- 10.1.7.1. Company Overview
- 10.1.7.2. Products
- 10.1.7.3. Company Financials
- 10.1.7.4. SWOT Analysis
- 10.1.8 Dubai Electricity and Water Authority
- 10.1.8.1. Company Overview
- 10.1.8.2. Products
- 10.1.8.3. Company Financials
- 10.1.8.4. SWOT Analysis
- 10.1.9 Masdar Abu Dhabi Future Energy Company
- 10.1.9.1. Company Overview
- 10.1.9.2. Products
- 10.1.9.3. Company Financials
- 10.1.9.4. SWOT Analysis
- 10.1.10 ACWA Power
- 10.1.10.1. Company Overview
- 10.1.10.2. Products
- 10.1.10.3. Company Financials
- 10.1.10.4. SWOT Analysis
- 10.1.1 JinkoSolar Holding Co Ltd
- 10.2. Market Entropy
- 10.2.1 Company's Key Areas Served
- 10.2.2 Recent Developments
- 10.3. Company Market Share Analysis 2025
- 10.3.1 Top 5 Companies Market Share Analysis
- 10.3.2 Top 3 Companies Market Share Analysis
- 10.4. List of Potential Customers
- 11. Research Methodology
List of Figures
- Figure 1: Global GCC Solar Photovoltaic Industry Revenue Breakdown (billion, %) by Region 2025 & 2033
- Figure 2: United Arab Emirates GCC Solar Photovoltaic Industry Revenue (billion), by Deployment 2025 & 2033
- Figure 3: United Arab Emirates GCC Solar Photovoltaic Industry Revenue Share (%), by Deployment 2025 & 2033
- Figure 4: United Arab Emirates GCC Solar Photovoltaic Industry Revenue (billion), by Geography 2025 & 2033
- Figure 5: United Arab Emirates GCC Solar Photovoltaic Industry Revenue Share (%), by Geography 2025 & 2033
- Figure 6: United Arab Emirates GCC Solar Photovoltaic Industry Revenue (billion), by Country 2025 & 2033
- Figure 7: United Arab Emirates GCC Solar Photovoltaic Industry Revenue Share (%), by Country 2025 & 2033
- Figure 8: Saudi Arabia GCC Solar Photovoltaic Industry Revenue (billion), by Deployment 2025 & 2033
- Figure 9: Saudi Arabia GCC Solar Photovoltaic Industry Revenue Share (%), by Deployment 2025 & 2033
- Figure 10: Saudi Arabia GCC Solar Photovoltaic Industry Revenue (billion), by Geography 2025 & 2033
- Figure 11: Saudi Arabia GCC Solar Photovoltaic Industry Revenue Share (%), by Geography 2025 & 2033
- Figure 12: Saudi Arabia GCC Solar Photovoltaic Industry Revenue (billion), by Country 2025 & 2033
- Figure 13: Saudi Arabia GCC Solar Photovoltaic Industry Revenue Share (%), by Country 2025 & 2033
- Figure 14: Rest of GCC GCC Solar Photovoltaic Industry Revenue (billion), by Deployment 2025 & 2033
- Figure 15: Rest of GCC GCC Solar Photovoltaic Industry Revenue Share (%), by Deployment 2025 & 2033
- Figure 16: Rest of GCC GCC Solar Photovoltaic Industry Revenue (billion), by Geography 2025 & 2033
- Figure 17: Rest of GCC GCC Solar Photovoltaic Industry Revenue Share (%), by Geography 2025 & 2033
- Figure 18: Rest of GCC GCC Solar Photovoltaic Industry Revenue (billion), by Country 2025 & 2033
- Figure 19: Rest of GCC GCC Solar Photovoltaic Industry Revenue Share (%), by Country 2025 & 2033
List of Tables
- Table 1: Global GCC Solar Photovoltaic Industry Revenue billion Forecast, by Deployment 2020 & 2033
- Table 2: Global GCC Solar Photovoltaic Industry Revenue billion Forecast, by Geography 2020 & 2033
- Table 3: Global GCC Solar Photovoltaic Industry Revenue billion Forecast, by Region 2020 & 2033
- Table 4: Global GCC Solar Photovoltaic Industry Revenue billion Forecast, by Deployment 2020 & 2033
- Table 5: Global GCC Solar Photovoltaic Industry Revenue billion Forecast, by Geography 2020 & 2033
- Table 6: Global GCC Solar Photovoltaic Industry Revenue billion Forecast, by Country 2020 & 2033
- Table 7: Global GCC Solar Photovoltaic Industry Revenue billion Forecast, by Deployment 2020 & 2033
- Table 8: Global GCC Solar Photovoltaic Industry Revenue billion Forecast, by Geography 2020 & 2033
- Table 9: Global GCC Solar Photovoltaic Industry Revenue billion Forecast, by Country 2020 & 2033
- Table 10: Global GCC Solar Photovoltaic Industry Revenue billion Forecast, by Deployment 2020 & 2033
- Table 11: Global GCC Solar Photovoltaic Industry Revenue billion Forecast, by Geography 2020 & 2033
- Table 12: Global GCC Solar Photovoltaic Industry Revenue billion Forecast, by Country 2020 & 2033
Frequently Asked Questions
1. What is the projected Compound Annual Growth Rate (CAGR) of the GCC Solar Photovoltaic Industry?
The projected CAGR is approximately 10.8%.
2. Which companies are prominent players in the GCC Solar Photovoltaic Industry?
Key companies in the market include JinkoSolar Holding Co Ltd, First Solar Inc, Trina Solar Co Ltd, Echo Solar Panels Manufacturing LLC, Emirates Insolaire*List Not Exhaustive, Sunergy Solar, Canadian Solar Inc, Dubai Electricity and Water Authority, Masdar Abu Dhabi Future Energy Company, ACWA Power.
3. What are the main segments of the GCC Solar Photovoltaic Industry?
The market segments include Deployment, Geography.
4. Can you provide details about the market size?
The market size is estimated to be USD 368.7 billion as of 2022.
5. What are some drivers contributing to market growth?
4.; Increasing Solar Energy Demand4.; Declining Cost of Solar PV Systems.
6. What are the notable trends driving market growth?
Utility Sector as a Significant Sector.
7. Are there any restraints impacting market growth?
4.; Strong Dependence on Prevailing Weather Condition.
8. Can you provide examples of recent developments in the market?
In April 2021, ACWA Power inaugurated the 300 MW Sakaka PV IPP, the country's first utility-scale renewable energy project, at an investment cost of SAR 1.2 billion. The project was awarded to ACWA Power at a record-breaking tariff of USD 2.3417 cents/kWh (8.781 halalas/kWh).
9. What pricing options are available for accessing the report?
Pricing options include single-user, multi-user, and enterprise licenses priced at USD 4750, USD 5250, and USD 8750 respectively.
10. Is the market size provided in terms of value or volume?
The market size is provided in terms of value, measured in billion.
11. Are there any specific market keywords associated with the report?
Yes, the market keyword associated with the report is "GCC Solar Photovoltaic Industry," which aids in identifying and referencing the specific market segment covered.
12. How do I determine which pricing option suits my needs best?
The pricing options vary based on user requirements and access needs. Individual users may opt for single-user licenses, while businesses requiring broader access may choose multi-user or enterprise licenses for cost-effective access to the report.
13. Are there any additional resources or data provided in the GCC Solar Photovoltaic Industry report?
While the report offers comprehensive insights, it's advisable to review the specific contents or supplementary materials provided to ascertain if additional resources or data are available.
14. How can I stay updated on further developments or reports in the GCC Solar Photovoltaic Industry?
To stay informed about further developments, trends, and reports in the GCC Solar Photovoltaic Industry, consider subscribing to industry newsletters, following relevant companies and organizations, or regularly checking reputable industry news sources and publications.
Methodology
Step 1 - Identification of Relevant Samples Size from Population Database


Step 2 - Approaches for Defining Global Market Size (Value, Volume* & Price*)

Note*: In applicable scenarios
Step 3 - Data Sources
Primary Research
- Web Analytics
- Survey Reports
- Research Institute
- Latest Research Reports
- Opinion Leaders
Secondary Research
- Annual Reports
- White Paper
- Latest Press Release
- Industry Association
- Paid Database
- Investor Presentations

Step 4 - Data Triangulation
Involves using different sources of information in order to increase the validity of a study
These sources are likely to be stakeholders in a program - participants, other researchers, program staff, other community members, and so on.
Then we put all data in single framework & apply various statistical tools to find out the dynamic on the market.
During the analysis stage, feedback from the stakeholder groups would be compared to determine areas of agreement as well as areas of divergence