

Key Insights
The Asia Pacific Demand Response (DR) market is poised for remarkable expansion, projected to reach a USD 5.9 billion valuation in 2025. This growth is underpinned by a robust CAGR of 17.7% expected throughout the forecast period of 2025-2033. The region's escalating energy demand, driven by rapid industrialization, urbanization, and a burgeoning middle class, is a primary catalyst. Furthermore, increasing grid instability due to extreme weather events and the integration of renewable energy sources necessitate flexible and resilient grid management solutions, making demand response a critical component. Governments across the Asia Pacific are actively promoting DR initiatives through favorable policies, regulatory frameworks, and pilot programs, incentivizing both utilities and consumers to participate. The growing awareness of energy efficiency and cost savings among industrial and commercial end-users is also a significant driver, as they seek to optimize their energy consumption and reduce operational expenses.
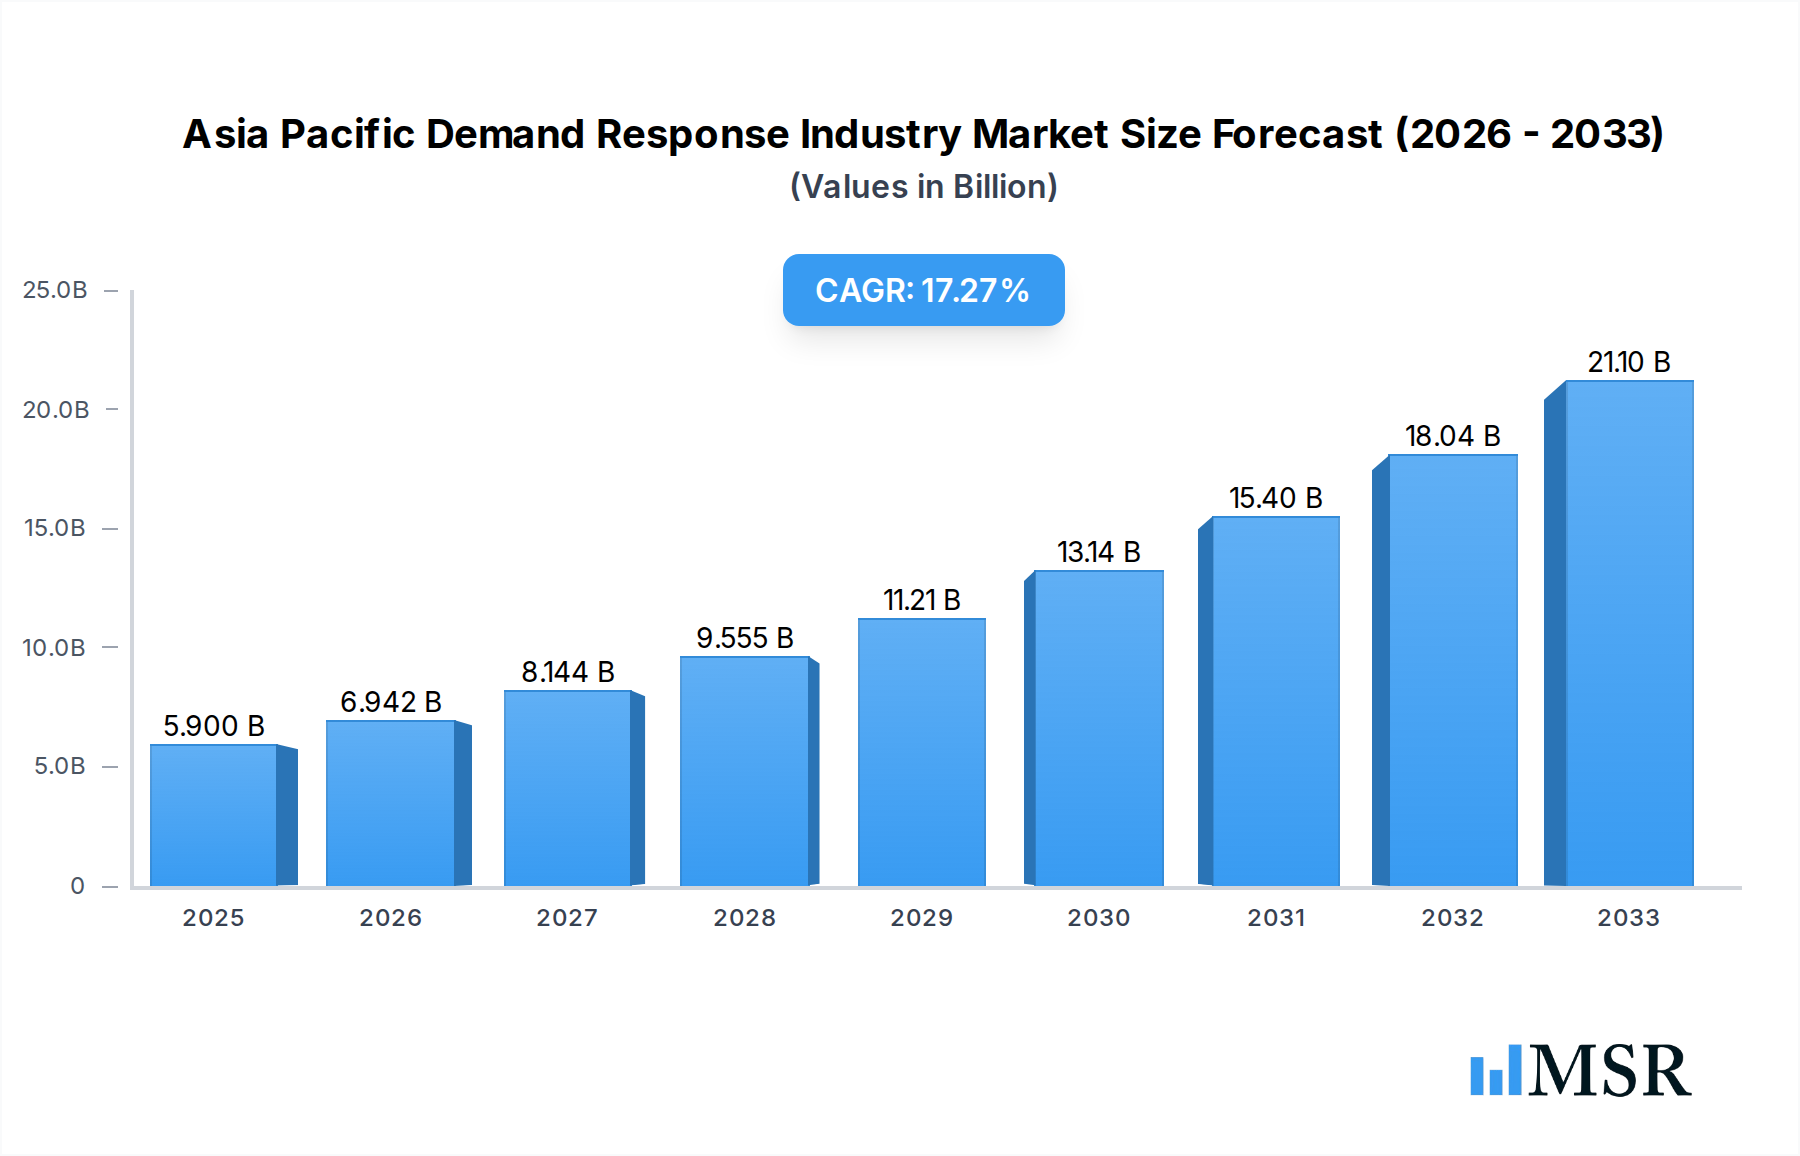
Asia Pacific Demand Response Industry Market Size (In Billion)
The market is segmented into Conventional Demand Response and Automated Demand Response, with the latter gaining significant traction due to advancements in IoT and smart grid technologies that enable real-time monitoring and control. Geographically, China and India are anticipated to lead the market expansion, owing to their sheer energy consumption and proactive investments in modernizing their power infrastructure. Japan and Australia, with their established smart grid ecosystems and strong focus on renewable energy integration, also represent substantial markets. Rest of the Asia Pacific countries are also expected to witness considerable growth as they increasingly adopt smart grid technologies and implement supportive policies. Key players are investing heavily in technological innovation and strategic partnerships to enhance their offerings and capture market share in this dynamic and rapidly evolving sector. The increasing focus on grid modernization and the imperative to manage peak load effectively will continue to propel the demand response market in the region.

Asia Pacific Demand Response Industry Company Market Share
Gain unparalleled insights into the dynamic Asia Pacific Demand Response Industry with this comprehensive market research report. Covering the Study Period 2019–2033, Base Year 2025, and Forecast Period 2025–2033, this report provides a granular analysis of market concentration, key trends, emerging opportunities, and strategic outlook. Explore the projected market size, expected to reach over $50 billion by 2033, with a Compound Annual Growth Rate (CAGR) of approximately 18% during the forecast period. This essential resource is tailored for industry stakeholders, investors, and policymakers seeking to navigate and capitalize on the burgeoning Asia Pacific demand response solutions market.
Asia Pacific Demand Response Industry Market Concentration & Dynamics
The Asia Pacific demand response market is characterized by a moderate to high level of concentration, with a significant portion of the market share held by a few leading global and regional players. Innovation ecosystems are rapidly evolving, driven by substantial investments in smart grid technologies and grid modernization initiatives across key economies like China, Japan, and Australia. Regulatory frameworks are becoming increasingly supportive, with governments actively promoting demand response programs to enhance grid stability, integrate renewable energy sources, and manage peak electricity demand. The presence of substitute products, such as energy storage systems and distributed generation, offers alternative solutions but often complements rather than directly replaces demand response. End-user trends indicate a growing adoption of Automated Demand Response (ADR) by large industrial and commercial facilities seeking greater efficiency and cost savings. Merger and acquisition (M&A) activities are a notable feature, with an estimated 25+ M&A deal counts observed during the historical period 2019-2024, indicating consolidation and strategic expansion among key companies. The market share of leading companies like Siemens AG and Schneider Electric SE is significant, reflecting their established presence and comprehensive solution offerings in this sector.
Asia Pacific Demand Response Industry Industry Insights & Trends
The Asia Pacific Demand Response Industry is on a trajectory of robust expansion, driven by an increasing demand for grid modernization and the growing imperative to integrate a higher penetration of renewable energy sources. The market size is projected to surge from an estimated $15 billion in 2025 to over $50 billion by 2033, exhibiting a compelling CAGR of approximately 18% during the forecast period. Key growth drivers include escalating electricity consumption due to rapid industrialization and urbanization across countries like China and India, coupled with government mandates and incentives aimed at improving energy efficiency and grid reliability. Technological disruptions, particularly the advancement and wider adoption of Automated Demand Response (ADR) technologies, are reshaping the market. ADR systems, leveraging intelligent communication and control, enable seamless and automated participation in demand response programs, offering enhanced precision and flexibility for both utilities and consumers. Evolving consumer behaviors, including a heightened awareness of energy costs and environmental impact, are further fueling the demand for smart energy solutions. Utilities are increasingly recognizing demand response as a cost-effective alternative to building new generation capacity, especially for managing peak loads. The integration of smart meters and advanced metering infrastructure (AMI) is a critical enabler, providing the necessary data and communication backbone for effective demand response deployment. Furthermore, the increasing prevalence of electric vehicles (EVs) presents a new avenue for demand response, enabling managed charging to support grid stability. The competitive landscape is dynamic, with both established power technology giants and innovative startups vying for market share, fostering a climate of continuous innovation and service enhancement in the Asia Pacific demand response market.
Key Markets & Segments Leading Asia Pacific Demand Response Industry
Dominant Geography: China
China is emerging as the undisputed leader in the Asia Pacific Demand Response Industry, driven by its sheer scale of energy consumption, rapid industrial growth, and ambitious smart grid development initiatives. The country's commitment to decarbonization and energy security makes demand response a critical tool for managing its vast and complex electricity grid.
- Economic Growth & Industrialization: China's continuous economic expansion, particularly in its manufacturing and industrial sectors, translates into substantial and often volatile electricity demand. Demand response programs are crucial for ensuring grid stability amidst this demand.
- Government Support & Policy Frameworks: The Chinese government has actively promoted energy efficiency and grid flexibility through supportive policies and pilot programs. This includes directives for utilities to implement demand response mechanisms and incentives for industrial and commercial consumers to participate.
- Smart Grid Investments: Significant investments in smart grid infrastructure, including advanced metering infrastructure (AMI) and communication networks, provide the foundational technology for effective demand response deployment across the nation.
Dominant Segment: Automated Demand Response (ADR)
Within the demand response types, Automated Demand Response (ADR) is experiencing the most rapid growth and is expected to lead market penetration across the Asia Pacific region.
- Technological Advancements: The increasing availability and decreasing cost of smart sensors, IoT devices, and advanced analytics platforms are making ADR solutions more accessible and effective for a wider range of consumers.
- Efficiency & Reliability: ADR offers superior efficiency and reliability compared to conventional methods by enabling automated, real-time adjustments to energy consumption based on grid signals. This minimizes human intervention and optimizes response times.
- Scalability & Integration: ADR platforms are designed for scalability, allowing them to be integrated with existing building management systems (BMS) and industrial control systems, facilitating widespread adoption by commercial and industrial facilities.
- Data Analytics & Optimization: The sophisticated data analytics capabilities of ADR systems allow for granular insights into energy consumption patterns, enabling participants to optimize their energy usage and maximize the benefits of demand response participation.
While Japan and Australia are also significant contributors with well-established demand response programs and supportive regulatory environments, China's market size and growth potential position it as the primary driver of the Asia Pacific demand response industry. The "Rest of Asia-Pacific" region, encompassing countries like India and Southeast Asian nations, presents substantial untapped potential for future growth as their energy infrastructure develops and smart grid adoption increases.
Asia Pacific Demand Response Industry Product Developments
Product innovations in the Asia Pacific Demand Response Industry are primarily focused on enhancing the intelligence, automation, and interoperability of demand response solutions. Companies are developing advanced software platforms that leverage AI and machine learning for predictive load forecasting and optimized demand response event dispatch. Integrated hardware solutions combining smart meters, communication modules, and control devices are becoming more sophisticated, offering seamless integration with building management systems and industrial automation. Furthermore, there's a growing emphasis on developing user-friendly interfaces for both utility operators and end-users, simplifying participation and reporting. The market relevance of these developments lies in their ability to improve grid flexibility, reduce operational costs for utilities, and provide significant cost savings and operational efficiencies for commercial and industrial customers, thereby driving wider adoption.
Challenges in the Asia Pacific Demand Response Industry Market
Navigating the Asia Pacific Demand Response Industry presents several challenges. Regulatory fragmentation across different countries and even within regions creates complexities for companies operating on a pan-Asian scale. Cybersecurity concerns surrounding the interconnected nature of smart grid and demand response systems pose a significant risk, requiring robust security measures. Consumer awareness and engagement remain a hurdle, with many end-users unfamiliar with the benefits or operational aspects of demand response programs. Interoperability standards for communication protocols and data exchange are still evolving, leading to integration challenges between different vendors' systems. The initial investment cost for advanced demand response technology can also be a barrier for some smaller businesses.
Forces Driving Asia Pacific Demand Response Industry Growth
The Asia Pacific Demand Response Industry is propelled by a confluence of powerful growth forces. Increasing electricity demand driven by economic growth and urbanization necessitates more efficient grid management. Government initiatives and supportive policies aimed at energy security and grid stability are actively promoting demand response adoption. Technological advancements, particularly in IoT, AI, and smart grid infrastructure, are making demand response solutions more sophisticated and accessible. The growing integration of renewable energy sources, which are intermittent by nature, requires flexible grid solutions like demand response to maintain balance. Rising electricity prices and a focus on cost savings for consumers are also significant economic drivers.
Challenges in the Asia Pacific Demand Response Industry Market
Long-term growth catalysts for the Asia Pacific Demand Response Industry are rooted in continuous innovation and strategic market expansion. The advancement of AI and machine learning will enable more sophisticated predictive capabilities and automated optimization of demand response resources. Strategic partnerships between technology providers, utilities, and large industrial consumers will foster greater collaboration and accelerate deployment. Market expansion into emerging economies within the Asia-Pacific region, as they develop their energy infrastructure, presents significant untapped potential. Furthermore, the evolution of market designs to better value the grid services provided by demand response will incentivize greater participation and investment.
Emerging Opportunities in Asia Pacific Demand Response Industry
Emerging opportunities in the Asia Pacific Demand Response Industry are vast and varied. The burgeoning electric vehicle (EV) charging infrastructure presents a significant opportunity for managed charging programs that can act as a large-scale demand response resource. The increasing deployment of distributed energy resources (DERs), such as rooftop solar and battery storage, creates a need for integrated demand response solutions to manage these assets effectively. Virtual power plants (VPPs), aggregating DERs and demand response capacity, are poised for substantial growth, offering new revenue streams and grid services. The development of smarter cities and smart buildings will further embed demand response capabilities into urban infrastructure. Furthermore, the growing focus on corporate sustainability goals is driving businesses to adopt demand response as part of their energy management strategies.
Leading Players in the Asia Pacific Demand Response Industry Sector
- REGEN Energy Inc
- ABB Ltd
- EnerNOC Inc
- Hitachi Ltd
- Mitsubishi Electric Corporation
- Siemens AG
- Schneider Electric SE
- Eaton Corporation PLC
- Alstom Inc
- General Electric Company
- Silver Spring Networks
- Autogrid Systems Inc
Key Milestones in Asia Pacific Demand Response Industry Industry
- 2019: Increased regulatory focus on grid flexibility in Japan, leading to pilot programs for demand response aggregation.
- 2020: China's National Development and Reform Commission (NDRC) announces plans to expand pilot demand response programs across multiple provinces.
- 2021: Hitachi Ltd launches an advanced energy management platform designed for demand response participation in commercial buildings.
- 2022: Siemens AG secures a major contract to upgrade grid infrastructure in Australia, including demand response capabilities.
- 2023: Schneider Electric SE announces strategic partnerships to deploy automated demand response solutions in South Korea and Singapore.
- 2024: ABB Ltd reports significant growth in its demand response software solutions for the Asia Pacific market, driven by utility adoption.
Strategic Outlook for Asia Pacific Demand Response Industry Market
The strategic outlook for the Asia Pacific Demand Response Industry is exceptionally positive, driven by its critical role in enabling a sustainable and reliable energy future. Growth accelerators will include the ongoing development of advanced AI-powered platforms for enhanced prediction and optimization, alongside the expansion of interoperability standards to facilitate seamless integration of diverse distributed energy resources. The increasing adoption of sophisticated Virtual Power Plant (VPP) models will unlock new revenue streams and grid services. Strategic market expansions into rapidly developing economies and the integration of demand response with emerging sectors like electric vehicle charging will further fuel growth. A sustained focus on policy support and regulatory clarity will be paramount in realizing the full market potential, positioning demand response as a cornerstone of modern grid management.
Asia Pacific Demand Response Industry Segmentation
-
1. Type
- 1.1. Conventional Demand Response
- 1.2. Automated Demand Response
-
2. Geography
- 2.1. Australia
- 2.2. China
- 2.3. India
- 2.4. Japan
- 2.5. Rest of Asia-Pacific
Asia Pacific Demand Response Industry Segmentation By Geography
- 1. Australia
- 2. China
- 3. India
- 4. Japan
- 5. Rest of Asia Pacific
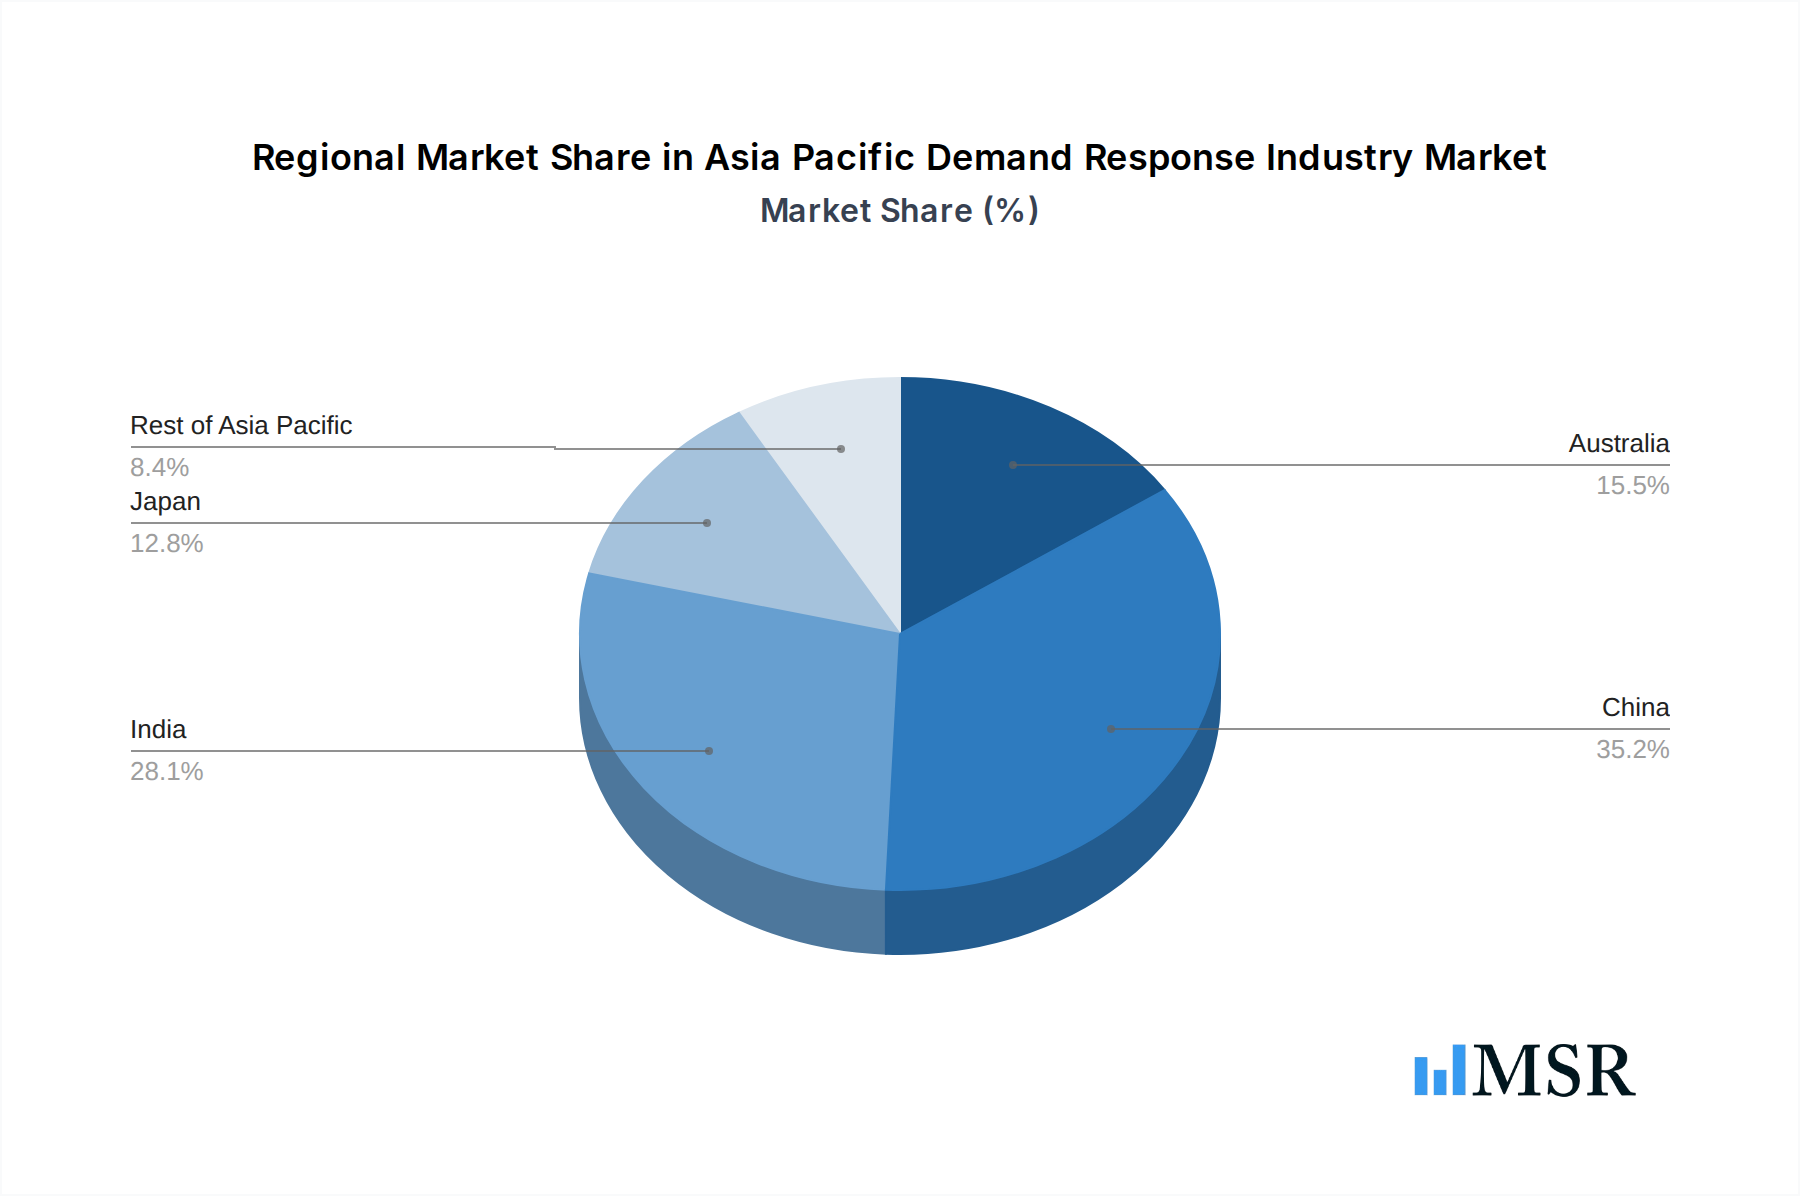
Asia Pacific Demand Response Industry Regional Market Share
Geographic Coverage of Asia Pacific Demand Response Industry
Asia Pacific Demand Response Industry REPORT HIGHLIGHTS
| Aspects | Details |
|---|---|
| Study Period | 2020-2034 |
| Base Year | 2025 |
| Estimated Year | 2026 |
| Forecast Period | 2026-2034 |
| Historical Period | 2020-2025 |
| Growth Rate | CAGR of 17.7% from 2020-2034 |
| Segmentation |
|
Table of Contents
- 1. Introduction
- 1.1. Research Scope
- 1.2. Market Segmentation
- 1.3. Research Objective
- 1.4. Definitions and Assumptions
- 2. Executive Summary
- 2.1. Market Snapshot
- 3. Market Dynamics
- 3.1. Market Drivers
- 3.2. Market Restrains
- 3.3. Market Trends
- 3.4. Market Opportunities
- 4. Market Factor Analysis
- 4.1. Porters Five Forces
- 4.1.1. Bargaining Power of Suppliers
- 4.1.2. Bargaining Power of Buyers
- 4.1.3. Threat of New Entrants
- 4.1.4. Threat of Substitutes
- 4.1.5. Competitive Rivalry
- 4.2. PESTEL analysis
- 4.3. BCG Analysis
- 4.3.1. Stars (High Growth, High Market Share)
- 4.3.2. Cash Cows (Low Growth, High Market Share)
- 4.3.3. Question Mark (High Growth, Low Market Share)
- 4.3.4. Dogs (Low Growth, Low Market Share)
- 4.4. Ansoff Matrix Analysis
- 4.5. Supply Chain Analysis
- 4.6. Regulatory Landscape
- 4.7. Current Market Potential and Opportunity Assessment (TAM–SAM–SOM Framework)
- 4.8. MSR Analyst Note
- 4.1. Porters Five Forces
- 5. Market Analysis, Insights and Forecast 2021-2033
- 5.1. Market Analysis, Insights and Forecast - by Type
- 5.1.1. Conventional Demand Response
- 5.1.2. Automated Demand Response
- 5.2. Market Analysis, Insights and Forecast - by Geography
- 5.2.1. Australia
- 5.2.2. China
- 5.2.3. India
- 5.2.4. Japan
- 5.2.5. Rest of Asia-Pacific
- 5.3. Market Analysis, Insights and Forecast - by Region
- 5.3.1. Australia
- 5.3.2. China
- 5.3.3. India
- 5.3.4. Japan
- 5.3.5. Rest of Asia Pacific
- 5.1. Market Analysis, Insights and Forecast - by Type
- 6. Asia Pacific Demand Response Industry Analysis, Insights and Forecast, 2021-2033
- 6.1. Market Analysis, Insights and Forecast - by Type
- 6.1.1. Conventional Demand Response
- 6.1.2. Automated Demand Response
- 6.2. Market Analysis, Insights and Forecast - by Geography
- 6.2.1. Australia
- 6.2.2. China
- 6.2.3. India
- 6.2.4. Japan
- 6.2.5. Rest of Asia-Pacific
- 6.1. Market Analysis, Insights and Forecast - by Type
- 7. Australia Asia Pacific Demand Response Industry Analysis, Insights and Forecast, 2020-2032
- 7.1. Market Analysis, Insights and Forecast - by Type
- 7.1.1. Conventional Demand Response
- 7.1.2. Automated Demand Response
- 7.2. Market Analysis, Insights and Forecast - by Geography
- 7.2.1. Australia
- 7.2.2. China
- 7.2.3. India
- 7.2.4. Japan
- 7.2.5. Rest of Asia-Pacific
- 7.1. Market Analysis, Insights and Forecast - by Type
- 8. China Asia Pacific Demand Response Industry Analysis, Insights and Forecast, 2020-2032
- 8.1. Market Analysis, Insights and Forecast - by Type
- 8.1.1. Conventional Demand Response
- 8.1.2. Automated Demand Response
- 8.2. Market Analysis, Insights and Forecast - by Geography
- 8.2.1. Australia
- 8.2.2. China
- 8.2.3. India
- 8.2.4. Japan
- 8.2.5. Rest of Asia-Pacific
- 8.1. Market Analysis, Insights and Forecast - by Type
- 9. India Asia Pacific Demand Response Industry Analysis, Insights and Forecast, 2020-2032
- 9.1. Market Analysis, Insights and Forecast - by Type
- 9.1.1. Conventional Demand Response
- 9.1.2. Automated Demand Response
- 9.2. Market Analysis, Insights and Forecast - by Geography
- 9.2.1. Australia
- 9.2.2. China
- 9.2.3. India
- 9.2.4. Japan
- 9.2.5. Rest of Asia-Pacific
- 9.1. Market Analysis, Insights and Forecast - by Type
- 10. Japan Asia Pacific Demand Response Industry Analysis, Insights and Forecast, 2020-2032
- 10.1. Market Analysis, Insights and Forecast - by Type
- 10.1.1. Conventional Demand Response
- 10.1.2. Automated Demand Response
- 10.2. Market Analysis, Insights and Forecast - by Geography
- 10.2.1. Australia
- 10.2.2. China
- 10.2.3. India
- 10.2.4. Japan
- 10.2.5. Rest of Asia-Pacific
- 10.1. Market Analysis, Insights and Forecast - by Type
- 11. Rest of Asia Pacific Asia Pacific Demand Response Industry Analysis, Insights and Forecast, 2020-2032
- 11.1. Market Analysis, Insights and Forecast - by Type
- 11.1.1. Conventional Demand Response
- 11.1.2. Automated Demand Response
- 11.2. Market Analysis, Insights and Forecast - by Geography
- 11.2.1. Australia
- 11.2.2. China
- 11.2.3. India
- 11.2.4. Japan
- 11.2.5. Rest of Asia-Pacific
- 11.1. Market Analysis, Insights and Forecast - by Type
- 12. Competitive Analysis
- 12.1. Company Profiles
- 12.1.1 REGEN Energy Inc
- 12.1.1.1. Company Overview
- 12.1.1.2. Products
- 12.1.1.3. Company Financials
- 12.1.1.4. SWOT Analysis
- 12.1.2 ABB Ltd
- 12.1.2.1. Company Overview
- 12.1.2.2. Products
- 12.1.2.3. Company Financials
- 12.1.2.4. SWOT Analysis
- 12.1.3 EnerNOC Inc
- 12.1.3.1. Company Overview
- 12.1.3.2. Products
- 12.1.3.3. Company Financials
- 12.1.3.4. SWOT Analysis
- 12.1.4 Hitachi Ltd
- 12.1.4.1. Company Overview
- 12.1.4.2. Products
- 12.1.4.3. Company Financials
- 12.1.4.4. SWOT Analysis
- 12.1.5 Mitsubishi Electric Corporation
- 12.1.5.1. Company Overview
- 12.1.5.2. Products
- 12.1.5.3. Company Financials
- 12.1.5.4. SWOT Analysis
- 12.1.6 Siemens AG
- 12.1.6.1. Company Overview
- 12.1.6.2. Products
- 12.1.6.3. Company Financials
- 12.1.6.4. SWOT Analysis
- 12.1.7 Schneider Electric SE
- 12.1.7.1. Company Overview
- 12.1.7.2. Products
- 12.1.7.3. Company Financials
- 12.1.7.4. SWOT Analysis
- 12.1.8 Eaton Corporation PLC
- 12.1.8.1. Company Overview
- 12.1.8.2. Products
- 12.1.8.3. Company Financials
- 12.1.8.4. SWOT Analysis
- 12.1.9 Alstom Inc
- 12.1.9.1. Company Overview
- 12.1.9.2. Products
- 12.1.9.3. Company Financials
- 12.1.9.4. SWOT Analysis
- 12.1.10 General Electric Company
- 12.1.10.1. Company Overview
- 12.1.10.2. Products
- 12.1.10.3. Company Financials
- 12.1.10.4. SWOT Analysis
- 12.1.11 Silver Spring Networks
- 12.1.11.1. Company Overview
- 12.1.11.2. Products
- 12.1.11.3. Company Financials
- 12.1.11.4. SWOT Analysis
- 12.1.12 Autogrid Systems Inc
- 12.1.12.1. Company Overview
- 12.1.12.2. Products
- 12.1.12.3. Company Financials
- 12.1.12.4. SWOT Analysis
- 12.1.1 REGEN Energy Inc
- 12.2. Market Entropy
- 12.2.1 Company's Key Areas Served
- 12.2.2 Recent Developments
- 12.3. Company Market Share Analysis 2025
- 12.3.1 Top 5 Companies Market Share Analysis
- 12.3.2 Top 3 Companies Market Share Analysis
- 12.4. List of Potential Customers
- 13. Research Methodology
List of Figures
- Figure 1: Asia Pacific Demand Response Industry Revenue Breakdown (billion, %) by Product 2025 & 2033
- Figure 2: Asia Pacific Demand Response Industry Share (%) by Company 2025
List of Tables
- Table 1: Asia Pacific Demand Response Industry Revenue billion Forecast, by Type 2020 & 2033
- Table 2: Asia Pacific Demand Response Industry Revenue billion Forecast, by Geography 2020 & 2033
- Table 3: Asia Pacific Demand Response Industry Revenue billion Forecast, by Region 2020 & 2033
- Table 4: Asia Pacific Demand Response Industry Revenue billion Forecast, by Type 2020 & 2033
- Table 5: Asia Pacific Demand Response Industry Revenue billion Forecast, by Geography 2020 & 2033
- Table 6: Asia Pacific Demand Response Industry Revenue billion Forecast, by Country 2020 & 2033
- Table 7: Asia Pacific Demand Response Industry Revenue billion Forecast, by Type 2020 & 2033
- Table 8: Asia Pacific Demand Response Industry Revenue billion Forecast, by Geography 2020 & 2033
- Table 9: Asia Pacific Demand Response Industry Revenue billion Forecast, by Country 2020 & 2033
- Table 10: Asia Pacific Demand Response Industry Revenue billion Forecast, by Type 2020 & 2033
- Table 11: Asia Pacific Demand Response Industry Revenue billion Forecast, by Geography 2020 & 2033
- Table 12: Asia Pacific Demand Response Industry Revenue billion Forecast, by Country 2020 & 2033
- Table 13: Asia Pacific Demand Response Industry Revenue billion Forecast, by Type 2020 & 2033
- Table 14: Asia Pacific Demand Response Industry Revenue billion Forecast, by Geography 2020 & 2033
- Table 15: Asia Pacific Demand Response Industry Revenue billion Forecast, by Country 2020 & 2033
- Table 16: Asia Pacific Demand Response Industry Revenue billion Forecast, by Type 2020 & 2033
- Table 17: Asia Pacific Demand Response Industry Revenue billion Forecast, by Geography 2020 & 2033
- Table 18: Asia Pacific Demand Response Industry Revenue billion Forecast, by Country 2020 & 2033
Frequently Asked Questions
1. What is the projected Compound Annual Growth Rate (CAGR) of the Asia Pacific Demand Response Industry?
The projected CAGR is approximately 17.7%.
2. Which companies are prominent players in the Asia Pacific Demand Response Industry?
Key companies in the market include REGEN Energy Inc, ABB Ltd, EnerNOC Inc, Hitachi Ltd, Mitsubishi Electric Corporation, Siemens AG, Schneider Electric SE, Eaton Corporation PLC, Alstom Inc, General Electric Company, Silver Spring Networks, Autogrid Systems Inc.
3. What are the main segments of the Asia Pacific Demand Response Industry?
The market segments include Type, Geography.
4. Can you provide details about the market size?
The market size is estimated to be USD 5.9 billion as of 2022.
5. What are some drivers contributing to market growth?
4.; Growing Demand for Energy As A Service4.; Increasing Adoption of Distributed Energy Generation in Commercial and Industrial Sectors.
6. What are the notable trends driving market growth?
Automated Demand Response System Likely To Drive The Market.
7. Are there any restraints impacting market growth?
4.; Lack of Awareness in Developing Economies and High Technological Costs.
8. Can you provide examples of recent developments in the market?
N/A
9. What pricing options are available for accessing the report?
Pricing options include single-user, multi-user, and enterprise licenses priced at USD 4750, USD 5250, and USD 8750 respectively.
10. Is the market size provided in terms of value or volume?
The market size is provided in terms of value, measured in billion.
11. Are there any specific market keywords associated with the report?
Yes, the market keyword associated with the report is "Asia Pacific Demand Response Industry," which aids in identifying and referencing the specific market segment covered.
12. How do I determine which pricing option suits my needs best?
The pricing options vary based on user requirements and access needs. Individual users may opt for single-user licenses, while businesses requiring broader access may choose multi-user or enterprise licenses for cost-effective access to the report.
13. Are there any additional resources or data provided in the Asia Pacific Demand Response Industry report?
While the report offers comprehensive insights, it's advisable to review the specific contents or supplementary materials provided to ascertain if additional resources or data are available.
14. How can I stay updated on further developments or reports in the Asia Pacific Demand Response Industry?
To stay informed about further developments, trends, and reports in the Asia Pacific Demand Response Industry, consider subscribing to industry newsletters, following relevant companies and organizations, or regularly checking reputable industry news sources and publications.
Methodology
Step 1 - Identification of Relevant Samples Size from Population Database


Step 2 - Approaches for Defining Global Market Size (Value, Volume* & Price*)

Note*: In applicable scenarios
Step 3 - Data Sources
Primary Research
- Web Analytics
- Survey Reports
- Research Institute
- Latest Research Reports
- Opinion Leaders
Secondary Research
- Annual Reports
- White Paper
- Latest Press Release
- Industry Association
- Paid Database
- Investor Presentations

Step 4 - Data Triangulation
Involves using different sources of information in order to increase the validity of a study
These sources are likely to be stakeholders in a program - participants, other researchers, program staff, other community members, and so on.
Then we put all data in single framework & apply various statistical tools to find out the dynamic on the market.
During the analysis stage, feedback from the stakeholder groups would be compared to determine areas of agreement as well as areas of divergence