

Key Insights
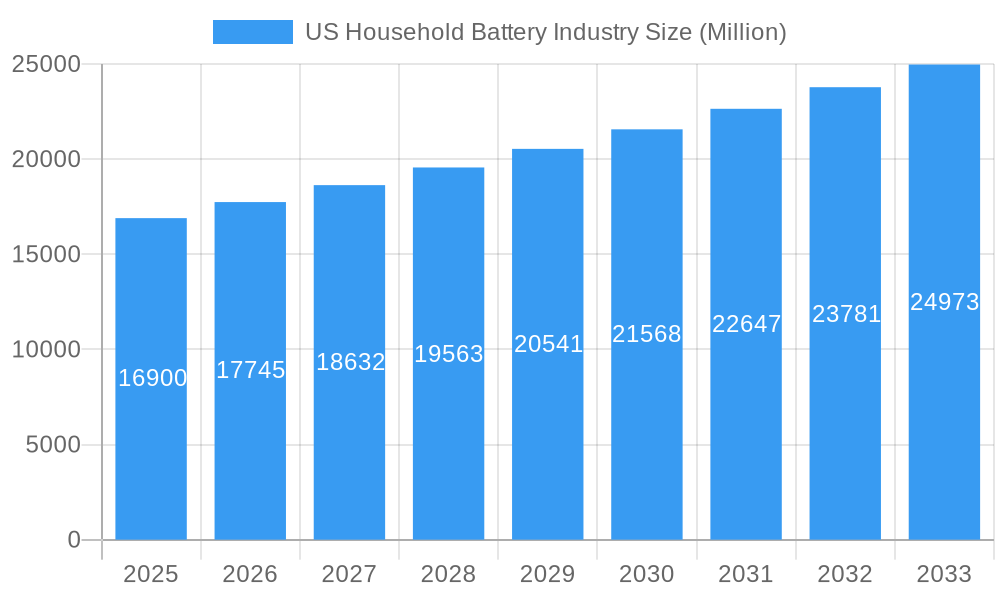
The US Household Battery Industry is projected to experience significant expansion, with an estimated market size of $16.04 billion by 2025. This sector is forecast to grow at a Compound Annual Growth Rate (CAGR) of 10.3%, driven by evolving consumer demands and technological innovation. Key growth factors include the increasing adoption of portable electronics, a rising need for home backup power solutions, and the continuous demand for dependable energy in daily applications. The expansion of smart home technology, requiring consistent power for connected devices, and a growing preference for rechargeable, cost-effective, and environmentally conscious battery options are also propelling market growth.
US Household Battery Industry Market Size (In Billion)
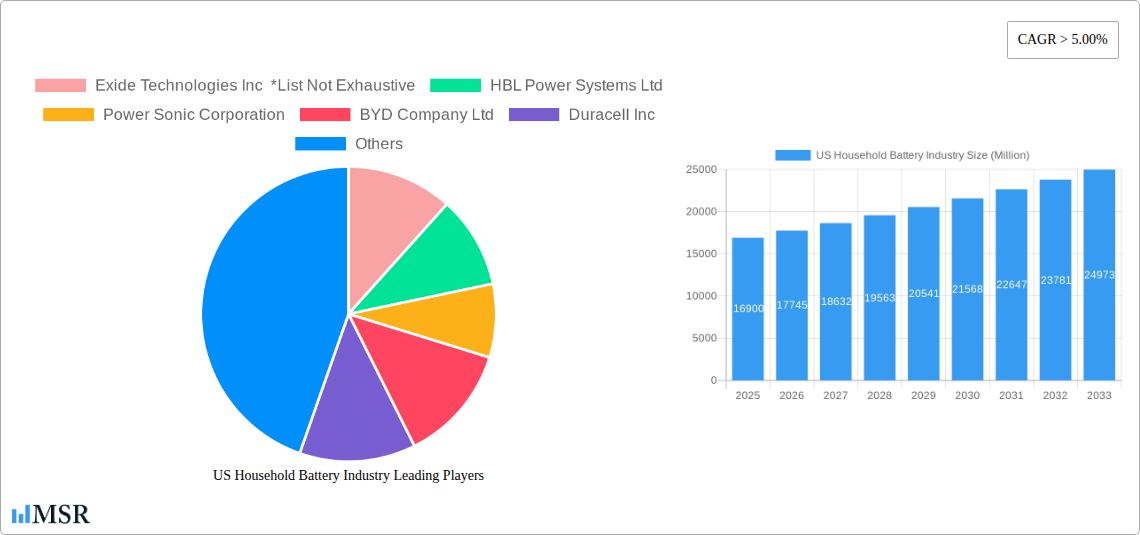
The market is segmented by battery chemistry. Lithium-ion batteries dominate due to their high energy density, extended lifespan, and rapid charging, making them essential for high-demand devices and new applications. Alkaline batteries maintain a substantial share for low-drain devices, offering a practical balance of performance and cost. While established, lead-acid batteries are seeing a transition in the household segment to newer chemistries, though they remain relevant for specific backup power needs. The competitive landscape includes established players like Energizer Holdings Inc., Duracell Inc., and Panasonic Corporation, alongside innovators such as BYD Company Ltd. Success in this dynamic market hinges on product innovation, sustainability, and advanced power solutions, with strategic collaborations and R&D being vital for market share growth.
US Household Battery Industry Company Market Share
Unlocking the Power: A Comprehensive Report on the US Household Battery Industry
Gain critical insights into the dynamic US household battery market with this in-depth report. Covering the historical period of 2019–2024 and projecting growth through 2033, this analysis provides essential data for manufacturers, investors, policymakers, and end-users. We dissect market concentration, explore industry trends, highlight key segments and players, and identify challenges and opportunities shaping the future of battery power in American homes.
US Household Battery Industry Market Concentration & Dynamics
The US household battery industry exhibits a moderately concentrated market landscape, with a few dominant players vying for market share. Innovation ecosystems are rapidly evolving, driven by advancements in lithium-ion technology and the growing demand for sustainable energy storage solutions. Regulatory frameworks, particularly those supporting clean energy and domestic manufacturing, are significantly influencing market dynamics. Substitute products, such as rechargeable battery alternatives and advancements in power-efficient electronics, pose a continuous challenge to traditional battery sales. End-user trends indicate a growing preference for longer-lasting, high-performance batteries and a heightened awareness of environmental impact. Merger and acquisition (M&A) activities, while not exceptionally high in recent years, are anticipated to increase as companies seek to consolidate market position, acquire novel technologies, or secure supply chain advantages. For instance, strategic partnerships and smaller acquisitions focused on specialized battery chemistries are becoming more prevalent. The market share distribution is influenced by the performance and cost-effectiveness of different battery chemistries.
US Household Battery Industry Industry Insights & Trends
The US household battery industry is poised for robust growth, fueled by an escalating demand for portable power solutions across a myriad of consumer electronics and emerging smart home applications. The market size is estimated to reach approximately USD 6.5 Billion in 2025, with a projected Compound Annual Growth Rate (CAGR) of 4.8% during the forecast period of 2025–2033. Technological disruptions, particularly the ongoing refinement of lithium-ion battery technology offering higher energy density, faster charging capabilities, and improved safety, are key drivers. Furthermore, the increasing adoption of electric vehicles (EVs) and the expansion of renewable energy storage systems for residential use are creating significant spillover effects and driving innovation in battery manufacturing and recycling. Evolving consumer behaviors, characterized by a greater emphasis on convenience, sustainability, and smart device integration, are reshaping product demand. Consumers are increasingly seeking rechargeable batteries to reduce waste and long-term costs, and there is a growing interest in batteries that can power increasingly sophisticated and energy-intensive devices, from high-definition entertainment systems to advanced home security and automation systems. The transition towards a more electrified economy across various sectors, including automotive and consumer electronics, underpins the consistent upward trajectory of the household battery market. The demand for batteries extends beyond traditional uses into the burgeoning Internet of Things (IoT) ecosystem, where a vast network of smart sensors and devices requires reliable and long-lasting power sources. The push towards miniaturization and increased power efficiency in electronic devices also necessitates advancements in battery technology to meet these evolving requirements.
Key Markets & Segments Leading US Household Battery Industry
The Lithium-ion Batteries segment is unequivocally the dominant force driving growth within the US household battery industry. This dominance is attributable to their superior energy density, longer lifespan, and rapid charging capabilities, making them ideal for a wide range of modern electronic devices.
- Drivers for Lithium-ion Battery Dominance:
- Ubiquitous Consumer Electronics: The proliferation of smartphones, laptops, tablets, and wearable technology, all heavily reliant on lithium-ion power.
- Electric Vehicle (EV) Adoption: While distinct, the massive investment and consumer interest in EVs create a powerful ecosystem that drives down lithium-ion battery costs and spurs innovation applicable to other sectors.
- Renewable Energy Storage: Residential solar power systems increasingly utilize lithium-ion battery banks for energy storage, further boosting demand.
- Power Tools and Cordless Devices: The demand for portable, high-performance power tools and appliances directly translates to a need for advanced lithium-ion batteries.
The Alkaline Batteries segment, while a mature market, continues to hold a significant share due to its affordability and widespread availability for low-drain devices such as remote controls, clocks, and basic toys. However, its growth is being outpaced by lithium-ion technologies.
- Drivers for Alkaline Battery Relevance:
- Cost-Effectiveness: Remains the most economical choice for less demanding applications.
- Wide Availability: Ubiquitous in retail channels, ensuring easy consumer access.
- Established Infrastructure: Decades of market presence have solidified its place in consumer habits.
The Lead-acid Batteries segment, historically significant for backup power and automotive applications, is seeing a gradual shift. While still vital for uninterruptible power supplies (UPS) and some stationary applications, its presence in consumer electronics is diminishing.
- Drivers for Lead-acid Battery Niche:
- Established Infrastructure: Essential for backup power systems and some automotive needs.
- Cost-Effectiveness for Specific Applications: Remains competitive for high-current, short-duration power needs.
Other Types of batteries, including nickel-metal hydride (NiMH) and specialized chemistries, cater to specific niche applications but represent a smaller portion of the overall market.
US Household Battery Industry Product Developments
Recent product developments in the US household battery industry are marked by significant advancements in energy density, lifespan, and charging speeds, primarily within the lithium-ion sector. Innovations are focused on enhancing safety features, reducing internal resistance for improved performance, and developing more sustainable battery chemistries. Manufacturers are introducing batteries with higher milliampere-hour (mAh) ratings and improved discharge capabilities to support increasingly power-hungry devices. The trend towards miniaturization continues, with the development of smaller yet more potent battery cells for wearables and IoT devices. Furthermore, there's a growing emphasis on battery management systems (BMS) integrated into battery packs to optimize performance, extend lifespan, and ensure user safety. These technological leaps are driven by intense competition and the demand for reliable, long-lasting power sources for a connected world.
Challenges in the US Household Battery Industry Market
The US household battery industry faces several significant challenges that could impede growth and profitability. Supply chain disruptions, particularly for critical raw materials like lithium, cobalt, and nickel, continue to pose a substantial risk, leading to price volatility and potential production shortfalls. Regulatory hurdles related to battery recycling and disposal, while essential for environmental sustainability, can add complexity and cost to operations. Intense competitive pressures from both established global players and emerging domestic manufacturers drive down profit margins. Furthermore, consumer education regarding the benefits of advanced battery technologies and proper disposal methods remains a challenge.
Forces Driving US Household Battery Industry Growth
The US household battery industry's growth is propelled by a confluence of powerful forces. The technological advancement in battery chemistries, especially the increasing energy density and efficiency of lithium-ion batteries, is a primary catalyst. The economic expansion of the consumer electronics sector, coupled with the rapid adoption of smart home devices and the burgeoning electric vehicle market, creates an insatiable demand for reliable power sources. Government initiatives and incentives, such as those aimed at promoting domestic battery manufacturing and clean energy, are also significant growth accelerators.
Long-Term Growth Catalysts in the US Household Battery Industry Market
Long-term growth for the US household battery industry will be significantly influenced by sustained innovations in battery technology, including solid-state batteries and next-generation chemistries that promise even higher performance and safety. Strategic partnerships and vertical integration within the supply chain, from raw material sourcing to recycling, will be crucial for securing competitive advantages and ensuring supply stability. Market expansions into new applications, such as advanced medical devices and grid-scale energy storage, will further diversify revenue streams and drive sustained demand.
Emerging Opportunities in US Household Battery Industry
Emerging opportunities within the US household battery industry are ripe for exploration. The burgeoning Internet of Things (IoT) market presents a vast and growing demand for small, long-lasting power sources. The increasing focus on sustainability and the circular economy opens avenues for advanced battery recycling technologies and the development of eco-friendly battery materials. Furthermore, the expansion of smart grid infrastructure and the integration of renewable energy sources in homes create a significant market for residential energy storage solutions. Consumer preferences are also shifting towards higher performance and specialized batteries, presenting opportunities for niche product development.
Leading Players in the US Household Battery Industry Sector
- Exide Technologies Inc
- HBL Power Systems Ltd
- Power Sonic Corporation
- BYD Company Ltd
- Duracell Inc
- Zeus Battery Products
- Energizer Holdings Inc
- Panasonic Corporation
- Rayovac (Spectrum Brands, Inc.)
- Sony Corporation
- Maxell Holdings, Ltd.
Key Milestones in US Household Battery Industry Industry
- December 2022: The US Department of Energy (DOE) announced the conclusion of a USD 2.5 billion loan to Ultium Cells LLC to assist in financing the building of new lithium-ion battery cell manufacturing facilities in Ohio, Tennessee, and Michigan through its Loan Programs Office (LPO). The three facilities will be managed by Ultium Cells, a joint venture between General Motors and LG Energy Solution. This milestone significantly bolsters domestic lithium-ion battery production capacity and supply chain resilience.
- August 2022: President Biden signed the Inflation Reduction Act (IRA) into law. Over USD 60 billion for American manufacturing across the clean energy supply chain is included in the IRA, including USD 30 billion in production tax credits to stimulate domestic manufacturing of solar panels, wind turbines, batteries, and essential minerals processing. This landmark legislation is a powerful catalyst for increasing domestic battery manufacturing and innovation.
Strategic Outlook for US Household Battery Industry Market
The strategic outlook for the US household battery industry is overwhelmingly positive, driven by sustained technological innovation and robust market demand. Growth accelerators will include increased government investment in domestic battery manufacturing, the rapid adoption of electric vehicles, and the expanding integration of renewable energy solutions into residential settings. Companies that focus on developing advanced lithium-ion chemistries, securing resilient supply chains, and investing in efficient recycling processes will be best positioned for long-term success. The industry is set for a transformative period, offering significant opportunities for market expansion and value creation.
US Household Battery Industry Segmentation
- 1. Alkaline Batteries
- 2. Lead-acid Batteries
- 3. Lithium-ion Batteries
- 4. Other Types
US Household Battery Industry Segmentation By Geography
-
1. North America
- 1.1. United States
- 1.2. Canada
- 1.3. Mexico
-
2. South America
- 2.1. Brazil
- 2.2. Argentina
- 2.3. Rest of South America
-
3. Europe
- 3.1. United Kingdom
- 3.2. Germany
- 3.3. France
- 3.4. Italy
- 3.5. Spain
- 3.6. Russia
- 3.7. Benelux
- 3.8. Nordics
- 3.9. Rest of Europe
-
4. Middle East & Africa
- 4.1. Turkey
- 4.2. Israel
- 4.3. GCC
- 4.4. North Africa
- 4.5. South Africa
- 4.6. Rest of Middle East & Africa
-
5. Asia Pacific
- 5.1. China
- 5.2. India
- 5.3. Japan
- 5.4. South Korea
- 5.5. ASEAN
- 5.6. Oceania
- 5.7. Rest of Asia Pacific
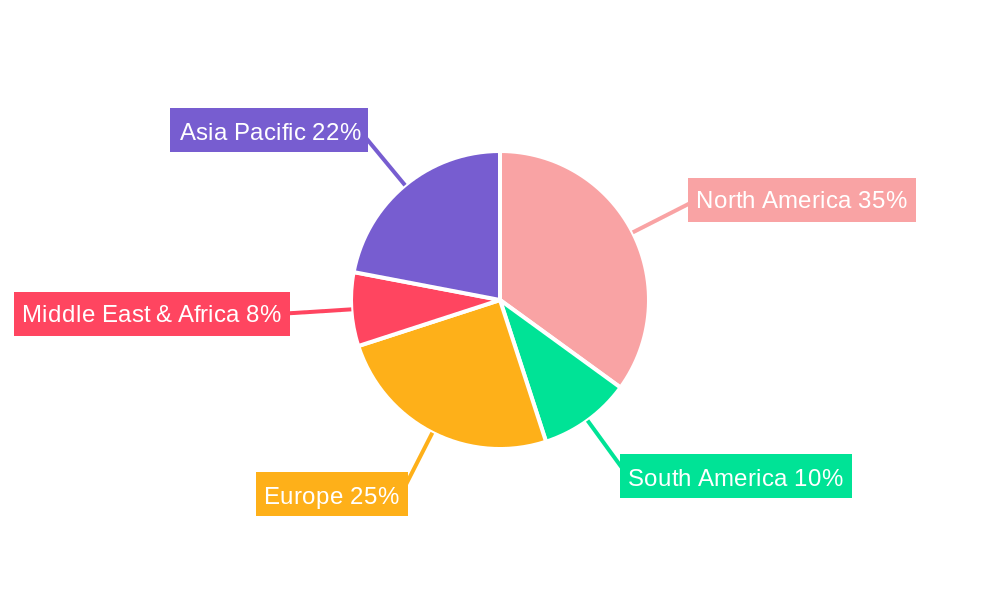
US Household Battery Industry Regional Market Share
Geographic Coverage of US Household Battery Industry
US Household Battery Industry REPORT HIGHLIGHTS
| Aspects | Details |
|---|---|
| Study Period | 2020-2034 |
| Base Year | 2025 |
| Estimated Year | 2026 |
| Forecast Period | 2026-2034 |
| Historical Period | 2020-2025 |
| Growth Rate | CAGR of 10.3% from 2020-2034 |
| Segmentation |
|
Table of Contents
- 1. Introduction
- 1.1. Research Scope
- 1.2. Market Segmentation
- 1.3. Research Objective
- 1.4. Definitions and Assumptions
- 2. Executive Summary
- 2.1. Market Snapshot
- 3. Market Dynamics
- 3.1. Market Drivers
- 3.2. Market Restrains
- 3.3. Market Trends
- 3.4. Market Opportunities
- 4. Market Factor Analysis
- 4.1. Porters Five Forces
- 4.1.1. Bargaining Power of Suppliers
- 4.1.2. Bargaining Power of Buyers
- 4.1.3. Threat of New Entrants
- 4.1.4. Threat of Substitutes
- 4.1.5. Competitive Rivalry
- 4.2. PESTEL analysis
- 4.3. BCG Analysis
- 4.3.1. Stars (High Growth, High Market Share)
- 4.3.2. Cash Cows (Low Growth, High Market Share)
- 4.3.3. Question Mark (High Growth, Low Market Share)
- 4.3.4. Dogs (Low Growth, Low Market Share)
- 4.4. Ansoff Matrix Analysis
- 4.5. Supply Chain Analysis
- 4.6. Regulatory Landscape
- 4.7. Current Market Potential and Opportunity Assessment (TAM–SAM–SOM Framework)
- 4.8. MSR Analyst Note
- 4.1. Porters Five Forces
- 5. Market Analysis, Insights and Forecast 2021-2033
- 5.1. Market Analysis, Insights and Forecast - by Alkaline Batteries
- 5.2. Market Analysis, Insights and Forecast - by Lead-acid Batteries
- 5.3. Market Analysis, Insights and Forecast - by Lithium-ion Batteries
- 5.4. Market Analysis, Insights and Forecast - by Other Types
- 5.5. Market Analysis, Insights and Forecast - by Region
- 5.5.1. North America
- 5.5.2. South America
- 5.5.3. Europe
- 5.5.4. Middle East & Africa
- 5.5.5. Asia Pacific
- 6. Global US Household Battery Industry Analysis, Insights and Forecast, 2021-2033
- 6.1. Market Analysis, Insights and Forecast - by Alkaline Batteries
- 6.2. Market Analysis, Insights and Forecast - by Lead-acid Batteries
- 6.3. Market Analysis, Insights and Forecast - by Lithium-ion Batteries
- 6.4. Market Analysis, Insights and Forecast - by Other Types
- 7. North America US Household Battery Industry Analysis, Insights and Forecast, 2020-2032
- 7.1. Market Analysis, Insights and Forecast - by Alkaline Batteries
- 7.2. Market Analysis, Insights and Forecast - by Lead-acid Batteries
- 7.3. Market Analysis, Insights and Forecast - by Lithium-ion Batteries
- 7.4. Market Analysis, Insights and Forecast - by Other Types
- 8. South America US Household Battery Industry Analysis, Insights and Forecast, 2020-2032
- 8.1. Market Analysis, Insights and Forecast - by Alkaline Batteries
- 8.2. Market Analysis, Insights and Forecast - by Lead-acid Batteries
- 8.3. Market Analysis, Insights and Forecast - by Lithium-ion Batteries
- 8.4. Market Analysis, Insights and Forecast - by Other Types
- 9. Europe US Household Battery Industry Analysis, Insights and Forecast, 2020-2032
- 9.1. Market Analysis, Insights and Forecast - by Alkaline Batteries
- 9.2. Market Analysis, Insights and Forecast - by Lead-acid Batteries
- 9.3. Market Analysis, Insights and Forecast - by Lithium-ion Batteries
- 9.4. Market Analysis, Insights and Forecast - by Other Types
- 10. Middle East & Africa US Household Battery Industry Analysis, Insights and Forecast, 2020-2032
- 10.1. Market Analysis, Insights and Forecast - by Alkaline Batteries
- 10.2. Market Analysis, Insights and Forecast - by Lead-acid Batteries
- 10.3. Market Analysis, Insights and Forecast - by Lithium-ion Batteries
- 10.4. Market Analysis, Insights and Forecast - by Other Types
- 11. Asia Pacific US Household Battery Industry Analysis, Insights and Forecast, 2020-2032
- 11.1. Market Analysis, Insights and Forecast - by Alkaline Batteries
- 11.2. Market Analysis, Insights and Forecast - by Lead-acid Batteries
- 11.3. Market Analysis, Insights and Forecast - by Lithium-ion Batteries
- 11.4. Market Analysis, Insights and Forecast - by Other Types
- 12. Competitive Analysis
- 12.1. Company Profiles
- 12.1.1 Exide Technologies Inc *List Not Exhaustive
- 12.1.1.1. Company Overview
- 12.1.1.2. Products
- 12.1.1.3. Company Financials
- 12.1.1.4. SWOT Analysis
- 12.1.2 HBL Power Systems Ltd
- 12.1.2.1. Company Overview
- 12.1.2.2. Products
- 12.1.2.3. Company Financials
- 12.1.2.4. SWOT Analysis
- 12.1.3 Power Sonic Corporation
- 12.1.3.1. Company Overview
- 12.1.3.2. Products
- 12.1.3.3. Company Financials
- 12.1.3.4. SWOT Analysis
- 12.1.4 BYD Company Ltd
- 12.1.4.1. Company Overview
- 12.1.4.2. Products
- 12.1.4.3. Company Financials
- 12.1.4.4. SWOT Analysis
- 12.1.5 Duracell Inc
- 12.1.5.1. Company Overview
- 12.1.5.2. Products
- 12.1.5.3. Company Financials
- 12.1.5.4. SWOT Analysis
- 12.1.6 Zeus Battery Products
- 12.1.6.1. Company Overview
- 12.1.6.2. Products
- 12.1.6.3. Company Financials
- 12.1.6.4. SWOT Analysis
- 12.1.7 Energizer Holdings Inc
- 12.1.7.1. Company Overview
- 12.1.7.2. Products
- 12.1.7.3. Company Financials
- 12.1.7.4. SWOT Analysis
- 12.1.8 Panasonic Corporation
- 12.1.8.1. Company Overview
- 12.1.8.2. Products
- 12.1.8.3. Company Financials
- 12.1.8.4. SWOT Analysis
- 12.1.9 Rayovac (Spectrum Brands Inc.)
- 12.1.9.1. Company Overview
- 12.1.9.2. Products
- 12.1.9.3. Company Financials
- 12.1.9.4. SWOT Analysis
- 12.1.10 Sony Corporation
- 12.1.10.1. Company Overview
- 12.1.10.2. Products
- 12.1.10.3. Company Financials
- 12.1.10.4. SWOT Analysis
- 12.1.11 Maxell Holdings Ltd.
- 12.1.11.1. Company Overview
- 12.1.11.2. Products
- 12.1.11.3. Company Financials
- 12.1.11.4. SWOT Analysis
- 12.1.1 Exide Technologies Inc *List Not Exhaustive
- 12.2. Market Entropy
- 12.2.1 Company's Key Areas Served
- 12.2.2 Recent Developments
- 12.3. Company Market Share Analysis 2025
- 12.3.1 Top 5 Companies Market Share Analysis
- 12.3.2 Top 3 Companies Market Share Analysis
- 12.4. List of Potential Customers
- 13. Research Methodology
List of Figures
- Figure 1: Global US Household Battery Industry Revenue Breakdown (billion, %) by Region 2025 & 2033
- Figure 2: Global US Household Battery Industry Volume Breakdown (K Tons, %) by Region 2025 & 2033
- Figure 3: North America US Household Battery Industry Revenue (billion), by Alkaline Batteries 2025 & 2033
- Figure 4: North America US Household Battery Industry Volume (K Tons), by Alkaline Batteries 2025 & 2033
- Figure 5: North America US Household Battery Industry Revenue Share (%), by Alkaline Batteries 2025 & 2033
- Figure 6: North America US Household Battery Industry Volume Share (%), by Alkaline Batteries 2025 & 2033
- Figure 7: North America US Household Battery Industry Revenue (billion), by Lead-acid Batteries 2025 & 2033
- Figure 8: North America US Household Battery Industry Volume (K Tons), by Lead-acid Batteries 2025 & 2033
- Figure 9: North America US Household Battery Industry Revenue Share (%), by Lead-acid Batteries 2025 & 2033
- Figure 10: North America US Household Battery Industry Volume Share (%), by Lead-acid Batteries 2025 & 2033
- Figure 11: North America US Household Battery Industry Revenue (billion), by Lithium-ion Batteries 2025 & 2033
- Figure 12: North America US Household Battery Industry Volume (K Tons), by Lithium-ion Batteries 2025 & 2033
- Figure 13: North America US Household Battery Industry Revenue Share (%), by Lithium-ion Batteries 2025 & 2033
- Figure 14: North America US Household Battery Industry Volume Share (%), by Lithium-ion Batteries 2025 & 2033
- Figure 15: North America US Household Battery Industry Revenue (billion), by Other Types 2025 & 2033
- Figure 16: North America US Household Battery Industry Volume (K Tons), by Other Types 2025 & 2033
- Figure 17: North America US Household Battery Industry Revenue Share (%), by Other Types 2025 & 2033
- Figure 18: North America US Household Battery Industry Volume Share (%), by Other Types 2025 & 2033
- Figure 19: North America US Household Battery Industry Revenue (billion), by Country 2025 & 2033
- Figure 20: North America US Household Battery Industry Volume (K Tons), by Country 2025 & 2033
- Figure 21: North America US Household Battery Industry Revenue Share (%), by Country 2025 & 2033
- Figure 22: North America US Household Battery Industry Volume Share (%), by Country 2025 & 2033
- Figure 23: South America US Household Battery Industry Revenue (billion), by Alkaline Batteries 2025 & 2033
- Figure 24: South America US Household Battery Industry Volume (K Tons), by Alkaline Batteries 2025 & 2033
- Figure 25: South America US Household Battery Industry Revenue Share (%), by Alkaline Batteries 2025 & 2033
- Figure 26: South America US Household Battery Industry Volume Share (%), by Alkaline Batteries 2025 & 2033
- Figure 27: South America US Household Battery Industry Revenue (billion), by Lead-acid Batteries 2025 & 2033
- Figure 28: South America US Household Battery Industry Volume (K Tons), by Lead-acid Batteries 2025 & 2033
- Figure 29: South America US Household Battery Industry Revenue Share (%), by Lead-acid Batteries 2025 & 2033
- Figure 30: South America US Household Battery Industry Volume Share (%), by Lead-acid Batteries 2025 & 2033
- Figure 31: South America US Household Battery Industry Revenue (billion), by Lithium-ion Batteries 2025 & 2033
- Figure 32: South America US Household Battery Industry Volume (K Tons), by Lithium-ion Batteries 2025 & 2033
- Figure 33: South America US Household Battery Industry Revenue Share (%), by Lithium-ion Batteries 2025 & 2033
- Figure 34: South America US Household Battery Industry Volume Share (%), by Lithium-ion Batteries 2025 & 2033
- Figure 35: South America US Household Battery Industry Revenue (billion), by Other Types 2025 & 2033
- Figure 36: South America US Household Battery Industry Volume (K Tons), by Other Types 2025 & 2033
- Figure 37: South America US Household Battery Industry Revenue Share (%), by Other Types 2025 & 2033
- Figure 38: South America US Household Battery Industry Volume Share (%), by Other Types 2025 & 2033
- Figure 39: South America US Household Battery Industry Revenue (billion), by Country 2025 & 2033
- Figure 40: South America US Household Battery Industry Volume (K Tons), by Country 2025 & 2033
- Figure 41: South America US Household Battery Industry Revenue Share (%), by Country 2025 & 2033
- Figure 42: South America US Household Battery Industry Volume Share (%), by Country 2025 & 2033
- Figure 43: Europe US Household Battery Industry Revenue (billion), by Alkaline Batteries 2025 & 2033
- Figure 44: Europe US Household Battery Industry Volume (K Tons), by Alkaline Batteries 2025 & 2033
- Figure 45: Europe US Household Battery Industry Revenue Share (%), by Alkaline Batteries 2025 & 2033
- Figure 46: Europe US Household Battery Industry Volume Share (%), by Alkaline Batteries 2025 & 2033
- Figure 47: Europe US Household Battery Industry Revenue (billion), by Lead-acid Batteries 2025 & 2033
- Figure 48: Europe US Household Battery Industry Volume (K Tons), by Lead-acid Batteries 2025 & 2033
- Figure 49: Europe US Household Battery Industry Revenue Share (%), by Lead-acid Batteries 2025 & 2033
- Figure 50: Europe US Household Battery Industry Volume Share (%), by Lead-acid Batteries 2025 & 2033
- Figure 51: Europe US Household Battery Industry Revenue (billion), by Lithium-ion Batteries 2025 & 2033
- Figure 52: Europe US Household Battery Industry Volume (K Tons), by Lithium-ion Batteries 2025 & 2033
- Figure 53: Europe US Household Battery Industry Revenue Share (%), by Lithium-ion Batteries 2025 & 2033
- Figure 54: Europe US Household Battery Industry Volume Share (%), by Lithium-ion Batteries 2025 & 2033
- Figure 55: Europe US Household Battery Industry Revenue (billion), by Other Types 2025 & 2033
- Figure 56: Europe US Household Battery Industry Volume (K Tons), by Other Types 2025 & 2033
- Figure 57: Europe US Household Battery Industry Revenue Share (%), by Other Types 2025 & 2033
- Figure 58: Europe US Household Battery Industry Volume Share (%), by Other Types 2025 & 2033
- Figure 59: Europe US Household Battery Industry Revenue (billion), by Country 2025 & 2033
- Figure 60: Europe US Household Battery Industry Volume (K Tons), by Country 2025 & 2033
- Figure 61: Europe US Household Battery Industry Revenue Share (%), by Country 2025 & 2033
- Figure 62: Europe US Household Battery Industry Volume Share (%), by Country 2025 & 2033
- Figure 63: Middle East & Africa US Household Battery Industry Revenue (billion), by Alkaline Batteries 2025 & 2033
- Figure 64: Middle East & Africa US Household Battery Industry Volume (K Tons), by Alkaline Batteries 2025 & 2033
- Figure 65: Middle East & Africa US Household Battery Industry Revenue Share (%), by Alkaline Batteries 2025 & 2033
- Figure 66: Middle East & Africa US Household Battery Industry Volume Share (%), by Alkaline Batteries 2025 & 2033
- Figure 67: Middle East & Africa US Household Battery Industry Revenue (billion), by Lead-acid Batteries 2025 & 2033
- Figure 68: Middle East & Africa US Household Battery Industry Volume (K Tons), by Lead-acid Batteries 2025 & 2033
- Figure 69: Middle East & Africa US Household Battery Industry Revenue Share (%), by Lead-acid Batteries 2025 & 2033
- Figure 70: Middle East & Africa US Household Battery Industry Volume Share (%), by Lead-acid Batteries 2025 & 2033
- Figure 71: Middle East & Africa US Household Battery Industry Revenue (billion), by Lithium-ion Batteries 2025 & 2033
- Figure 72: Middle East & Africa US Household Battery Industry Volume (K Tons), by Lithium-ion Batteries 2025 & 2033
- Figure 73: Middle East & Africa US Household Battery Industry Revenue Share (%), by Lithium-ion Batteries 2025 & 2033
- Figure 74: Middle East & Africa US Household Battery Industry Volume Share (%), by Lithium-ion Batteries 2025 & 2033
- Figure 75: Middle East & Africa US Household Battery Industry Revenue (billion), by Other Types 2025 & 2033
- Figure 76: Middle East & Africa US Household Battery Industry Volume (K Tons), by Other Types 2025 & 2033
- Figure 77: Middle East & Africa US Household Battery Industry Revenue Share (%), by Other Types 2025 & 2033
- Figure 78: Middle East & Africa US Household Battery Industry Volume Share (%), by Other Types 2025 & 2033
- Figure 79: Middle East & Africa US Household Battery Industry Revenue (billion), by Country 2025 & 2033
- Figure 80: Middle East & Africa US Household Battery Industry Volume (K Tons), by Country 2025 & 2033
- Figure 81: Middle East & Africa US Household Battery Industry Revenue Share (%), by Country 2025 & 2033
- Figure 82: Middle East & Africa US Household Battery Industry Volume Share (%), by Country 2025 & 2033
- Figure 83: Asia Pacific US Household Battery Industry Revenue (billion), by Alkaline Batteries 2025 & 2033
- Figure 84: Asia Pacific US Household Battery Industry Volume (K Tons), by Alkaline Batteries 2025 & 2033
- Figure 85: Asia Pacific US Household Battery Industry Revenue Share (%), by Alkaline Batteries 2025 & 2033
- Figure 86: Asia Pacific US Household Battery Industry Volume Share (%), by Alkaline Batteries 2025 & 2033
- Figure 87: Asia Pacific US Household Battery Industry Revenue (billion), by Lead-acid Batteries 2025 & 2033
- Figure 88: Asia Pacific US Household Battery Industry Volume (K Tons), by Lead-acid Batteries 2025 & 2033
- Figure 89: Asia Pacific US Household Battery Industry Revenue Share (%), by Lead-acid Batteries 2025 & 2033
- Figure 90: Asia Pacific US Household Battery Industry Volume Share (%), by Lead-acid Batteries 2025 & 2033
- Figure 91: Asia Pacific US Household Battery Industry Revenue (billion), by Lithium-ion Batteries 2025 & 2033
- Figure 92: Asia Pacific US Household Battery Industry Volume (K Tons), by Lithium-ion Batteries 2025 & 2033
- Figure 93: Asia Pacific US Household Battery Industry Revenue Share (%), by Lithium-ion Batteries 2025 & 2033
- Figure 94: Asia Pacific US Household Battery Industry Volume Share (%), by Lithium-ion Batteries 2025 & 2033
- Figure 95: Asia Pacific US Household Battery Industry Revenue (billion), by Other Types 2025 & 2033
- Figure 96: Asia Pacific US Household Battery Industry Volume (K Tons), by Other Types 2025 & 2033
- Figure 97: Asia Pacific US Household Battery Industry Revenue Share (%), by Other Types 2025 & 2033
- Figure 98: Asia Pacific US Household Battery Industry Volume Share (%), by Other Types 2025 & 2033
- Figure 99: Asia Pacific US Household Battery Industry Revenue (billion), by Country 2025 & 2033
- Figure 100: Asia Pacific US Household Battery Industry Volume (K Tons), by Country 2025 & 2033
- Figure 101: Asia Pacific US Household Battery Industry Revenue Share (%), by Country 2025 & 2033
- Figure 102: Asia Pacific US Household Battery Industry Volume Share (%), by Country 2025 & 2033
List of Tables
- Table 1: Global US Household Battery Industry Revenue billion Forecast, by Alkaline Batteries 2020 & 2033
- Table 2: Global US Household Battery Industry Volume K Tons Forecast, by Alkaline Batteries 2020 & 2033
- Table 3: Global US Household Battery Industry Revenue billion Forecast, by Lead-acid Batteries 2020 & 2033
- Table 4: Global US Household Battery Industry Volume K Tons Forecast, by Lead-acid Batteries 2020 & 2033
- Table 5: Global US Household Battery Industry Revenue billion Forecast, by Lithium-ion Batteries 2020 & 2033
- Table 6: Global US Household Battery Industry Volume K Tons Forecast, by Lithium-ion Batteries 2020 & 2033
- Table 7: Global US Household Battery Industry Revenue billion Forecast, by Other Types 2020 & 2033
- Table 8: Global US Household Battery Industry Volume K Tons Forecast, by Other Types 2020 & 2033
- Table 9: Global US Household Battery Industry Revenue billion Forecast, by Region 2020 & 2033
- Table 10: Global US Household Battery Industry Volume K Tons Forecast, by Region 2020 & 2033
- Table 11: Global US Household Battery Industry Revenue billion Forecast, by Alkaline Batteries 2020 & 2033
- Table 12: Global US Household Battery Industry Volume K Tons Forecast, by Alkaline Batteries 2020 & 2033
- Table 13: Global US Household Battery Industry Revenue billion Forecast, by Lead-acid Batteries 2020 & 2033
- Table 14: Global US Household Battery Industry Volume K Tons Forecast, by Lead-acid Batteries 2020 & 2033
- Table 15: Global US Household Battery Industry Revenue billion Forecast, by Lithium-ion Batteries 2020 & 2033
- Table 16: Global US Household Battery Industry Volume K Tons Forecast, by Lithium-ion Batteries 2020 & 2033
- Table 17: Global US Household Battery Industry Revenue billion Forecast, by Other Types 2020 & 2033
- Table 18: Global US Household Battery Industry Volume K Tons Forecast, by Other Types 2020 & 2033
- Table 19: Global US Household Battery Industry Revenue billion Forecast, by Country 2020 & 2033
- Table 20: Global US Household Battery Industry Volume K Tons Forecast, by Country 2020 & 2033
- Table 21: United States US Household Battery Industry Revenue (billion) Forecast, by Application 2020 & 2033
- Table 22: United States US Household Battery Industry Volume (K Tons) Forecast, by Application 2020 & 2033
- Table 23: Canada US Household Battery Industry Revenue (billion) Forecast, by Application 2020 & 2033
- Table 24: Canada US Household Battery Industry Volume (K Tons) Forecast, by Application 2020 & 2033
- Table 25: Mexico US Household Battery Industry Revenue (billion) Forecast, by Application 2020 & 2033
- Table 26: Mexico US Household Battery Industry Volume (K Tons) Forecast, by Application 2020 & 2033
- Table 27: Global US Household Battery Industry Revenue billion Forecast, by Alkaline Batteries 2020 & 2033
- Table 28: Global US Household Battery Industry Volume K Tons Forecast, by Alkaline Batteries 2020 & 2033
- Table 29: Global US Household Battery Industry Revenue billion Forecast, by Lead-acid Batteries 2020 & 2033
- Table 30: Global US Household Battery Industry Volume K Tons Forecast, by Lead-acid Batteries 2020 & 2033
- Table 31: Global US Household Battery Industry Revenue billion Forecast, by Lithium-ion Batteries 2020 & 2033
- Table 32: Global US Household Battery Industry Volume K Tons Forecast, by Lithium-ion Batteries 2020 & 2033
- Table 33: Global US Household Battery Industry Revenue billion Forecast, by Other Types 2020 & 2033
- Table 34: Global US Household Battery Industry Volume K Tons Forecast, by Other Types 2020 & 2033
- Table 35: Global US Household Battery Industry Revenue billion Forecast, by Country 2020 & 2033
- Table 36: Global US Household Battery Industry Volume K Tons Forecast, by Country 2020 & 2033
- Table 37: Brazil US Household Battery Industry Revenue (billion) Forecast, by Application 2020 & 2033
- Table 38: Brazil US Household Battery Industry Volume (K Tons) Forecast, by Application 2020 & 2033
- Table 39: Argentina US Household Battery Industry Revenue (billion) Forecast, by Application 2020 & 2033
- Table 40: Argentina US Household Battery Industry Volume (K Tons) Forecast, by Application 2020 & 2033
- Table 41: Rest of South America US Household Battery Industry Revenue (billion) Forecast, by Application 2020 & 2033
- Table 42: Rest of South America US Household Battery Industry Volume (K Tons) Forecast, by Application 2020 & 2033
- Table 43: Global US Household Battery Industry Revenue billion Forecast, by Alkaline Batteries 2020 & 2033
- Table 44: Global US Household Battery Industry Volume K Tons Forecast, by Alkaline Batteries 2020 & 2033
- Table 45: Global US Household Battery Industry Revenue billion Forecast, by Lead-acid Batteries 2020 & 2033
- Table 46: Global US Household Battery Industry Volume K Tons Forecast, by Lead-acid Batteries 2020 & 2033
- Table 47: Global US Household Battery Industry Revenue billion Forecast, by Lithium-ion Batteries 2020 & 2033
- Table 48: Global US Household Battery Industry Volume K Tons Forecast, by Lithium-ion Batteries 2020 & 2033
- Table 49: Global US Household Battery Industry Revenue billion Forecast, by Other Types 2020 & 2033
- Table 50: Global US Household Battery Industry Volume K Tons Forecast, by Other Types 2020 & 2033
- Table 51: Global US Household Battery Industry Revenue billion Forecast, by Country 2020 & 2033
- Table 52: Global US Household Battery Industry Volume K Tons Forecast, by Country 2020 & 2033
- Table 53: United Kingdom US Household Battery Industry Revenue (billion) Forecast, by Application 2020 & 2033
- Table 54: United Kingdom US Household Battery Industry Volume (K Tons) Forecast, by Application 2020 & 2033
- Table 55: Germany US Household Battery Industry Revenue (billion) Forecast, by Application 2020 & 2033
- Table 56: Germany US Household Battery Industry Volume (K Tons) Forecast, by Application 2020 & 2033
- Table 57: France US Household Battery Industry Revenue (billion) Forecast, by Application 2020 & 2033
- Table 58: France US Household Battery Industry Volume (K Tons) Forecast, by Application 2020 & 2033
- Table 59: Italy US Household Battery Industry Revenue (billion) Forecast, by Application 2020 & 2033
- Table 60: Italy US Household Battery Industry Volume (K Tons) Forecast, by Application 2020 & 2033
- Table 61: Spain US Household Battery Industry Revenue (billion) Forecast, by Application 2020 & 2033
- Table 62: Spain US Household Battery Industry Volume (K Tons) Forecast, by Application 2020 & 2033
- Table 63: Russia US Household Battery Industry Revenue (billion) Forecast, by Application 2020 & 2033
- Table 64: Russia US Household Battery Industry Volume (K Tons) Forecast, by Application 2020 & 2033
- Table 65: Benelux US Household Battery Industry Revenue (billion) Forecast, by Application 2020 & 2033
- Table 66: Benelux US Household Battery Industry Volume (K Tons) Forecast, by Application 2020 & 2033
- Table 67: Nordics US Household Battery Industry Revenue (billion) Forecast, by Application 2020 & 2033
- Table 68: Nordics US Household Battery Industry Volume (K Tons) Forecast, by Application 2020 & 2033
- Table 69: Rest of Europe US Household Battery Industry Revenue (billion) Forecast, by Application 2020 & 2033
- Table 70: Rest of Europe US Household Battery Industry Volume (K Tons) Forecast, by Application 2020 & 2033
- Table 71: Global US Household Battery Industry Revenue billion Forecast, by Alkaline Batteries 2020 & 2033
- Table 72: Global US Household Battery Industry Volume K Tons Forecast, by Alkaline Batteries 2020 & 2033
- Table 73: Global US Household Battery Industry Revenue billion Forecast, by Lead-acid Batteries 2020 & 2033
- Table 74: Global US Household Battery Industry Volume K Tons Forecast, by Lead-acid Batteries 2020 & 2033
- Table 75: Global US Household Battery Industry Revenue billion Forecast, by Lithium-ion Batteries 2020 & 2033
- Table 76: Global US Household Battery Industry Volume K Tons Forecast, by Lithium-ion Batteries 2020 & 2033
- Table 77: Global US Household Battery Industry Revenue billion Forecast, by Other Types 2020 & 2033
- Table 78: Global US Household Battery Industry Volume K Tons Forecast, by Other Types 2020 & 2033
- Table 79: Global US Household Battery Industry Revenue billion Forecast, by Country 2020 & 2033
- Table 80: Global US Household Battery Industry Volume K Tons Forecast, by Country 2020 & 2033
- Table 81: Turkey US Household Battery Industry Revenue (billion) Forecast, by Application 2020 & 2033
- Table 82: Turkey US Household Battery Industry Volume (K Tons) Forecast, by Application 2020 & 2033
- Table 83: Israel US Household Battery Industry Revenue (billion) Forecast, by Application 2020 & 2033
- Table 84: Israel US Household Battery Industry Volume (K Tons) Forecast, by Application 2020 & 2033
- Table 85: GCC US Household Battery Industry Revenue (billion) Forecast, by Application 2020 & 2033
- Table 86: GCC US Household Battery Industry Volume (K Tons) Forecast, by Application 2020 & 2033
- Table 87: North Africa US Household Battery Industry Revenue (billion) Forecast, by Application 2020 & 2033
- Table 88: North Africa US Household Battery Industry Volume (K Tons) Forecast, by Application 2020 & 2033
- Table 89: South Africa US Household Battery Industry Revenue (billion) Forecast, by Application 2020 & 2033
- Table 90: South Africa US Household Battery Industry Volume (K Tons) Forecast, by Application 2020 & 2033
- Table 91: Rest of Middle East & Africa US Household Battery Industry Revenue (billion) Forecast, by Application 2020 & 2033
- Table 92: Rest of Middle East & Africa US Household Battery Industry Volume (K Tons) Forecast, by Application 2020 & 2033
- Table 93: Global US Household Battery Industry Revenue billion Forecast, by Alkaline Batteries 2020 & 2033
- Table 94: Global US Household Battery Industry Volume K Tons Forecast, by Alkaline Batteries 2020 & 2033
- Table 95: Global US Household Battery Industry Revenue billion Forecast, by Lead-acid Batteries 2020 & 2033
- Table 96: Global US Household Battery Industry Volume K Tons Forecast, by Lead-acid Batteries 2020 & 2033
- Table 97: Global US Household Battery Industry Revenue billion Forecast, by Lithium-ion Batteries 2020 & 2033
- Table 98: Global US Household Battery Industry Volume K Tons Forecast, by Lithium-ion Batteries 2020 & 2033
- Table 99: Global US Household Battery Industry Revenue billion Forecast, by Other Types 2020 & 2033
- Table 100: Global US Household Battery Industry Volume K Tons Forecast, by Other Types 2020 & 2033
- Table 101: Global US Household Battery Industry Revenue billion Forecast, by Country 2020 & 2033
- Table 102: Global US Household Battery Industry Volume K Tons Forecast, by Country 2020 & 2033
- Table 103: China US Household Battery Industry Revenue (billion) Forecast, by Application 2020 & 2033
- Table 104: China US Household Battery Industry Volume (K Tons) Forecast, by Application 2020 & 2033
- Table 105: India US Household Battery Industry Revenue (billion) Forecast, by Application 2020 & 2033
- Table 106: India US Household Battery Industry Volume (K Tons) Forecast, by Application 2020 & 2033
- Table 107: Japan US Household Battery Industry Revenue (billion) Forecast, by Application 2020 & 2033
- Table 108: Japan US Household Battery Industry Volume (K Tons) Forecast, by Application 2020 & 2033
- Table 109: South Korea US Household Battery Industry Revenue (billion) Forecast, by Application 2020 & 2033
- Table 110: South Korea US Household Battery Industry Volume (K Tons) Forecast, by Application 2020 & 2033
- Table 111: ASEAN US Household Battery Industry Revenue (billion) Forecast, by Application 2020 & 2033
- Table 112: ASEAN US Household Battery Industry Volume (K Tons) Forecast, by Application 2020 & 2033
- Table 113: Oceania US Household Battery Industry Revenue (billion) Forecast, by Application 2020 & 2033
- Table 114: Oceania US Household Battery Industry Volume (K Tons) Forecast, by Application 2020 & 2033
- Table 115: Rest of Asia Pacific US Household Battery Industry Revenue (billion) Forecast, by Application 2020 & 2033
- Table 116: Rest of Asia Pacific US Household Battery Industry Volume (K Tons) Forecast, by Application 2020 & 2033
Frequently Asked Questions
1. What is the projected Compound Annual Growth Rate (CAGR) of the US Household Battery Industry?
The projected CAGR is approximately 10.3%.
2. Which companies are prominent players in the US Household Battery Industry?
Key companies in the market include Exide Technologies Inc *List Not Exhaustive, HBL Power Systems Ltd, Power Sonic Corporation, BYD Company Ltd, Duracell Inc, Zeus Battery Products, Energizer Holdings Inc, Panasonic Corporation, Rayovac (Spectrum Brands, Inc.) , Sony Corporation, Maxell Holdings, Ltd..
3. What are the main segments of the US Household Battery Industry?
The market segments include Alkaline Batteries, Lead-acid Batteries, Lithium-ion Batteries, Other Types.
4. Can you provide details about the market size?
The market size is estimated to be USD 16.04 billion as of 2022.
5. What are some drivers contributing to market growth?
4.; Increasing Investments in Water Treatment by Developing Countries4.; Growing Demand for the Various End-Use Sectors.
6. What are the notable trends driving market growth?
Lithium-Ion Battery to Dominate the Market.
7. Are there any restraints impacting market growth?
4.; Availability of Cheap and Alternative Pumps.
8. Can you provide examples of recent developments in the market?
December 2022: The US Department of Energy (DOE) announced the conclusion of a USD 2.5 billion loan to Ultium Cells LLC to assist in financing the building of new lithium-ion battery cell manufacturing facilities in Ohio, Tennessee, and Michigan through its Loan Programs Office (LPO). The three facilities will be managed by Ultium Cells, a joint venture between General Motors and LG Energy Solution.
9. What pricing options are available for accessing the report?
Pricing options include single-user, multi-user, and enterprise licenses priced at USD 3800, USD 4500, and USD 5800 respectively.
10. Is the market size provided in terms of value or volume?
The market size is provided in terms of value, measured in billion and volume, measured in K Tons.
11. Are there any specific market keywords associated with the report?
Yes, the market keyword associated with the report is "US Household Battery Industry," which aids in identifying and referencing the specific market segment covered.
12. How do I determine which pricing option suits my needs best?
The pricing options vary based on user requirements and access needs. Individual users may opt for single-user licenses, while businesses requiring broader access may choose multi-user or enterprise licenses for cost-effective access to the report.
13. Are there any additional resources or data provided in the US Household Battery Industry report?
While the report offers comprehensive insights, it's advisable to review the specific contents or supplementary materials provided to ascertain if additional resources or data are available.
14. How can I stay updated on further developments or reports in the US Household Battery Industry?
To stay informed about further developments, trends, and reports in the US Household Battery Industry, consider subscribing to industry newsletters, following relevant companies and organizations, or regularly checking reputable industry news sources and publications.
Methodology
Step 1 - Identification of Relevant Samples Size from Population Database


Step 2 - Approaches for Defining Global Market Size (Value, Volume* & Price*)

Note*: In applicable scenarios
Step 3 - Data Sources
Primary Research
- Web Analytics
- Survey Reports
- Research Institute
- Latest Research Reports
- Opinion Leaders
Secondary Research
- Annual Reports
- White Paper
- Latest Press Release
- Industry Association
- Paid Database
- Investor Presentations

Step 4 - Data Triangulation
Involves using different sources of information in order to increase the validity of a study
These sources are likely to be stakeholders in a program - participants, other researchers, program staff, other community members, and so on.
Then we put all data in single framework & apply various statistical tools to find out the dynamic on the market.
During the analysis stage, feedback from the stakeholder groups would be compared to determine areas of agreement as well as areas of divergence