

Key Insights
The global Busbar Trunking System market is poised for significant expansion, with a projected Compound Annual Growth Rate (CAGR) of 6.6%. This growth trajectory, forecast from a base year of 2025, is driven by increasing demand for advanced power distribution solutions in commercial and industrial sectors. Key growth catalysts include the need for higher power capacity, enhanced safety features, and the rising adoption of energy-efficient systems in data centers and manufacturing. The integration of renewable energy sources also necessitates efficient power distribution, further stimulating market development. The high-voltage busbar trunking segment is expected to lead growth due to its critical role in large-scale industrial installations and power grids. Geographically, while North America and Europe currently dominate due to established infrastructure and strict safety standards, the Asia-Pacific region is anticipated to experience the most rapid growth, propelled by rapid industrialization and urbanization, particularly in China and India. Potential challenges from material costs and supply chain volatility are being mitigated by continuous innovation in busbar trunking system design, focusing on thermal management and safety.
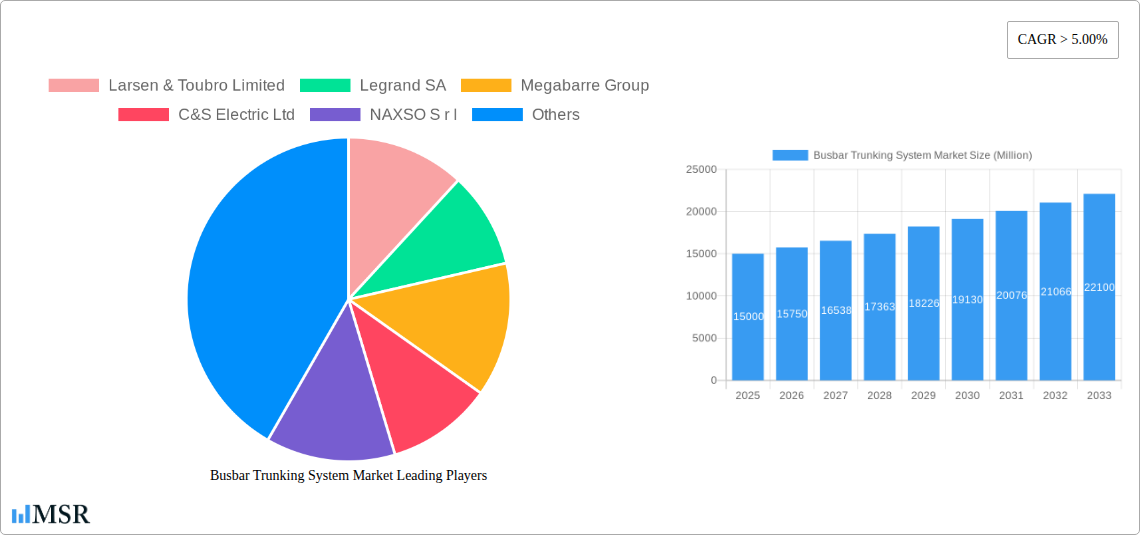
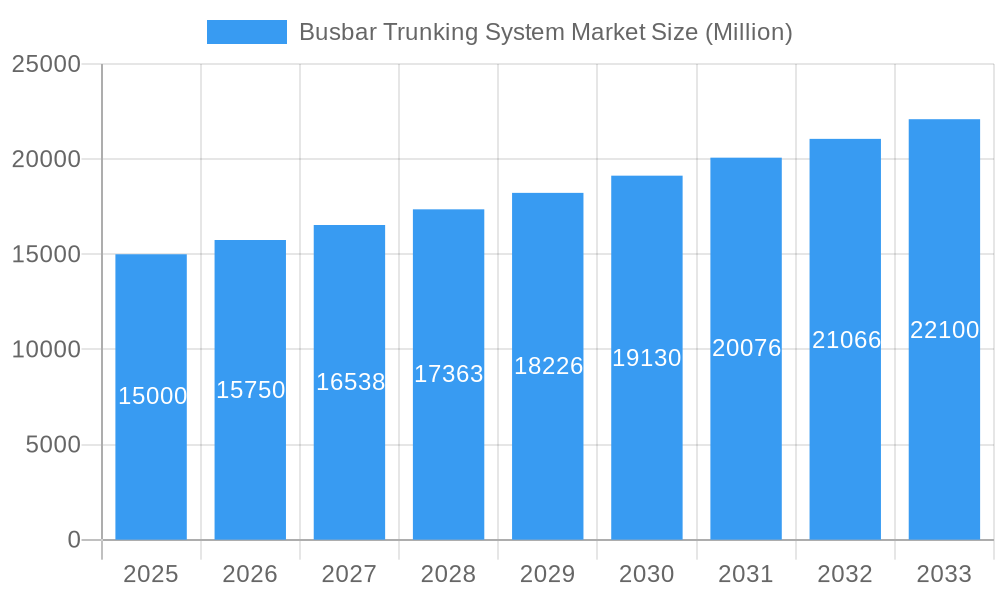
Busbar Trunking System Market Market Size (In Billion)
The competitive arena features prominent multinational corporations and specialized regional players. Leading entities such as Larsen & Toubro, Legrand, Siemens, Schneider Electric, and Eaton are actively investing in research and development to deliver cutting-edge and efficient busbar trunking systems. Their market leadership is attributed to robust brand recognition, expansive distribution channels, and diverse product offerings. Emerging specialized companies are also contributing to market dynamism with niche applications and innovative technologies. This competitive landscape fosters innovation and increases end-user options, driving market expansion. Future trends are influenced by a focus on sustainable manufacturing and the growing demand for smart grid technologies, indicating continued robust growth for the busbar trunking system market. The market size was valued at 7.1 billion in the base year 2025.
Busbar Trunking System Market Company Market Share
Dive Deep into the Thriving Busbar Trunking System Market: A Comprehensive Report (2019-2033)
This comprehensive report provides an in-depth analysis of the global Busbar Trunking System market, offering invaluable insights for stakeholders seeking to navigate this dynamic landscape. The study period spans from 2019 to 2033, with a base year of 2025 and a forecast period of 2025-2033. The report meticulously examines market size, growth drivers, technological advancements, competitive dynamics, and key segments, empowering informed decision-making. With a focus on crucial aspects like material (Aluminum, Copper), power rating (Lighting, Low Voltage, Medium Voltage, High Voltage), and end-user segments (Commercial, Industrial, Transportation, Residential), this report is an indispensable resource for understanding the current market scenario and future projections. The report values are presented in Millions.
Busbar Trunking System Market Market Concentration & Dynamics
The Busbar Trunking System market exhibits a moderately consolidated structure, with a few major players commanding significant market share. Market concentration is further influenced by factors such as technological innovation, stringent regulatory frameworks, the availability of substitute products, evolving end-user preferences, and ongoing mergers and acquisitions (M&A) activities. The global market share for the top 5 players is estimated at xx%, with further fragmentation amongst numerous smaller players. The M&A activity in the period 2019-2024 saw approximately xx deals, mostly focused on strategic acquisitions to expand geographical reach and product portfolios.
- Market Share: Top 5 players hold an estimated xx% market share (2024).
- M&A Activity: Approximately xx deals during 2019-2024.
- Regulatory Landscape: Stringent safety and environmental regulations influence market dynamics.
- Substitute Products: Competition from alternative power distribution systems influences market growth.
- End-User Trends: The increasing demand for efficient power distribution in commercial and industrial sectors is driving market growth.
Busbar Trunking System Market Industry Insights & Trends
The global Busbar Trunking System market is experiencing robust growth, with a Compound Annual Growth Rate (CAGR) estimated at xx% during the forecast period (2025-2033). This growth is fueled by several factors, including rising urbanization, expanding industrialization, and the increasing adoption of smart building technologies. Technological disruptions, such as the integration of smart sensors and remote monitoring capabilities, are further enhancing the functionality and efficiency of busbar trunking systems. Changing consumer behavior, particularly a preference for energy-efficient and sustainable solutions, is also a significant driving force. The global market size in 2025 is estimated at USD xx Million, projected to reach USD xx Million by 2033. Increased infrastructure development in emerging economies contributes to substantial market expansion. The report further details regional variances in market growth, highlighting specific opportunities and challenges in different geographical regions.
Key Markets & Segments Leading Busbar Trunking System Market
The industrial sector currently holds the dominant position in the Busbar Trunking System market, driven by the increasing demand for reliable and efficient power distribution in manufacturing facilities and industrial complexes. The commercial sector also shows substantial growth, fueled by the expansion of office buildings and commercial complexes. Geographically, the Asia-Pacific region dominates the market, largely owing to rapid economic growth, expanding industrialization, and substantial infrastructure development projects.
- Dominant Region: Asia-Pacific.
- Dominant End-User: Industrial.
- Dominant Material: Copper (due to higher conductivity).
- Dominant Power Rating: Low Voltage (due to widespread applications).
Drivers:
- Asia-Pacific: Rapid economic growth, infrastructure development.
- Industrial Sector: Expanding manufacturing facilities, rising automation needs.
- Copper Material: Superior conductivity, reliability.
- Low Voltage: Wider application range across various sectors.
Busbar Trunking System Market Product Developments
Recent product innovations have focused on enhancing safety, efficiency, and ease of installation. Advancements in materials science, such as the development of lightweight and high-conductivity alloys, have led to improved performance and reduced installation costs. Smart features, such as integrated sensors and remote monitoring capabilities, are becoming increasingly common, enabling real-time monitoring and predictive maintenance. These technological advancements provide manufacturers with a significant competitive edge, allowing them to cater to the evolving needs of diverse end-user segments.
Challenges in the Busbar Trunking System Market Market
The Busbar Trunking System market faces challenges from fluctuating raw material prices, especially copper and aluminum. Supply chain disruptions and logistical complexities impact production and delivery timelines, impacting profitability. Intense competition among established players and new entrants creates pricing pressures and necessitates continuous innovation. Stringent safety and environmental regulations pose additional compliance burdens and increase production costs. These combined factors could impact the overall growth trajectory of the market if not addressed effectively.
Forces Driving Busbar Trunking System Market Growth
Several factors are driving growth in the busbar trunking system market, including rising demand for power distribution in commercial and industrial buildings, increasing adoption of renewable energy sources, and growing investments in smart grid infrastructure. Government initiatives promoting energy efficiency and sustainable development further stimulate market growth. Technological advancements, like the development of modular and flexible busbar systems, contribute significantly. The expanding industrial sector, particularly in developing economies, creates a strong demand for these systems, further driving market expansion.
Long-Term Growth Catalysts in the Busbar Trunking System Market
Long-term growth is projected to be fuelled by continuous innovation in materials and design, leading to more efficient and sustainable busbar trunking systems. Strategic partnerships between manufacturers and technology providers will accelerate the integration of smart features and enhance product capabilities. Expansion into new and developing markets, especially in regions with robust industrial growth, will create substantial growth opportunities. The focus on sustainability and energy efficiency will further strengthen market demand in the long term.
Emerging Opportunities in Busbar Trunking System Market
Emerging opportunities lie in the development of smart and connected busbar trunking systems capable of real-time monitoring and predictive maintenance. The integration of renewable energy sources, such as solar and wind power, into busbar systems presents a significant growth avenue. The expansion into emerging markets, particularly in developing economies with substantial infrastructure projects, offers substantial untapped potential. Customization options and solutions tailored to specific end-user requirements also present considerable growth potential.
Leading Players in the Busbar Trunking System Market Sector
- Larsen & Toubro Limited
- Legrand SA
- Megabarre Group
- C&S Electric Ltd
- NAXSO S r l
- Siemens AG
- Schneider Electric SE
- Eaton Corporation PLC
- Godrej Boyce Mfg Co
- Pogliano Busbar S r l
- General Electric Company
- Anord Mardix IBAR (EMEA) Limited
Key Milestones in Busbar Trunking System Market Industry
- September 2021: Vertiv Holdings Company acquires E&I Engineering Ireland and Powerbar Gulf for USD 1.8 billion, significantly impacting market consolidation.
Strategic Outlook for Busbar Trunking System Market Market
The Busbar Trunking System market presents a promising outlook, driven by ongoing technological advancements, expanding infrastructure development, and a growing emphasis on energy efficiency. Strategic partnerships, acquisitions, and investments in research and development will play a pivotal role in shaping future market dynamics. Companies focusing on innovation, sustainability, and customer-centric solutions are poised to capture significant market share and achieve sustainable long-term growth.
Busbar Trunking System Market Segmentation
-
1. Material
- 1.1. Aluminum
- 1.2. Copper
-
2. Power Rating
- 2.1. Lighting
- 2.2. Low Voltage
- 2.3. Medium Voltage
- 2.4. High Voltage
-
3. End-User
- 3.1. Commercial
- 3.2. Industrial
- 3.3. Transportation
- 3.4. Residential
Busbar Trunking System Market Segmentation By Geography
- 1. North America
- 2. Europe
- 3. Asia Pacific
- 4. South America
- 5. Middle East and Africa
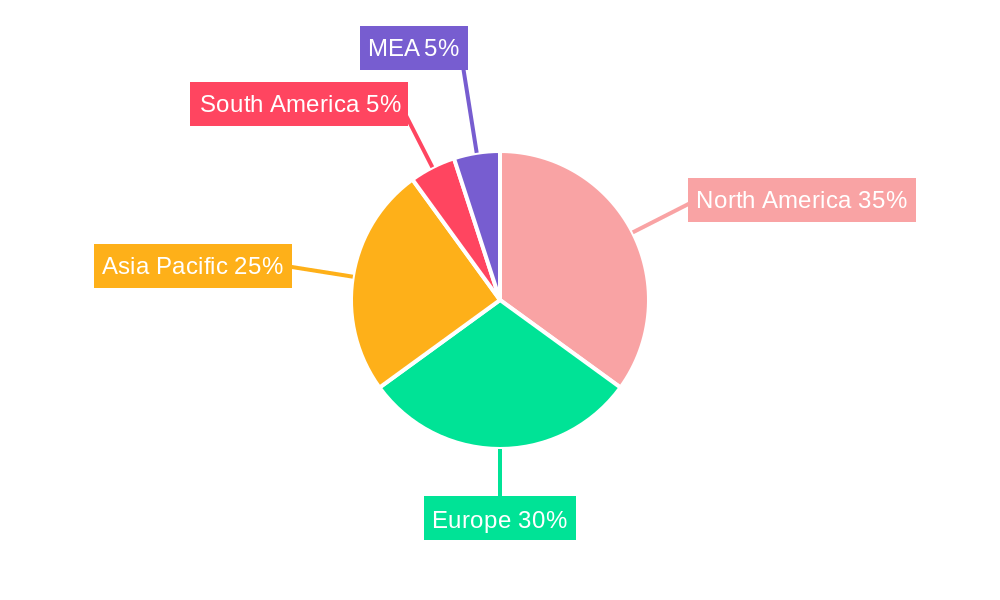
Busbar Trunking System Market Regional Market Share
Geographic Coverage of Busbar Trunking System Market
Busbar Trunking System Market REPORT HIGHLIGHTS
| Aspects | Details |
|---|---|
| Study Period | 2020-2034 |
| Base Year | 2025 |
| Estimated Year | 2026 |
| Forecast Period | 2026-2034 |
| Historical Period | 2020-2025 |
| Growth Rate | CAGR of 6.6% from 2020-2034 |
| Segmentation |
|
Table of Contents
- 1. Introduction
- 1.1. Research Scope
- 1.2. Market Segmentation
- 1.3. Research Methodology
- 1.4. Definitions and Assumptions
- 2. Executive Summary
- 2.1. Introduction
- 3. Market Dynamics
- 3.1. Introduction
- 3.2. Market Drivers
- 3.2.1. 4.; Expanding Pipeline Infrastructure4.; Growing Energy Demand
- 3.3. Market Restrains
- 3.3.1. 4.; Political Instability and Militant Attacks on Pipeline Infrastructure
- 3.4. Market Trends
- 3.4.1. Industrial Sector to Dominate the Market
- 4. Market Factor Analysis
- 4.1. Porters Five Forces
- 4.2. Supply/Value Chain
- 4.3. PESTEL analysis
- 4.4. Market Entropy
- 4.5. Patent/Trademark Analysis
- 5. Global Busbar Trunking System Market Analysis, Insights and Forecast, 2020-2032
- 5.1. Market Analysis, Insights and Forecast - by Material
- 5.1.1. Aluminum
- 5.1.2. Copper
- 5.2. Market Analysis, Insights and Forecast - by Power Rating
- 5.2.1. Lighting
- 5.2.2. Low Voltage
- 5.2.3. Medium Voltage
- 5.2.4. High Voltage
- 5.3. Market Analysis, Insights and Forecast - by End-User
- 5.3.1. Commercial
- 5.3.2. Industrial
- 5.3.3. Transportation
- 5.3.4. Residential
- 5.4. Market Analysis, Insights and Forecast - by Region
- 5.4.1. North America
- 5.4.2. Europe
- 5.4.3. Asia Pacific
- 5.4.4. South America
- 5.4.5. Middle East and Africa
- 5.1. Market Analysis, Insights and Forecast - by Material
- 6. North America Busbar Trunking System Market Analysis, Insights and Forecast, 2020-2032
- 6.1. Market Analysis, Insights and Forecast - by Material
- 6.1.1. Aluminum
- 6.1.2. Copper
- 6.2. Market Analysis, Insights and Forecast - by Power Rating
- 6.2.1. Lighting
- 6.2.2. Low Voltage
- 6.2.3. Medium Voltage
- 6.2.4. High Voltage
- 6.3. Market Analysis, Insights and Forecast - by End-User
- 6.3.1. Commercial
- 6.3.2. Industrial
- 6.3.3. Transportation
- 6.3.4. Residential
- 6.1. Market Analysis, Insights and Forecast - by Material
- 7. Europe Busbar Trunking System Market Analysis, Insights and Forecast, 2020-2032
- 7.1. Market Analysis, Insights and Forecast - by Material
- 7.1.1. Aluminum
- 7.1.2. Copper
- 7.2. Market Analysis, Insights and Forecast - by Power Rating
- 7.2.1. Lighting
- 7.2.2. Low Voltage
- 7.2.3. Medium Voltage
- 7.2.4. High Voltage
- 7.3. Market Analysis, Insights and Forecast - by End-User
- 7.3.1. Commercial
- 7.3.2. Industrial
- 7.3.3. Transportation
- 7.3.4. Residential
- 7.1. Market Analysis, Insights and Forecast - by Material
- 8. Asia Pacific Busbar Trunking System Market Analysis, Insights and Forecast, 2020-2032
- 8.1. Market Analysis, Insights and Forecast - by Material
- 8.1.1. Aluminum
- 8.1.2. Copper
- 8.2. Market Analysis, Insights and Forecast - by Power Rating
- 8.2.1. Lighting
- 8.2.2. Low Voltage
- 8.2.3. Medium Voltage
- 8.2.4. High Voltage
- 8.3. Market Analysis, Insights and Forecast - by End-User
- 8.3.1. Commercial
- 8.3.2. Industrial
- 8.3.3. Transportation
- 8.3.4. Residential
- 8.1. Market Analysis, Insights and Forecast - by Material
- 9. South America Busbar Trunking System Market Analysis, Insights and Forecast, 2020-2032
- 9.1. Market Analysis, Insights and Forecast - by Material
- 9.1.1. Aluminum
- 9.1.2. Copper
- 9.2. Market Analysis, Insights and Forecast - by Power Rating
- 9.2.1. Lighting
- 9.2.2. Low Voltage
- 9.2.3. Medium Voltage
- 9.2.4. High Voltage
- 9.3. Market Analysis, Insights and Forecast - by End-User
- 9.3.1. Commercial
- 9.3.2. Industrial
- 9.3.3. Transportation
- 9.3.4. Residential
- 9.1. Market Analysis, Insights and Forecast - by Material
- 10. Middle East and Africa Busbar Trunking System Market Analysis, Insights and Forecast, 2020-2032
- 10.1. Market Analysis, Insights and Forecast - by Material
- 10.1.1. Aluminum
- 10.1.2. Copper
- 10.2. Market Analysis, Insights and Forecast - by Power Rating
- 10.2.1. Lighting
- 10.2.2. Low Voltage
- 10.2.3. Medium Voltage
- 10.2.4. High Voltage
- 10.3. Market Analysis, Insights and Forecast - by End-User
- 10.3.1. Commercial
- 10.3.2. Industrial
- 10.3.3. Transportation
- 10.3.4. Residential
- 10.1. Market Analysis, Insights and Forecast - by Material
- 11. Competitive Analysis
- 11.1. Global Market Share Analysis 2025
- 11.2. Company Profiles
- 11.2.1 Larsen & Toubro Limited
- 11.2.1.1. Overview
- 11.2.1.2. Products
- 11.2.1.3. SWOT Analysis
- 11.2.1.4. Recent Developments
- 11.2.1.5. Financials (Based on Availability)
- 11.2.2 Legrand SA
- 11.2.2.1. Overview
- 11.2.2.2. Products
- 11.2.2.3. SWOT Analysis
- 11.2.2.4. Recent Developments
- 11.2.2.5. Financials (Based on Availability)
- 11.2.3 Megabarre Group
- 11.2.3.1. Overview
- 11.2.3.2. Products
- 11.2.3.3. SWOT Analysis
- 11.2.3.4. Recent Developments
- 11.2.3.5. Financials (Based on Availability)
- 11.2.4 C&S Electric Ltd
- 11.2.4.1. Overview
- 11.2.4.2. Products
- 11.2.4.3. SWOT Analysis
- 11.2.4.4. Recent Developments
- 11.2.4.5. Financials (Based on Availability)
- 11.2.5 NAXSO S r l
- 11.2.5.1. Overview
- 11.2.5.2. Products
- 11.2.5.3. SWOT Analysis
- 11.2.5.4. Recent Developments
- 11.2.5.5. Financials (Based on Availability)
- 11.2.6 Siemens AG
- 11.2.6.1. Overview
- 11.2.6.2. Products
- 11.2.6.3. SWOT Analysis
- 11.2.6.4. Recent Developments
- 11.2.6.5. Financials (Based on Availability)
- 11.2.7 Schneider Electric SE
- 11.2.7.1. Overview
- 11.2.7.2. Products
- 11.2.7.3. SWOT Analysis
- 11.2.7.4. Recent Developments
- 11.2.7.5. Financials (Based on Availability)
- 11.2.8 Eaton Corporation PLC
- 11.2.8.1. Overview
- 11.2.8.2. Products
- 11.2.8.3. SWOT Analysis
- 11.2.8.4. Recent Developments
- 11.2.8.5. Financials (Based on Availability)
- 11.2.9 Godrej Boyce Mfg Co
- 11.2.9.1. Overview
- 11.2.9.2. Products
- 11.2.9.3. SWOT Analysis
- 11.2.9.4. Recent Developments
- 11.2.9.5. Financials (Based on Availability)
- 11.2.10 Pogliano Busbar S r l
- 11.2.10.1. Overview
- 11.2.10.2. Products
- 11.2.10.3. SWOT Analysis
- 11.2.10.4. Recent Developments
- 11.2.10.5. Financials (Based on Availability)
- 11.2.11 General Electric Company
- 11.2.11.1. Overview
- 11.2.11.2. Products
- 11.2.11.3. SWOT Analysis
- 11.2.11.4. Recent Developments
- 11.2.11.5. Financials (Based on Availability)
- 11.2.12 Anord Mardix IBAR (EMEA) Limited
- 11.2.12.1. Overview
- 11.2.12.2. Products
- 11.2.12.3. SWOT Analysis
- 11.2.12.4. Recent Developments
- 11.2.12.5. Financials (Based on Availability)
- 11.2.1 Larsen & Toubro Limited
List of Figures
- Figure 1: Global Busbar Trunking System Market Revenue Breakdown (billion, %) by Region 2025 & 2033
- Figure 2: North America Busbar Trunking System Market Revenue (billion), by Material 2025 & 2033
- Figure 3: North America Busbar Trunking System Market Revenue Share (%), by Material 2025 & 2033
- Figure 4: North America Busbar Trunking System Market Revenue (billion), by Power Rating 2025 & 2033
- Figure 5: North America Busbar Trunking System Market Revenue Share (%), by Power Rating 2025 & 2033
- Figure 6: North America Busbar Trunking System Market Revenue (billion), by End-User 2025 & 2033
- Figure 7: North America Busbar Trunking System Market Revenue Share (%), by End-User 2025 & 2033
- Figure 8: North America Busbar Trunking System Market Revenue (billion), by Country 2025 & 2033
- Figure 9: North America Busbar Trunking System Market Revenue Share (%), by Country 2025 & 2033
- Figure 10: Europe Busbar Trunking System Market Revenue (billion), by Material 2025 & 2033
- Figure 11: Europe Busbar Trunking System Market Revenue Share (%), by Material 2025 & 2033
- Figure 12: Europe Busbar Trunking System Market Revenue (billion), by Power Rating 2025 & 2033
- Figure 13: Europe Busbar Trunking System Market Revenue Share (%), by Power Rating 2025 & 2033
- Figure 14: Europe Busbar Trunking System Market Revenue (billion), by End-User 2025 & 2033
- Figure 15: Europe Busbar Trunking System Market Revenue Share (%), by End-User 2025 & 2033
- Figure 16: Europe Busbar Trunking System Market Revenue (billion), by Country 2025 & 2033
- Figure 17: Europe Busbar Trunking System Market Revenue Share (%), by Country 2025 & 2033
- Figure 18: Asia Pacific Busbar Trunking System Market Revenue (billion), by Material 2025 & 2033
- Figure 19: Asia Pacific Busbar Trunking System Market Revenue Share (%), by Material 2025 & 2033
- Figure 20: Asia Pacific Busbar Trunking System Market Revenue (billion), by Power Rating 2025 & 2033
- Figure 21: Asia Pacific Busbar Trunking System Market Revenue Share (%), by Power Rating 2025 & 2033
- Figure 22: Asia Pacific Busbar Trunking System Market Revenue (billion), by End-User 2025 & 2033
- Figure 23: Asia Pacific Busbar Trunking System Market Revenue Share (%), by End-User 2025 & 2033
- Figure 24: Asia Pacific Busbar Trunking System Market Revenue (billion), by Country 2025 & 2033
- Figure 25: Asia Pacific Busbar Trunking System Market Revenue Share (%), by Country 2025 & 2033
- Figure 26: South America Busbar Trunking System Market Revenue (billion), by Material 2025 & 2033
- Figure 27: South America Busbar Trunking System Market Revenue Share (%), by Material 2025 & 2033
- Figure 28: South America Busbar Trunking System Market Revenue (billion), by Power Rating 2025 & 2033
- Figure 29: South America Busbar Trunking System Market Revenue Share (%), by Power Rating 2025 & 2033
- Figure 30: South America Busbar Trunking System Market Revenue (billion), by End-User 2025 & 2033
- Figure 31: South America Busbar Trunking System Market Revenue Share (%), by End-User 2025 & 2033
- Figure 32: South America Busbar Trunking System Market Revenue (billion), by Country 2025 & 2033
- Figure 33: South America Busbar Trunking System Market Revenue Share (%), by Country 2025 & 2033
- Figure 34: Middle East and Africa Busbar Trunking System Market Revenue (billion), by Material 2025 & 2033
- Figure 35: Middle East and Africa Busbar Trunking System Market Revenue Share (%), by Material 2025 & 2033
- Figure 36: Middle East and Africa Busbar Trunking System Market Revenue (billion), by Power Rating 2025 & 2033
- Figure 37: Middle East and Africa Busbar Trunking System Market Revenue Share (%), by Power Rating 2025 & 2033
- Figure 38: Middle East and Africa Busbar Trunking System Market Revenue (billion), by End-User 2025 & 2033
- Figure 39: Middle East and Africa Busbar Trunking System Market Revenue Share (%), by End-User 2025 & 2033
- Figure 40: Middle East and Africa Busbar Trunking System Market Revenue (billion), by Country 2025 & 2033
- Figure 41: Middle East and Africa Busbar Trunking System Market Revenue Share (%), by Country 2025 & 2033
List of Tables
- Table 1: Global Busbar Trunking System Market Revenue billion Forecast, by Material 2020 & 2033
- Table 2: Global Busbar Trunking System Market Revenue billion Forecast, by Power Rating 2020 & 2033
- Table 3: Global Busbar Trunking System Market Revenue billion Forecast, by End-User 2020 & 2033
- Table 4: Global Busbar Trunking System Market Revenue billion Forecast, by Region 2020 & 2033
- Table 5: Global Busbar Trunking System Market Revenue billion Forecast, by Material 2020 & 2033
- Table 6: Global Busbar Trunking System Market Revenue billion Forecast, by Power Rating 2020 & 2033
- Table 7: Global Busbar Trunking System Market Revenue billion Forecast, by End-User 2020 & 2033
- Table 8: Global Busbar Trunking System Market Revenue billion Forecast, by Country 2020 & 2033
- Table 9: Global Busbar Trunking System Market Revenue billion Forecast, by Material 2020 & 2033
- Table 10: Global Busbar Trunking System Market Revenue billion Forecast, by Power Rating 2020 & 2033
- Table 11: Global Busbar Trunking System Market Revenue billion Forecast, by End-User 2020 & 2033
- Table 12: Global Busbar Trunking System Market Revenue billion Forecast, by Country 2020 & 2033
- Table 13: Global Busbar Trunking System Market Revenue billion Forecast, by Material 2020 & 2033
- Table 14: Global Busbar Trunking System Market Revenue billion Forecast, by Power Rating 2020 & 2033
- Table 15: Global Busbar Trunking System Market Revenue billion Forecast, by End-User 2020 & 2033
- Table 16: Global Busbar Trunking System Market Revenue billion Forecast, by Country 2020 & 2033
- Table 17: Global Busbar Trunking System Market Revenue billion Forecast, by Material 2020 & 2033
- Table 18: Global Busbar Trunking System Market Revenue billion Forecast, by Power Rating 2020 & 2033
- Table 19: Global Busbar Trunking System Market Revenue billion Forecast, by End-User 2020 & 2033
- Table 20: Global Busbar Trunking System Market Revenue billion Forecast, by Country 2020 & 2033
- Table 21: Global Busbar Trunking System Market Revenue billion Forecast, by Material 2020 & 2033
- Table 22: Global Busbar Trunking System Market Revenue billion Forecast, by Power Rating 2020 & 2033
- Table 23: Global Busbar Trunking System Market Revenue billion Forecast, by End-User 2020 & 2033
- Table 24: Global Busbar Trunking System Market Revenue billion Forecast, by Country 2020 & 2033
Frequently Asked Questions
1. What is the projected Compound Annual Growth Rate (CAGR) of the Busbar Trunking System Market?
The projected CAGR is approximately 6.6%.
2. Which companies are prominent players in the Busbar Trunking System Market?
Key companies in the market include Larsen & Toubro Limited, Legrand SA, Megabarre Group, C&S Electric Ltd, NAXSO S r l, Siemens AG, Schneider Electric SE, Eaton Corporation PLC, Godrej Boyce Mfg Co, Pogliano Busbar S r l, General Electric Company, Anord Mardix IBAR (EMEA) Limited.
3. What are the main segments of the Busbar Trunking System Market?
The market segments include Material, Power Rating, End-User.
4. Can you provide details about the market size?
The market size is estimated to be USD 7.1 billion as of 2022.
5. What are some drivers contributing to market growth?
4.; Expanding Pipeline Infrastructure4.; Growing Energy Demand.
6. What are the notable trends driving market growth?
Industrial Sector to Dominate the Market.
7. Are there any restraints impacting market growth?
4.; Political Instability and Militant Attacks on Pipeline Infrastructure.
8. Can you provide examples of recent developments in the market?
In September 2021, Vertiv Holdings Company, a global provider of critical digital infrastructure and continuity solutions, announced the acquisition of E&I Engineering Ireland and its UAE-based affiliate, Powerbar Gulf, a leading manufacturer of busbar trunking systems in the GCC, for USD 1.8 billion in upfront consideration plus the potential for up to USD 200 million in cash.
9. What pricing options are available for accessing the report?
Pricing options include single-user, multi-user, and enterprise licenses priced at USD 4750, USD 5250, and USD 8750 respectively.
10. Is the market size provided in terms of value or volume?
The market size is provided in terms of value, measured in billion.
11. Are there any specific market keywords associated with the report?
Yes, the market keyword associated with the report is "Busbar Trunking System Market," which aids in identifying and referencing the specific market segment covered.
12. How do I determine which pricing option suits my needs best?
The pricing options vary based on user requirements and access needs. Individual users may opt for single-user licenses, while businesses requiring broader access may choose multi-user or enterprise licenses for cost-effective access to the report.
13. Are there any additional resources or data provided in the Busbar Trunking System Market report?
While the report offers comprehensive insights, it's advisable to review the specific contents or supplementary materials provided to ascertain if additional resources or data are available.
14. How can I stay updated on further developments or reports in the Busbar Trunking System Market?
To stay informed about further developments, trends, and reports in the Busbar Trunking System Market, consider subscribing to industry newsletters, following relevant companies and organizations, or regularly checking reputable industry news sources and publications.
Methodology
Step 1 - Identification of Relevant Samples Size from Population Database


Step 2 - Approaches for Defining Global Market Size (Value, Volume* & Price*)

Note*: In applicable scenarios
Step 3 - Data Sources
Primary Research
- Web Analytics
- Survey Reports
- Research Institute
- Latest Research Reports
- Opinion Leaders
Secondary Research
- Annual Reports
- White Paper
- Latest Press Release
- Industry Association
- Paid Database
- Investor Presentations

Step 4 - Data Triangulation
Involves using different sources of information in order to increase the validity of a study
These sources are likely to be stakeholders in a program - participants, other researchers, program staff, other community members, and so on.
Then we put all data in single framework & apply various statistical tools to find out the dynamic on the market.
During the analysis stage, feedback from the stakeholder groups would be compared to determine areas of agreement as well as areas of divergence