

Key Insights
The online action games market is poised for significant expansion, driven by enhanced internet accessibility, the surge in mobile gaming, and continuous technological innovation. Projections indicate a robust Compound Annual Growth Rate (CAGR) of 7.2%, projecting the market size to reach 6.39 billion by 2025. Key growth catalysts include the escalating popularity of esports, which captivate vast audiences and drive substantial revenue, alongside the development of highly immersive gameplay through advanced graphics and AI. The convenience of mobile platforms further broadens participation across diverse demographics. A variety of revenue models, including free-to-play and premium options, cater to varied player preferences, fueling market growth. The market is strategically segmented by platform (PC, console, mobile) and operating system (iOS, Android, Windows), reflecting diverse technological landscapes and player choices. Despite challenges such as the necessity for sustained innovation and potential market saturation, the online action games market maintains a positive trajectory, underpinned by ongoing technological advancements and the enduring appeal of interactive entertainment.
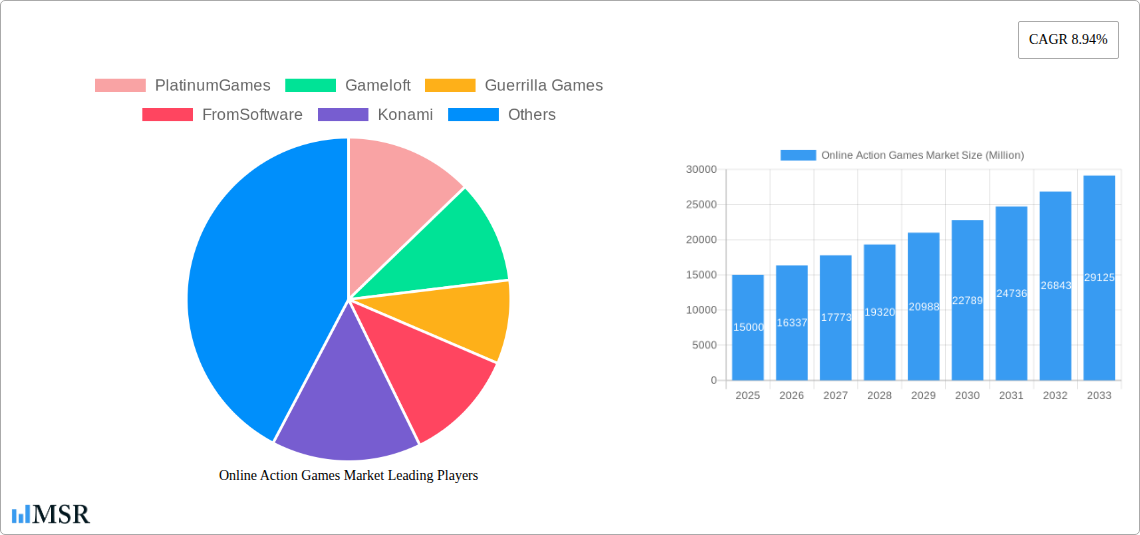
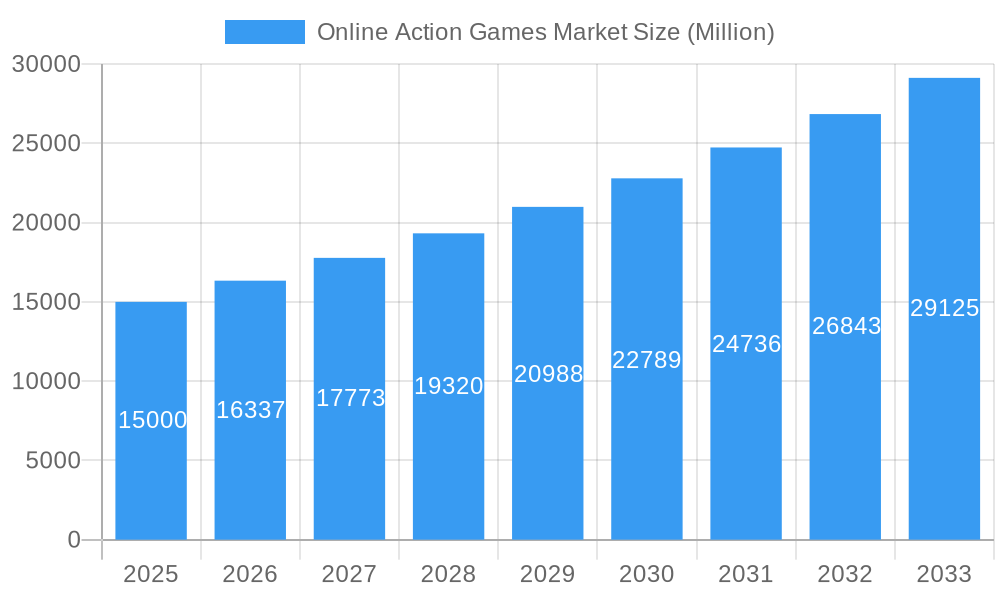
Online Action Games Market Market Size (In Billion)
Leading industry players such as Tencent, Sony Interactive Entertainment, EA, and Ubisoft are actively investing in R&D to deliver novel and captivating experiences. Intense market competition compels studios to optimize business models, monetization strategies, and game design to secure and expand market share. Regional market dynamics are shaped by economic development, internet infrastructure, and gaming culture. North America and Asia-Pacific are anticipated to lead market growth, with notable potential emerging in developing Asian and South American economies. Navigating regulatory frameworks and prioritizing player data privacy will remain critical for sustained success. Future growth will be contingent on adapting to evolving player preferences, integrating emerging technologies like VR/AR, and consistently delivering exceptional gaming experiences.
Online Action Games Market Company Market Share
Online Action Games Market: A Comprehensive Report (2019-2033)
This in-depth report provides a comprehensive analysis of the Online Action Games Market, offering invaluable insights for industry stakeholders, investors, and businesses seeking to navigate this dynamic sector. The report covers the period from 2019 to 2033, with a base year of 2025 and a forecast period from 2025 to 2033. The market is segmented by revenue model (Free Gaming Services, Paid Gaming Services), platform (PCs, Consoles, Mobile Phones), and operating system (iOS, Android, Windows, Other Operating Systems). Key players like PlatinumGames, Gameloft, Guerrilla Games, and more are analyzed, revealing market dynamics and future potential. The global market size is projected to reach xx Million by 2033, exhibiting a Compound Annual Growth Rate (CAGR) of xx%.
Online Action Games Market Concentration & Dynamics
The Online Action Games Market exhibits a moderately concentrated landscape, with a few dominant players holding significant market share. However, the market is also characterized by a vibrant ecosystem of independent developers and studios driving innovation. Regulatory frameworks vary by region, influencing game development and distribution. Substitute products, such as other genres of online games, present competition, while evolving end-user trends, especially towards mobile gaming and esports, significantly impact market growth. Mergers and acquisitions (M&A) activity has been significant, with xx major deals recorded between 2019 and 2024, signaling consolidation within the industry.
- Market Share: Top 5 players hold approximately xx% of the market share (2024).
- M&A Activity: An average of xx M&A deals per year were observed during the historical period (2019-2024).
- Innovation Ecosystems: A strong focus on technological advancements, such as improved graphics, VR/AR integration, and cloud gaming, drive continuous innovation.
- Regulatory Frameworks: Varying age ratings and content regulations across different regions pose challenges for developers.
Online Action Games Market Industry Insights & Trends
The Online Action Games Market is experiencing robust growth, driven primarily by increasing smartphone penetration, the rising popularity of esports, and the continuous improvement in game graphics and technology. The market size reached xx Million in 2024 and is projected to reach xx Million by 2025, showcasing significant growth. The CAGR during the forecast period (2025-2033) is estimated at xx%. Technological advancements, such as the implementation of advanced game engines and AI-powered gameplay enhancements, are significantly influencing consumer behavior and game design. The increasing accessibility of high-speed internet globally has further fueled the expansion of the market. The shift towards free-to-play models, supported by in-app purchases and microtransactions, has also broadened the market's reach.
Key Markets & Segments Leading Online Action Games Market
The mobile gaming segment, driven by the Android and iOS operating systems, dominates the Online Action Games Market. The Asia-Pacific region, specifically China, Japan, and South Korea, accounts for the largest market share due to high smartphone penetration and a large gaming population.
- By Revenue Model: Free Gaming Services constitute the largest revenue segment.
- By Platform: Mobile Phones are the dominant platform, followed by PCs and Consoles.
- By Operating System: Android and iOS dominate the mobile market.
- Regional Dominance: Asia-Pacific exhibits the highest growth rate driven by factors including rising disposable income and increasing internet access. North America and Europe also present significant market opportunities.
- Drivers:
- Increasing disposable incomes, especially in developing economies.
- Advanced mobile technology and enhanced internet infrastructure.
- Growing popularity of esports and competitive gaming.
Online Action Games Market Product Developments
Recent years have witnessed significant advancements in online action game design, leveraging advanced game engines, improved graphics, and innovative gameplay mechanics. The integration of virtual reality (VR) and augmented reality (AR) technologies offers immersive experiences. Cloud gaming services have made gaming more accessible, eliminating hardware limitations. These technological innovations have created competitive advantages for developers, pushing the boundaries of gameplay and enhancing player engagement.
Challenges in the Online Action Games Market Market
The Online Action Games Market faces challenges such as increasing development costs, intense competition, and the complexities of global regulatory compliance. Supply chain disruptions impacting hardware components and distribution networks also pose a challenge. Furthermore, the increasing prevalence of piracy and unauthorized game distribution negatively impacts revenue streams. This leads to an estimated xx Million loss in revenue annually (2024).
Forces Driving Online Action Games Market Growth
Several factors fuel the market's expansion, including technological advancements like improved graphics and AI, the rise of mobile gaming and esports, and increasing internet penetration in developing countries. Government initiatives supporting the gaming industry, along with favorable regulatory environments in some regions, further stimulate growth. Moreover, the continuous evolution of free-to-play models with in-app purchases adds to market expansion.
Long-Term Growth Catalysts in Online Action Games Market
Long-term growth hinges on continuous innovation in game mechanics, graphics, and technology. Strategic partnerships and collaborations between developers and technology companies will play a crucial role. Expansion into new geographic markets, particularly in emerging economies, presents significant opportunities for growth.
Emerging Opportunities in Online Action Games Market
The metaverse and Web3 technologies present exciting opportunities, allowing for immersive gameplay and new revenue models. Growth in cloud gaming and subscription services further expands the market potential. The increasing popularity of esports and live streaming creates new avenues for player engagement and monetization.
Leading Players in the Online Action Games Market Sector
Key Milestones in Online Action Games Market Industry
- July 2022: Ubisoft unveils Tom Clancy's The Division® Resurgence, a free-to-play mobile game, expanding the franchise's reach to a broader audience. This signifies a strategic move towards capturing the significant mobile gaming market.
Strategic Outlook for Online Action Games Market Market
The Online Action Games Market is poised for continued growth, driven by technological innovation, increasing accessibility, and the expanding global gaming community. Strategic opportunities lie in capitalizing on emerging technologies like the metaverse and Web3, focusing on mobile gaming, and strengthening partnerships to enhance market reach and competitiveness. Companies focusing on innovation and adapting to evolving consumer preferences are best positioned for success.
Online Action Games Market Segmentation
-
1. Revenue Model
- 1.1. Free Gaming Services
- 1.2. Paid Gaming Services
-
2. Platform
- 2.1. PCs
- 2.2. Consoles
- 2.3. Mobile Phones
-
3. Operating System
- 3.1. iOS
- 3.2. Android
- 3.3. Windows
- 3.4. Other Operating Systems
Online Action Games Market Segmentation By Geography
-
1. North America
- 1.1. United States
- 1.2. Canada
- 1.3. Mexico
- 1.4. Rest of North America
-
2. Europe
- 2.1. Germany
- 2.2. United Kingdom
- 2.3. France
- 2.4. Russia
- 2.5. Spain
- 2.6. Rest of Europe
-
3. Asia Pacific
- 3.1. India
- 3.2. China
- 3.3. Japan
- 3.4. Rest of Asia Pacific
-
4. South America
- 4.1. Brazil
- 4.2. Argentina
-
5. Middle East
- 5.1. United Arab Emirates
- 5.2. Saudi Arabia
- 5.3. Rest of the Middle East
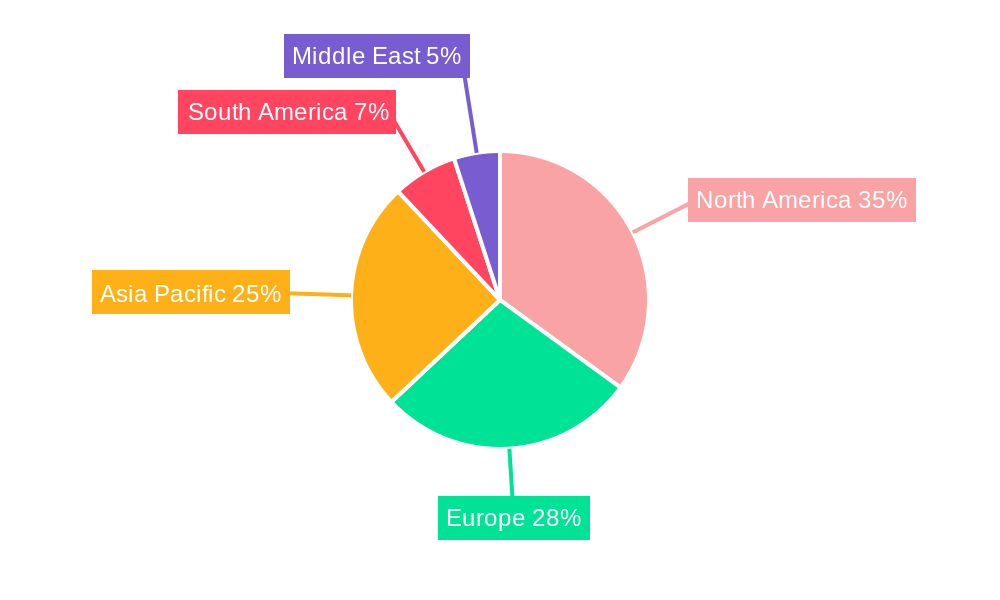
Online Action Games Market Regional Market Share
Geographic Coverage of Online Action Games Market
Online Action Games Market REPORT HIGHLIGHTS
| Aspects | Details |
|---|---|
| Study Period | 2020-2034 |
| Base Year | 2025 |
| Estimated Year | 2026 |
| Forecast Period | 2026-2034 |
| Historical Period | 2020-2025 |
| Growth Rate | CAGR of 7.2% from 2020-2034 |
| Segmentation |
|
Table of Contents
- 1. Introduction
- 1.1. Research Scope
- 1.2. Market Segmentation
- 1.3. Research Objective
- 1.4. Definitions and Assumptions
- 2. Executive Summary
- 2.1. Market Snapshot
- 3. Market Dynamics
- 3.1. Market Drivers
- 3.2. Market Restrains
- 3.3. Market Trends
- 3.4. Market Opportunities
- 4. Market Factor Analysis
- 4.1. Porters Five Forces
- 4.1.1. Bargaining Power of Suppliers
- 4.1.2. Bargaining Power of Buyers
- 4.1.3. Threat of New Entrants
- 4.1.4. Threat of Substitutes
- 4.1.5. Competitive Rivalry
- 4.2. PESTEL analysis
- 4.3. BCG Analysis
- 4.3.1. Stars (High Growth, High Market Share)
- 4.3.2. Cash Cows (Low Growth, High Market Share)
- 4.3.3. Question Mark (High Growth, Low Market Share)
- 4.3.4. Dogs (Low Growth, Low Market Share)
- 4.4. Ansoff Matrix Analysis
- 4.5. Supply Chain Analysis
- 4.6. Regulatory Landscape
- 4.7. Current Market Potential and Opportunity Assessment (TAM–SAM–SOM Framework)
- 4.8. MSR Analyst Note
- 4.1. Porters Five Forces
- 5. Market Analysis, Insights and Forecast 2021-2033
- 5.1. Market Analysis, Insights and Forecast - by Revenue Model
- 5.1.1. Free Gaming Services
- 5.1.2. Paid Gaming Services
- 5.2. Market Analysis, Insights and Forecast - by Platform
- 5.2.1. PCs
- 5.2.2. Consoles
- 5.2.3. Mobile Phones
- 5.3. Market Analysis, Insights and Forecast - by Operating System
- 5.3.1. iOS
- 5.3.2. Android
- 5.3.3. Windows
- 5.3.4. Other Operating Systems
- 5.4. Market Analysis, Insights and Forecast - by Region
- 5.4.1. North America
- 5.4.2. Europe
- 5.4.3. Asia Pacific
- 5.4.4. South America
- 5.4.5. Middle East
- 5.1. Market Analysis, Insights and Forecast - by Revenue Model
- 6. Global Online Action Games Market Analysis, Insights and Forecast, 2021-2033
- 6.1. Market Analysis, Insights and Forecast - by Revenue Model
- 6.1.1. Free Gaming Services
- 6.1.2. Paid Gaming Services
- 6.2. Market Analysis, Insights and Forecast - by Platform
- 6.2.1. PCs
- 6.2.2. Consoles
- 6.2.3. Mobile Phones
- 6.3. Market Analysis, Insights and Forecast - by Operating System
- 6.3.1. iOS
- 6.3.2. Android
- 6.3.3. Windows
- 6.3.4. Other Operating Systems
- 6.1. Market Analysis, Insights and Forecast - by Revenue Model
- 7. North America Online Action Games Market Analysis, Insights and Forecast, 2020-2032
- 7.1. Market Analysis, Insights and Forecast - by Revenue Model
- 7.1.1. Free Gaming Services
- 7.1.2. Paid Gaming Services
- 7.2. Market Analysis, Insights and Forecast - by Platform
- 7.2.1. PCs
- 7.2.2. Consoles
- 7.2.3. Mobile Phones
- 7.3. Market Analysis, Insights and Forecast - by Operating System
- 7.3.1. iOS
- 7.3.2. Android
- 7.3.3. Windows
- 7.3.4. Other Operating Systems
- 7.1. Market Analysis, Insights and Forecast - by Revenue Model
- 8. Europe Online Action Games Market Analysis, Insights and Forecast, 2020-2032
- 8.1. Market Analysis, Insights and Forecast - by Revenue Model
- 8.1.1. Free Gaming Services
- 8.1.2. Paid Gaming Services
- 8.2. Market Analysis, Insights and Forecast - by Platform
- 8.2.1. PCs
- 8.2.2. Consoles
- 8.2.3. Mobile Phones
- 8.3. Market Analysis, Insights and Forecast - by Operating System
- 8.3.1. iOS
- 8.3.2. Android
- 8.3.3. Windows
- 8.3.4. Other Operating Systems
- 8.1. Market Analysis, Insights and Forecast - by Revenue Model
- 9. Asia Pacific Online Action Games Market Analysis, Insights and Forecast, 2020-2032
- 9.1. Market Analysis, Insights and Forecast - by Revenue Model
- 9.1.1. Free Gaming Services
- 9.1.2. Paid Gaming Services
- 9.2. Market Analysis, Insights and Forecast - by Platform
- 9.2.1. PCs
- 9.2.2. Consoles
- 9.2.3. Mobile Phones
- 9.3. Market Analysis, Insights and Forecast - by Operating System
- 9.3.1. iOS
- 9.3.2. Android
- 9.3.3. Windows
- 9.3.4. Other Operating Systems
- 9.1. Market Analysis, Insights and Forecast - by Revenue Model
- 10. South America Online Action Games Market Analysis, Insights and Forecast, 2020-2032
- 10.1. Market Analysis, Insights and Forecast - by Revenue Model
- 10.1.1. Free Gaming Services
- 10.1.2. Paid Gaming Services
- 10.2. Market Analysis, Insights and Forecast - by Platform
- 10.2.1. PCs
- 10.2.2. Consoles
- 10.2.3. Mobile Phones
- 10.3. Market Analysis, Insights and Forecast - by Operating System
- 10.3.1. iOS
- 10.3.2. Android
- 10.3.3. Windows
- 10.3.4. Other Operating Systems
- 10.1. Market Analysis, Insights and Forecast - by Revenue Model
- 11. Middle East Online Action Games Market Analysis, Insights and Forecast, 2020-2032
- 11.1. Market Analysis, Insights and Forecast - by Revenue Model
- 11.1.1. Free Gaming Services
- 11.1.2. Paid Gaming Services
- 11.2. Market Analysis, Insights and Forecast - by Platform
- 11.2.1. PCs
- 11.2.2. Consoles
- 11.2.3. Mobile Phones
- 11.3. Market Analysis, Insights and Forecast - by Operating System
- 11.3.1. iOS
- 11.3.2. Android
- 11.3.3. Windows
- 11.3.4. Other Operating Systems
- 11.1. Market Analysis, Insights and Forecast - by Revenue Model
- 12. Competitive Analysis
- 12.1. Company Profiles
- 12.1.1 PlatinumGames
- 12.1.1.1. Company Overview
- 12.1.1.2. Products
- 12.1.1.3. Company Financials
- 12.1.1.4. SWOT Analysis
- 12.1.2 Gameloft
- 12.1.2.1. Company Overview
- 12.1.2.2. Products
- 12.1.2.3. Company Financials
- 12.1.2.4. SWOT Analysis
- 12.1.3 Guerrilla Games
- 12.1.3.1. Company Overview
- 12.1.3.2. Products
- 12.1.3.3. Company Financials
- 12.1.3.4. SWOT Analysis
- 12.1.4 FromSoftware
- 12.1.4.1. Company Overview
- 12.1.4.2. Products
- 12.1.4.3. Company Financials
- 12.1.4.4. SWOT Analysis
- 12.1.5 Konami
- 12.1.5.1. Company Overview
- 12.1.5.2. Products
- 12.1.5.3. Company Financials
- 12.1.5.4. SWOT Analysis
- 12.1.6 SIE Santa Monica Studio
- 12.1.6.1. Company Overview
- 12.1.6.2. Products
- 12.1.6.3. Company Financials
- 12.1.6.4. SWOT Analysis
- 12.1.7 Nintendo EPD
- 12.1.7.1. Company Overview
- 12.1.7.2. Products
- 12.1.7.3. Company Financials
- 12.1.7.4. SWOT Analysis
- 12.1.8 Rocksteady Studios
- 12.1.8.1. Company Overview
- 12.1.8.2. Products
- 12.1.8.3. Company Financials
- 12.1.8.4. SWOT Analysis
- 12.1.9 Tencent
- 12.1.9.1. Company Overview
- 12.1.9.2. Products
- 12.1.9.3. Company Financials
- 12.1.9.4. SWOT Analysis
- 12.1.10 Rockstar North
- 12.1.10.1. Company Overview
- 12.1.10.2. Products
- 12.1.10.3. Company Financials
- 12.1.10.4. SWOT Analysis
- 12.1.11 Sony Interactive Entertainment
- 12.1.11.1. Company Overview
- 12.1.11.2. Products
- 12.1.11.3. Company Financials
- 12.1.11.4. SWOT Analysis
- 12.1.12 EA DICE*List Not Exhaustive
- 12.1.12.1. Company Overview
- 12.1.12.2. Products
- 12.1.12.3. Company Financials
- 12.1.12.4. SWOT Analysis
- 12.1.13 Bethesda Game Studios
- 12.1.13.1. Company Overview
- 12.1.13.2. Products
- 12.1.13.3. Company Financials
- 12.1.13.4. SWOT Analysis
- 12.1.14 Capcom
- 12.1.14.1. Company Overview
- 12.1.14.2. Products
- 12.1.14.3. Company Financials
- 12.1.14.4. SWOT Analysis
- 12.1.15 Ubisoft
- 12.1.15.1. Company Overview
- 12.1.15.2. Products
- 12.1.15.3. Company Financials
- 12.1.15.4. SWOT Analysis
- 12.1.16 id Software
- 12.1.16.1. Company Overview
- 12.1.16.2. Products
- 12.1.16.3. Company Financials
- 12.1.16.4. SWOT Analysis
- 12.1.1 PlatinumGames
- 12.2. Market Entropy
- 12.2.1 Company's Key Areas Served
- 12.2.2 Recent Developments
- 12.3. Company Market Share Analysis 2025
- 12.3.1 Top 5 Companies Market Share Analysis
- 12.3.2 Top 3 Companies Market Share Analysis
- 12.4. List of Potential Customers
- 13. Research Methodology
List of Figures
- Figure 1: Global Online Action Games Market Revenue Breakdown (billion, %) by Region 2025 & 2033
- Figure 2: North America Online Action Games Market Revenue (billion), by Revenue Model 2025 & 2033
- Figure 3: North America Online Action Games Market Revenue Share (%), by Revenue Model 2025 & 2033
- Figure 4: North America Online Action Games Market Revenue (billion), by Platform 2025 & 2033
- Figure 5: North America Online Action Games Market Revenue Share (%), by Platform 2025 & 2033
- Figure 6: North America Online Action Games Market Revenue (billion), by Operating System 2025 & 2033
- Figure 7: North America Online Action Games Market Revenue Share (%), by Operating System 2025 & 2033
- Figure 8: North America Online Action Games Market Revenue (billion), by Country 2025 & 2033
- Figure 9: North America Online Action Games Market Revenue Share (%), by Country 2025 & 2033
- Figure 10: Europe Online Action Games Market Revenue (billion), by Revenue Model 2025 & 2033
- Figure 11: Europe Online Action Games Market Revenue Share (%), by Revenue Model 2025 & 2033
- Figure 12: Europe Online Action Games Market Revenue (billion), by Platform 2025 & 2033
- Figure 13: Europe Online Action Games Market Revenue Share (%), by Platform 2025 & 2033
- Figure 14: Europe Online Action Games Market Revenue (billion), by Operating System 2025 & 2033
- Figure 15: Europe Online Action Games Market Revenue Share (%), by Operating System 2025 & 2033
- Figure 16: Europe Online Action Games Market Revenue (billion), by Country 2025 & 2033
- Figure 17: Europe Online Action Games Market Revenue Share (%), by Country 2025 & 2033
- Figure 18: Asia Pacific Online Action Games Market Revenue (billion), by Revenue Model 2025 & 2033
- Figure 19: Asia Pacific Online Action Games Market Revenue Share (%), by Revenue Model 2025 & 2033
- Figure 20: Asia Pacific Online Action Games Market Revenue (billion), by Platform 2025 & 2033
- Figure 21: Asia Pacific Online Action Games Market Revenue Share (%), by Platform 2025 & 2033
- Figure 22: Asia Pacific Online Action Games Market Revenue (billion), by Operating System 2025 & 2033
- Figure 23: Asia Pacific Online Action Games Market Revenue Share (%), by Operating System 2025 & 2033
- Figure 24: Asia Pacific Online Action Games Market Revenue (billion), by Country 2025 & 2033
- Figure 25: Asia Pacific Online Action Games Market Revenue Share (%), by Country 2025 & 2033
- Figure 26: South America Online Action Games Market Revenue (billion), by Revenue Model 2025 & 2033
- Figure 27: South America Online Action Games Market Revenue Share (%), by Revenue Model 2025 & 2033
- Figure 28: South America Online Action Games Market Revenue (billion), by Platform 2025 & 2033
- Figure 29: South America Online Action Games Market Revenue Share (%), by Platform 2025 & 2033
- Figure 30: South America Online Action Games Market Revenue (billion), by Operating System 2025 & 2033
- Figure 31: South America Online Action Games Market Revenue Share (%), by Operating System 2025 & 2033
- Figure 32: South America Online Action Games Market Revenue (billion), by Country 2025 & 2033
- Figure 33: South America Online Action Games Market Revenue Share (%), by Country 2025 & 2033
- Figure 34: Middle East Online Action Games Market Revenue (billion), by Revenue Model 2025 & 2033
- Figure 35: Middle East Online Action Games Market Revenue Share (%), by Revenue Model 2025 & 2033
- Figure 36: Middle East Online Action Games Market Revenue (billion), by Platform 2025 & 2033
- Figure 37: Middle East Online Action Games Market Revenue Share (%), by Platform 2025 & 2033
- Figure 38: Middle East Online Action Games Market Revenue (billion), by Operating System 2025 & 2033
- Figure 39: Middle East Online Action Games Market Revenue Share (%), by Operating System 2025 & 2033
- Figure 40: Middle East Online Action Games Market Revenue (billion), by Country 2025 & 2033
- Figure 41: Middle East Online Action Games Market Revenue Share (%), by Country 2025 & 2033
List of Tables
- Table 1: Global Online Action Games Market Revenue billion Forecast, by Revenue Model 2020 & 2033
- Table 2: Global Online Action Games Market Revenue billion Forecast, by Platform 2020 & 2033
- Table 3: Global Online Action Games Market Revenue billion Forecast, by Operating System 2020 & 2033
- Table 4: Global Online Action Games Market Revenue billion Forecast, by Region 2020 & 2033
- Table 5: Global Online Action Games Market Revenue billion Forecast, by Revenue Model 2020 & 2033
- Table 6: Global Online Action Games Market Revenue billion Forecast, by Platform 2020 & 2033
- Table 7: Global Online Action Games Market Revenue billion Forecast, by Operating System 2020 & 2033
- Table 8: Global Online Action Games Market Revenue billion Forecast, by Country 2020 & 2033
- Table 9: United States Online Action Games Market Revenue (billion) Forecast, by Application 2020 & 2033
- Table 10: Canada Online Action Games Market Revenue (billion) Forecast, by Application 2020 & 2033
- Table 11: Mexico Online Action Games Market Revenue (billion) Forecast, by Application 2020 & 2033
- Table 12: Rest of North America Online Action Games Market Revenue (billion) Forecast, by Application 2020 & 2033
- Table 13: Global Online Action Games Market Revenue billion Forecast, by Revenue Model 2020 & 2033
- Table 14: Global Online Action Games Market Revenue billion Forecast, by Platform 2020 & 2033
- Table 15: Global Online Action Games Market Revenue billion Forecast, by Operating System 2020 & 2033
- Table 16: Global Online Action Games Market Revenue billion Forecast, by Country 2020 & 2033
- Table 17: Germany Online Action Games Market Revenue (billion) Forecast, by Application 2020 & 2033
- Table 18: United Kingdom Online Action Games Market Revenue (billion) Forecast, by Application 2020 & 2033
- Table 19: France Online Action Games Market Revenue (billion) Forecast, by Application 2020 & 2033
- Table 20: Russia Online Action Games Market Revenue (billion) Forecast, by Application 2020 & 2033
- Table 21: Spain Online Action Games Market Revenue (billion) Forecast, by Application 2020 & 2033
- Table 22: Rest of Europe Online Action Games Market Revenue (billion) Forecast, by Application 2020 & 2033
- Table 23: Global Online Action Games Market Revenue billion Forecast, by Revenue Model 2020 & 2033
- Table 24: Global Online Action Games Market Revenue billion Forecast, by Platform 2020 & 2033
- Table 25: Global Online Action Games Market Revenue billion Forecast, by Operating System 2020 & 2033
- Table 26: Global Online Action Games Market Revenue billion Forecast, by Country 2020 & 2033
- Table 27: India Online Action Games Market Revenue (billion) Forecast, by Application 2020 & 2033
- Table 28: China Online Action Games Market Revenue (billion) Forecast, by Application 2020 & 2033
- Table 29: Japan Online Action Games Market Revenue (billion) Forecast, by Application 2020 & 2033
- Table 30: Rest of Asia Pacific Online Action Games Market Revenue (billion) Forecast, by Application 2020 & 2033
- Table 31: Global Online Action Games Market Revenue billion Forecast, by Revenue Model 2020 & 2033
- Table 32: Global Online Action Games Market Revenue billion Forecast, by Platform 2020 & 2033
- Table 33: Global Online Action Games Market Revenue billion Forecast, by Operating System 2020 & 2033
- Table 34: Global Online Action Games Market Revenue billion Forecast, by Country 2020 & 2033
- Table 35: Brazil Online Action Games Market Revenue (billion) Forecast, by Application 2020 & 2033
- Table 36: Argentina Online Action Games Market Revenue (billion) Forecast, by Application 2020 & 2033
- Table 37: Global Online Action Games Market Revenue billion Forecast, by Revenue Model 2020 & 2033
- Table 38: Global Online Action Games Market Revenue billion Forecast, by Platform 2020 & 2033
- Table 39: Global Online Action Games Market Revenue billion Forecast, by Operating System 2020 & 2033
- Table 40: Global Online Action Games Market Revenue billion Forecast, by Country 2020 & 2033
- Table 41: United Arab Emirates Online Action Games Market Revenue (billion) Forecast, by Application 2020 & 2033
- Table 42: Saudi Arabia Online Action Games Market Revenue (billion) Forecast, by Application 2020 & 2033
- Table 43: Rest of the Middle East Online Action Games Market Revenue (billion) Forecast, by Application 2020 & 2033
Frequently Asked Questions
1. What is the projected Compound Annual Growth Rate (CAGR) of the Online Action Games Market?
The projected CAGR is approximately 7.2%.
2. Which companies are prominent players in the Online Action Games Market?
Key companies in the market include PlatinumGames, Gameloft, Guerrilla Games, FromSoftware, Konami, SIE Santa Monica Studio, Nintendo EPD, Rocksteady Studios, Tencent, Rockstar North, Sony Interactive Entertainment, EA DICE*List Not Exhaustive, Bethesda Game Studios, Capcom, Ubisoft, id Software.
3. What are the main segments of the Online Action Games Market?
The market segments include Revenue Model, Platform, Operating System.
4. Can you provide details about the market size?
The market size is estimated to be USD 6.39 billion as of 2022.
5. What are some drivers contributing to market growth?
Increased Adoption of Smartphones; Increased Utilization of Gaming Simulation for Training and Analysis Across a Variety of Fields; Growing Demand for VR Headsets.
6. What are the notable trends driving market growth?
Surge in the usage of MMORPG Games.
7. Are there any restraints impacting market growth?
Need for Expensive Graphic Cards.
8. Can you provide examples of recent developments in the market?
In July 2022 - Tom Clancy's The Division® Resurgence, a new free-to-play third-person shooter RPG mobile game from Tom Clancy's The Division franchise, was unveiled by Ubisoft. The Division Resurgence by Tom Clancy is a masterpiece with a fresh plot, a new storyline, and difficult opponent groups. The game is accessible for iOS and Android devices in the App Store® and Google PlayTM.
9. What pricing options are available for accessing the report?
Pricing options include single-user, multi-user, and enterprise licenses priced at USD 4750, USD 5250, and USD 8750 respectively.
10. Is the market size provided in terms of value or volume?
The market size is provided in terms of value, measured in billion.
11. Are there any specific market keywords associated with the report?
Yes, the market keyword associated with the report is "Online Action Games Market," which aids in identifying and referencing the specific market segment covered.
12. How do I determine which pricing option suits my needs best?
The pricing options vary based on user requirements and access needs. Individual users may opt for single-user licenses, while businesses requiring broader access may choose multi-user or enterprise licenses for cost-effective access to the report.
13. Are there any additional resources or data provided in the Online Action Games Market report?
While the report offers comprehensive insights, it's advisable to review the specific contents or supplementary materials provided to ascertain if additional resources or data are available.
14. How can I stay updated on further developments or reports in the Online Action Games Market?
To stay informed about further developments, trends, and reports in the Online Action Games Market, consider subscribing to industry newsletters, following relevant companies and organizations, or regularly checking reputable industry news sources and publications.
Methodology
Step 1 - Identification of Relevant Samples Size from Population Database


Step 2 - Approaches for Defining Global Market Size (Value, Volume* & Price*)

Note*: In applicable scenarios
Step 3 - Data Sources
Primary Research
- Web Analytics
- Survey Reports
- Research Institute
- Latest Research Reports
- Opinion Leaders
Secondary Research
- Annual Reports
- White Paper
- Latest Press Release
- Industry Association
- Paid Database
- Investor Presentations

Step 4 - Data Triangulation
Involves using different sources of information in order to increase the validity of a study
These sources are likely to be stakeholders in a program - participants, other researchers, program staff, other community members, and so on.
Then we put all data in single framework & apply various statistical tools to find out the dynamic on the market.
During the analysis stage, feedback from the stakeholder groups would be compared to determine areas of agreement as well as areas of divergence