

Key Insights
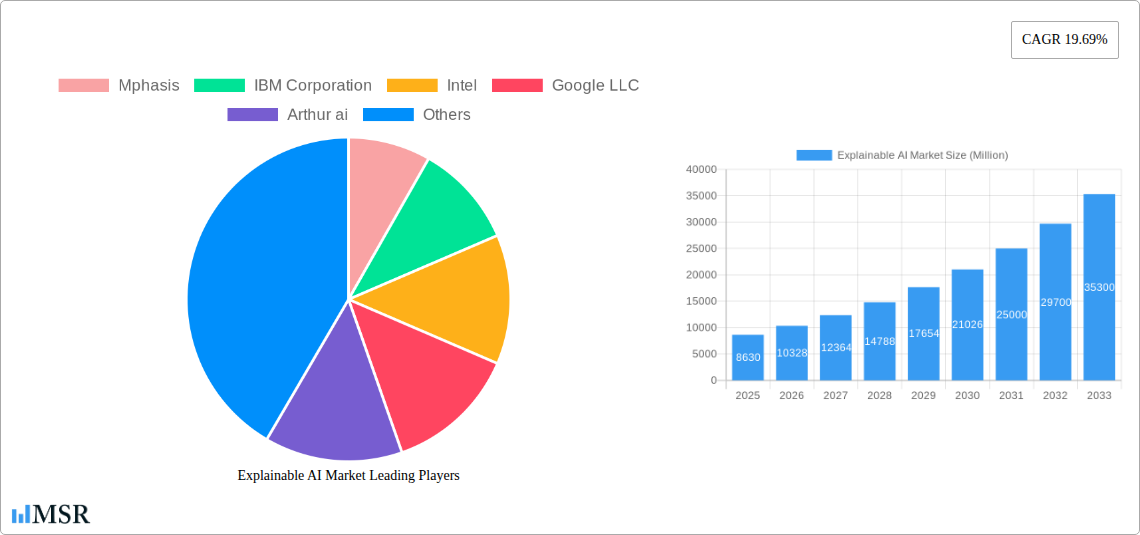
The Explainable AI (XAI) market is experiencing rapid growth, projected to reach \$8.63 billion in 2025 and exhibiting a robust Compound Annual Growth Rate (CAGR) of 19.69%. This expansion is fueled by several key drivers. Increasing demand for transparency and trust in AI-driven decisions across diverse sectors like BFSI (Banking, Financial Services, and Insurance), healthcare, and manufacturing is a primary catalyst. Businesses are increasingly seeking to understand how AI algorithms arrive at their conclusions, mitigating risks associated with bias and ensuring regulatory compliance. Furthermore, advancements in machine learning techniques and the growing adoption of cloud-based AI solutions are streamlining XAI implementation and reducing associated costs. The market is segmented by offering (solutions and services), deployment (cloud and on-premise), and end-user industry. The cloud deployment model is experiencing significant traction due to its scalability, flexibility, and cost-effectiveness. While the BFSI sector currently dominates XAI adoption, substantial growth potential exists in healthcare, driven by the need for explainable diagnostic tools and personalized medicine. However, challenges remain, including the complexity of developing and deploying XAI systems, the need for skilled professionals, and concerns regarding data privacy and security.
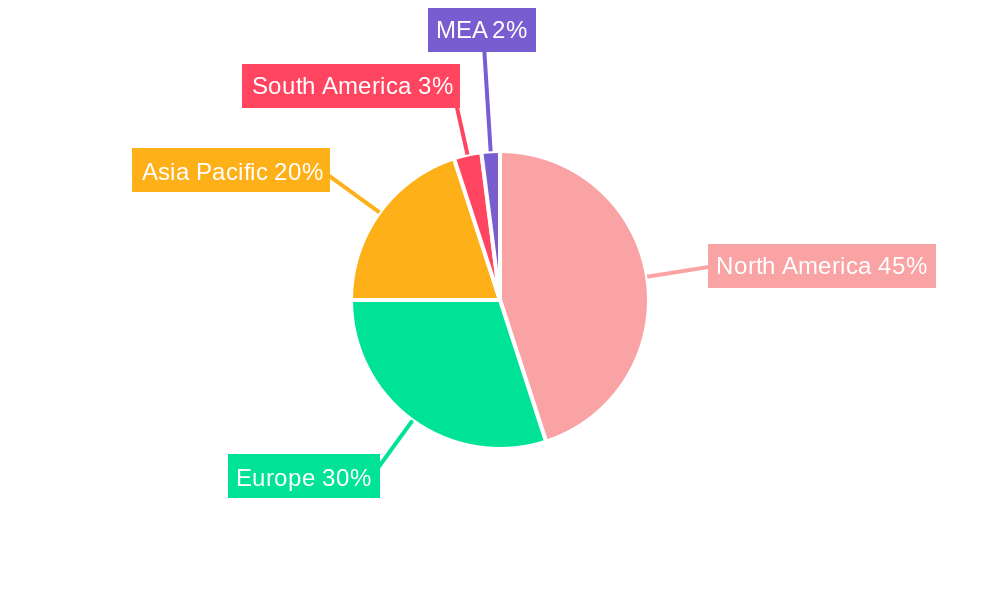
Despite these restraints, the market's trajectory remains strongly positive. The continuous evolution of XAI techniques, coupled with increasing awareness of its benefits, is expected to drive further adoption across various sectors. Geographic expansion is also anticipated, with North America currently holding a significant market share, followed by Europe and Asia Pacific. However, emerging economies in Asia Pacific and South America are expected to witness significant growth in the coming years, spurred by increasing digitalization and government initiatives promoting AI adoption. Competition is fierce, with both established tech giants like IBM, Microsoft, and Google, alongside specialized XAI companies such as Arthur AI and Ditto AI, vying for market share. The long-term outlook for the XAI market remains exceptionally promising, driven by persistent demand for trustworthy and transparent AI systems.
Unlock the Potential of Explainable AI: A Comprehensive Market Report (2019-2033)
This comprehensive report provides an in-depth analysis of the Explainable AI (XAI) market, offering invaluable insights for industry stakeholders, investors, and businesses seeking to navigate this rapidly evolving landscape. The study covers the period 2019-2033, with a focus on the estimated year 2025 and a forecast period of 2025-2033. The market is segmented by offering (Solution, Services), deployment (Cloud, On-premise), and end-user industry (BFSI, Healthcare, Manufacturing, Retail, IT & Telecommunication, Other). Key players analyzed include Mphasis, IBM Corporation, Intel, Google LLC, Arthur AI, Microsoft Corporation, NVIDIA, Amelia US LLC, AWS, Ditto AI, and Altery. The report projects the global XAI market to reach xx Million by 2033, exhibiting a robust CAGR of xx% during the forecast period.
Explainable AI Market Market Concentration & Dynamics
The Explainable AI market exhibits a moderately concentrated landscape, with a few dominant players holding significant market share. However, the market is characterized by intense competition, driven by continuous innovation and the emergence of new entrants. Market share data for 2025 reveals that the top 5 players collectively hold approximately xx% of the market, indicating opportunities for smaller players to carve out niches.
- Innovation Ecosystems: Collaboration between tech giants, startups, and research institutions fuels innovation in XAI algorithms and applications.
- Regulatory Frameworks: Emerging regulations surrounding data privacy and AI ethics are shaping the development and deployment of XAI solutions, particularly in sectors like healthcare and finance. This impacts market growth projections, adding an element of uncertainty.
- Substitute Products: Traditional AI models and rule-based systems remain viable alternatives in certain applications. However, the demand for transparency and explainability is increasing, creating a favorable environment for XAI's growth.
- End-User Trends: The growing need for trustworthy AI systems across various industries is a major driver, especially with the rising concerns of algorithmic bias and lack of transparency in decision-making processes.
- M&A Activities: The number of M&A deals in the XAI sector has seen a xx% increase from 2022-2024, reflecting the strategic importance of XAI technologies for established companies seeking expansion or diversification. This activity is expected to continue driving market consolidation.
Explainable AI Market Industry Insights & Trends
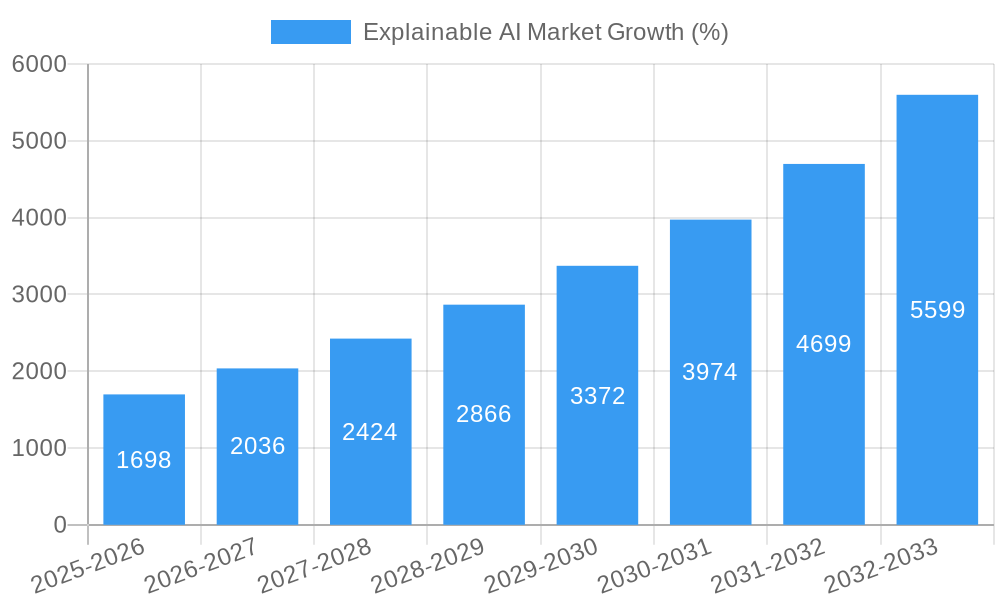
The global Explainable AI market is witnessing exponential growth, propelled by a confluence of factors. The market size in 2025 is estimated at xx Million, indicating the significant traction it is gaining. Several key trends are shaping the market trajectory:
The increasing demand for transparency and accountability in AI-driven decision-making across various sectors like finance (risk assessment), healthcare (diagnosis), and manufacturing (predictive maintenance) is driving market growth. This is further fueled by regulations that require transparency and explainability. Technological advancements like advances in deep learning and natural language processing are leading to the development of more sophisticated XAI models. The shift towards cloud-based AI solutions is accelerating the adoption of XAI, given its scalability and accessibility. Moreover, rising consumer awareness regarding data privacy and ethical AI is creating a greater demand for explainable AI models. These drivers are expected to contribute to the strong CAGR of xx% throughout the forecast period.
Key Markets & Segments Leading Explainable AI Market
The North American region currently dominates the Explainable AI market, owing to the presence of major technology companies, advanced infrastructure, and early adoption of AI technologies. However, the Asia-Pacific region is expected to exhibit the fastest growth rate, driven by increasing digitalization, government initiatives, and a burgeoning tech ecosystem.
- By Offering: The solution segment holds the largest market share, owing to the high demand for pre-built XAI tools and platforms. However, the services segment is expected to show significant growth due to the rising need for customization and integration services.
- By Deployment: Cloud-based deployment is the dominant model, driven by its scalability, cost-effectiveness, and accessibility. On-premise deployment still holds relevance in sectors with stringent data security regulations.
- By End-user Industry: The BFSI sector currently leads in XAI adoption, followed by healthcare. However, manufacturing, retail, and IT & Telecommunication sectors are witnessing rapid growth in XAI adoption.
Drivers for Regional Dominance:
- North America: Strong presence of technology companies, robust R&D investments, and early adoption of new technologies.
- Asia-Pacific: Rapid digitalization, government support for AI initiatives, and growing consumer demand for AI-powered solutions.
Explainable AI Market Product Developments
Recent years have witnessed significant advancements in XAI product development, including the creation of more interpretable models, improved visualization techniques, and the integration of XAI capabilities into existing AI platforms. These innovations have broadened the applicability of XAI across various industries and enhanced its user-friendliness. The development of specialized XAI tools for specific tasks, such as fraud detection and medical diagnosis, has also contributed to the market’s expansion. This focus on application-specific solutions provides a significant competitive edge for companies specializing in these areas.
Challenges in the Explainable AI Market Market
The Explainable AI market faces several challenges, including the complexity of developing and implementing truly explainable AI models, the lack of standardized evaluation metrics for XAI, and the scarcity of skilled professionals with expertise in XAI. Furthermore, data privacy concerns and regulatory hurdles impact adoption rates in some sectors. Competition from traditional AI methods and the high cost of developing and deploying XAI solutions pose further barriers to market expansion. These factors may lead to a slower-than-expected adoption rate in some regions.
Forces Driving Explainable AI Market Growth
Several factors are driving the growth of the Explainable AI market. These include:
- Technological Advancements: Continuous innovation in AI algorithms and model interpretability techniques.
- Economic Growth: Increased investment in AI across various sectors.
- Regulatory Pressures: Growing demand for transparent and accountable AI systems due to tightening regulations. Examples include the GDPR and CCPA.
Challenges in the Explainable AI Market Market
Long-term growth in the Explainable AI market will be fueled by ongoing innovation in model explainability techniques, the development of user-friendly XAI tools, and the expansion of XAI applications into new sectors. Strategic partnerships between technology providers and industry experts will also be crucial for market expansion. Increased adoption in previously untapped markets will contribute significantly to future growth.
Emerging Opportunities in Explainable AI Market
Emerging opportunities include the expansion of XAI into new applications such as autonomous vehicles, personalized medicine, and smart manufacturing. The development of hybrid XAI models combining different explainability techniques will provide more versatile and effective solutions. The rising demand for ethical and responsible AI is creating a favorable environment for the growth of XAI. A key focus area is the application of XAI in resolving ethical dilemmas arising from AI systems.
Leading Players in the Explainable AI Market Sector
- Mphasis
- IBM Corporation
- Intel
- Google LLC
- Arthur AI
- Microsoft Corporation
- NVIDIA
- Amelia US LLC
- AWS
- Ditto AI
- Altery
Key Milestones in Explainable AI Market Industry
- 2020: Increased focus on AI explainability following high-profile instances of algorithmic bias.
- 2021: Several major tech companies released new XAI tools and platforms.
- 2022: Significant growth in venture capital funding for XAI startups.
- 2023: Increased regulatory scrutiny of AI systems, emphasizing the need for explainability.
- 2024: Several key partnerships formed between technology companies and research institutions to advance XAI research.
Strategic Outlook for Explainable AI Market Market
The Explainable AI market holds immense potential for growth, driven by technological innovation, increasing regulatory pressures, and the growing need for trustworthy AI systems across various sectors. Strategic partnerships, targeted investments in R&D, and a focus on user-friendly XAI tools will be crucial for companies seeking to capitalize on this opportunity. The long-term outlook remains positive, with the market expected to witness substantial expansion across diverse geographical regions and industries.
Explainable AI Market Segmentation
-
1. Offering
- 1.1. Solution
- 1.2. Services
-
2. Deployment
- 2.1. Cloud
- 2.2. On-premise
-
3. End-user Industry
- 3.1. BFSI
- 3.2. Healthcare
- 3.3. Manufacturing
- 3.4. Retail
- 3.5. IT and Telecommunication
- 3.6. Other End-user Industries
Explainable AI Market Segmentation By Geography
- 1. North America
- 2. Europe
- 3. Asia
- 4. Australia and New Zealand
- 5. Latin America
- 6. Middle East and Africa
Explainable AI Market REPORT HIGHLIGHTS
| Aspects | Details |
|---|---|
| Study Period | 2019-2033 |
| Base Year | 2024 |
| Estimated Year | 2025 |
| Forecast Period | 2025-2033 |
| Historical Period | 2019-2024 |
| Growth Rate | CAGR of 19.69% from 2019-2033 |
| Segmentation |
|
Table of Contents
- 1. Introduction
- 1.1. Research Scope
- 1.2. Market Segmentation
- 1.3. Research Methodology
- 1.4. Definitions and Assumptions
- 2. Executive Summary
- 2.1. Introduction
- 3. Market Dynamics
- 3.1. Introduction
- 3.2. Market Drivers
- 3.2.1. Growing Need for Accountability and Transparency in AI Systems; Increasing Use of Cutting-edge Technologies for Innovation
- 3.3. Market Restrains
- 3.3.1. High Implementation Cost of Explainable AI; Lack of Skilled and Expert AI Technicians
- 3.4. Market Trends
- 3.4.1. BFSI Segment is Expected to Hold Significant Share of the Market
- 4. Market Factor Analysis
- 4.1. Porters Five Forces
- 4.2. Supply/Value Chain
- 4.3. PESTEL analysis
- 4.4. Market Entropy
- 4.5. Patent/Trademark Analysis
- 5. Global Explainable AI Market Analysis, Insights and Forecast, 2019-2031
- 5.1. Market Analysis, Insights and Forecast - by Offering
- 5.1.1. Solution
- 5.1.2. Services
- 5.2. Market Analysis, Insights and Forecast - by Deployment
- 5.2.1. Cloud
- 5.2.2. On-premise
- 5.3. Market Analysis, Insights and Forecast - by End-user Industry
- 5.3.1. BFSI
- 5.3.2. Healthcare
- 5.3.3. Manufacturing
- 5.3.4. Retail
- 5.3.5. IT and Telecommunication
- 5.3.6. Other End-user Industries
- 5.4. Market Analysis, Insights and Forecast - by Region
- 5.4.1. North America
- 5.4.2. Europe
- 5.4.3. Asia
- 5.4.4. Australia and New Zealand
- 5.4.5. Latin America
- 5.4.6. Middle East and Africa
- 5.1. Market Analysis, Insights and Forecast - by Offering
- 6. North America Explainable AI Market Analysis, Insights and Forecast, 2019-2031
- 6.1. Market Analysis, Insights and Forecast - by Offering
- 6.1.1. Solution
- 6.1.2. Services
- 6.2. Market Analysis, Insights and Forecast - by Deployment
- 6.2.1. Cloud
- 6.2.2. On-premise
- 6.3. Market Analysis, Insights and Forecast - by End-user Industry
- 6.3.1. BFSI
- 6.3.2. Healthcare
- 6.3.3. Manufacturing
- 6.3.4. Retail
- 6.3.5. IT and Telecommunication
- 6.3.6. Other End-user Industries
- 6.1. Market Analysis, Insights and Forecast - by Offering
- 7. Europe Explainable AI Market Analysis, Insights and Forecast, 2019-2031
- 7.1. Market Analysis, Insights and Forecast - by Offering
- 7.1.1. Solution
- 7.1.2. Services
- 7.2. Market Analysis, Insights and Forecast - by Deployment
- 7.2.1. Cloud
- 7.2.2. On-premise
- 7.3. Market Analysis, Insights and Forecast - by End-user Industry
- 7.3.1. BFSI
- 7.3.2. Healthcare
- 7.3.3. Manufacturing
- 7.3.4. Retail
- 7.3.5. IT and Telecommunication
- 7.3.6. Other End-user Industries
- 7.1. Market Analysis, Insights and Forecast - by Offering
- 8. Asia Explainable AI Market Analysis, Insights and Forecast, 2019-2031
- 8.1. Market Analysis, Insights and Forecast - by Offering
- 8.1.1. Solution
- 8.1.2. Services
- 8.2. Market Analysis, Insights and Forecast - by Deployment
- 8.2.1. Cloud
- 8.2.2. On-premise
- 8.3. Market Analysis, Insights and Forecast - by End-user Industry
- 8.3.1. BFSI
- 8.3.2. Healthcare
- 8.3.3. Manufacturing
- 8.3.4. Retail
- 8.3.5. IT and Telecommunication
- 8.3.6. Other End-user Industries
- 8.1. Market Analysis, Insights and Forecast - by Offering
- 9. Australia and New Zealand Explainable AI Market Analysis, Insights and Forecast, 2019-2031
- 9.1. Market Analysis, Insights and Forecast - by Offering
- 9.1.1. Solution
- 9.1.2. Services
- 9.2. Market Analysis, Insights and Forecast - by Deployment
- 9.2.1. Cloud
- 9.2.2. On-premise
- 9.3. Market Analysis, Insights and Forecast - by End-user Industry
- 9.3.1. BFSI
- 9.3.2. Healthcare
- 9.3.3. Manufacturing
- 9.3.4. Retail
- 9.3.5. IT and Telecommunication
- 9.3.6. Other End-user Industries
- 9.1. Market Analysis, Insights and Forecast - by Offering
- 10. Latin America Explainable AI Market Analysis, Insights and Forecast, 2019-2031
- 10.1. Market Analysis, Insights and Forecast - by Offering
- 10.1.1. Solution
- 10.1.2. Services
- 10.2. Market Analysis, Insights and Forecast - by Deployment
- 10.2.1. Cloud
- 10.2.2. On-premise
- 10.3. Market Analysis, Insights and Forecast - by End-user Industry
- 10.3.1. BFSI
- 10.3.2. Healthcare
- 10.3.3. Manufacturing
- 10.3.4. Retail
- 10.3.5. IT and Telecommunication
- 10.3.6. Other End-user Industries
- 10.1. Market Analysis, Insights and Forecast - by Offering
- 11. Middle East and Africa Explainable AI Market Analysis, Insights and Forecast, 2019-2031
- 11.1. Market Analysis, Insights and Forecast - by Offering
- 11.1.1. Solution
- 11.1.2. Services
- 11.2. Market Analysis, Insights and Forecast - by Deployment
- 11.2.1. Cloud
- 11.2.2. On-premise
- 11.3. Market Analysis, Insights and Forecast - by End-user Industry
- 11.3.1. BFSI
- 11.3.2. Healthcare
- 11.3.3. Manufacturing
- 11.3.4. Retail
- 11.3.5. IT and Telecommunication
- 11.3.6. Other End-user Industries
- 11.1. Market Analysis, Insights and Forecast - by Offering
- 12. North America Explainable AI Market Analysis, Insights and Forecast, 2019-2031
- 12.1. Market Analysis, Insights and Forecast - By Country/Sub-region
- 12.1.1 United States
- 12.1.2 Canada
- 12.1.3 Mexico
- 13. Europe Explainable AI Market Analysis, Insights and Forecast, 2019-2031
- 13.1. Market Analysis, Insights and Forecast - By Country/Sub-region
- 13.1.1 Germany
- 13.1.2 United Kingdom
- 13.1.3 France
- 13.1.4 Spain
- 13.1.5 Italy
- 13.1.6 Spain
- 13.1.7 Belgium
- 13.1.8 Netherland
- 13.1.9 Nordics
- 13.1.10 Rest of Europe
- 14. Asia Pacific Explainable AI Market Analysis, Insights and Forecast, 2019-2031
- 14.1. Market Analysis, Insights and Forecast - By Country/Sub-region
- 14.1.1 China
- 14.1.2 Japan
- 14.1.3 India
- 14.1.4 South Korea
- 14.1.5 Southeast Asia
- 14.1.6 Australia
- 14.1.7 Indonesia
- 14.1.8 Phillipes
- 14.1.9 Singapore
- 14.1.10 Thailandc
- 14.1.11 Rest of Asia Pacific
- 15. South America Explainable AI Market Analysis, Insights and Forecast, 2019-2031
- 15.1. Market Analysis, Insights and Forecast - By Country/Sub-region
- 15.1.1 Brazil
- 15.1.2 Argentina
- 15.1.3 Peru
- 15.1.4 Chile
- 15.1.5 Colombia
- 15.1.6 Ecuador
- 15.1.7 Venezuela
- 15.1.8 Rest of South America
- 16. North America Explainable AI Market Analysis, Insights and Forecast, 2019-2031
- 16.1. Market Analysis, Insights and Forecast - By Country/Sub-region
- 16.1.1 United States
- 16.1.2 Canada
- 16.1.3 Mexico
- 17. MEA Explainable AI Market Analysis, Insights and Forecast, 2019-2031
- 17.1. Market Analysis, Insights and Forecast - By Country/Sub-region
- 17.1.1 United Arab Emirates
- 17.1.2 Saudi Arabia
- 17.1.3 South Africa
- 17.1.4 Rest of Middle East and Africa
- 18. Competitive Analysis
- 18.1. Global Market Share Analysis 2024
- 18.2. Company Profiles
- 18.2.1 Mphasis
- 18.2.1.1. Overview
- 18.2.1.2. Products
- 18.2.1.3. SWOT Analysis
- 18.2.1.4. Recent Developments
- 18.2.1.5. Financials (Based on Availability)
- 18.2.2 IBM Corporation
- 18.2.2.1. Overview
- 18.2.2.2. Products
- 18.2.2.3. SWOT Analysis
- 18.2.2.4. Recent Developments
- 18.2.2.5. Financials (Based on Availability)
- 18.2.3 Intel
- 18.2.3.1. Overview
- 18.2.3.2. Products
- 18.2.3.3. SWOT Analysis
- 18.2.3.4. Recent Developments
- 18.2.3.5. Financials (Based on Availability)
- 18.2.4 Google LLC
- 18.2.4.1. Overview
- 18.2.4.2. Products
- 18.2.4.3. SWOT Analysis
- 18.2.4.4. Recent Developments
- 18.2.4.5. Financials (Based on Availability)
- 18.2.5 Arthur ai
- 18.2.5.1. Overview
- 18.2.5.2. Products
- 18.2.5.3. SWOT Analysis
- 18.2.5.4. Recent Developments
- 18.2.5.5. Financials (Based on Availability)
- 18.2.6 Microsoft Corporation
- 18.2.6.1. Overview
- 18.2.6.2. Products
- 18.2.6.3. SWOT Analysis
- 18.2.6.4. Recent Developments
- 18.2.6.5. Financials (Based on Availability)
- 18.2.7 NVIDIA
- 18.2.7.1. Overview
- 18.2.7.2. Products
- 18.2.7.3. SWOT Analysis
- 18.2.7.4. Recent Developments
- 18.2.7.5. Financials (Based on Availability)
- 18.2.8 Amelia US LLC
- 18.2.8.1. Overview
- 18.2.8.2. Products
- 18.2.8.3. SWOT Analysis
- 18.2.8.4. Recent Developments
- 18.2.8.5. Financials (Based on Availability)
- 18.2.9 AWS
- 18.2.9.1. Overview
- 18.2.9.2. Products
- 18.2.9.3. SWOT Analysis
- 18.2.9.4. Recent Developments
- 18.2.9.5. Financials (Based on Availability)
- 18.2.10 Ditto ai
- 18.2.10.1. Overview
- 18.2.10.2. Products
- 18.2.10.3. SWOT Analysis
- 18.2.10.4. Recent Developments
- 18.2.10.5. Financials (Based on Availability)
- 18.2.11 Altery
- 18.2.11.1. Overview
- 18.2.11.2. Products
- 18.2.11.3. SWOT Analysis
- 18.2.11.4. Recent Developments
- 18.2.11.5. Financials (Based on Availability)
- 18.2.1 Mphasis
List of Figures
- Figure 1: Global Explainable AI Market Revenue Breakdown (Million, %) by Region 2024 & 2032
- Figure 2: North America Explainable AI Market Revenue (Million), by Country 2024 & 2032
- Figure 3: North America Explainable AI Market Revenue Share (%), by Country 2024 & 2032
- Figure 4: Europe Explainable AI Market Revenue (Million), by Country 2024 & 2032
- Figure 5: Europe Explainable AI Market Revenue Share (%), by Country 2024 & 2032
- Figure 6: Asia Pacific Explainable AI Market Revenue (Million), by Country 2024 & 2032
- Figure 7: Asia Pacific Explainable AI Market Revenue Share (%), by Country 2024 & 2032
- Figure 8: South America Explainable AI Market Revenue (Million), by Country 2024 & 2032
- Figure 9: South America Explainable AI Market Revenue Share (%), by Country 2024 & 2032
- Figure 10: North America Explainable AI Market Revenue (Million), by Country 2024 & 2032
- Figure 11: North America Explainable AI Market Revenue Share (%), by Country 2024 & 2032
- Figure 12: MEA Explainable AI Market Revenue (Million), by Country 2024 & 2032
- Figure 13: MEA Explainable AI Market Revenue Share (%), by Country 2024 & 2032
- Figure 14: North America Explainable AI Market Revenue (Million), by Offering 2024 & 2032
- Figure 15: North America Explainable AI Market Revenue Share (%), by Offering 2024 & 2032
- Figure 16: North America Explainable AI Market Revenue (Million), by Deployment 2024 & 2032
- Figure 17: North America Explainable AI Market Revenue Share (%), by Deployment 2024 & 2032
- Figure 18: North America Explainable AI Market Revenue (Million), by End-user Industry 2024 & 2032
- Figure 19: North America Explainable AI Market Revenue Share (%), by End-user Industry 2024 & 2032
- Figure 20: North America Explainable AI Market Revenue (Million), by Country 2024 & 2032
- Figure 21: North America Explainable AI Market Revenue Share (%), by Country 2024 & 2032
- Figure 22: Europe Explainable AI Market Revenue (Million), by Offering 2024 & 2032
- Figure 23: Europe Explainable AI Market Revenue Share (%), by Offering 2024 & 2032
- Figure 24: Europe Explainable AI Market Revenue (Million), by Deployment 2024 & 2032
- Figure 25: Europe Explainable AI Market Revenue Share (%), by Deployment 2024 & 2032
- Figure 26: Europe Explainable AI Market Revenue (Million), by End-user Industry 2024 & 2032
- Figure 27: Europe Explainable AI Market Revenue Share (%), by End-user Industry 2024 & 2032
- Figure 28: Europe Explainable AI Market Revenue (Million), by Country 2024 & 2032
- Figure 29: Europe Explainable AI Market Revenue Share (%), by Country 2024 & 2032
- Figure 30: Asia Explainable AI Market Revenue (Million), by Offering 2024 & 2032
- Figure 31: Asia Explainable AI Market Revenue Share (%), by Offering 2024 & 2032
- Figure 32: Asia Explainable AI Market Revenue (Million), by Deployment 2024 & 2032
- Figure 33: Asia Explainable AI Market Revenue Share (%), by Deployment 2024 & 2032
- Figure 34: Asia Explainable AI Market Revenue (Million), by End-user Industry 2024 & 2032
- Figure 35: Asia Explainable AI Market Revenue Share (%), by End-user Industry 2024 & 2032
- Figure 36: Asia Explainable AI Market Revenue (Million), by Country 2024 & 2032
- Figure 37: Asia Explainable AI Market Revenue Share (%), by Country 2024 & 2032
- Figure 38: Australia and New Zealand Explainable AI Market Revenue (Million), by Offering 2024 & 2032
- Figure 39: Australia and New Zealand Explainable AI Market Revenue Share (%), by Offering 2024 & 2032
- Figure 40: Australia and New Zealand Explainable AI Market Revenue (Million), by Deployment 2024 & 2032
- Figure 41: Australia and New Zealand Explainable AI Market Revenue Share (%), by Deployment 2024 & 2032
- Figure 42: Australia and New Zealand Explainable AI Market Revenue (Million), by End-user Industry 2024 & 2032
- Figure 43: Australia and New Zealand Explainable AI Market Revenue Share (%), by End-user Industry 2024 & 2032
- Figure 44: Australia and New Zealand Explainable AI Market Revenue (Million), by Country 2024 & 2032
- Figure 45: Australia and New Zealand Explainable AI Market Revenue Share (%), by Country 2024 & 2032
- Figure 46: Latin America Explainable AI Market Revenue (Million), by Offering 2024 & 2032
- Figure 47: Latin America Explainable AI Market Revenue Share (%), by Offering 2024 & 2032
- Figure 48: Latin America Explainable AI Market Revenue (Million), by Deployment 2024 & 2032
- Figure 49: Latin America Explainable AI Market Revenue Share (%), by Deployment 2024 & 2032
- Figure 50: Latin America Explainable AI Market Revenue (Million), by End-user Industry 2024 & 2032
- Figure 51: Latin America Explainable AI Market Revenue Share (%), by End-user Industry 2024 & 2032
- Figure 52: Latin America Explainable AI Market Revenue (Million), by Country 2024 & 2032
- Figure 53: Latin America Explainable AI Market Revenue Share (%), by Country 2024 & 2032
- Figure 54: Middle East and Africa Explainable AI Market Revenue (Million), by Offering 2024 & 2032
- Figure 55: Middle East and Africa Explainable AI Market Revenue Share (%), by Offering 2024 & 2032
- Figure 56: Middle East and Africa Explainable AI Market Revenue (Million), by Deployment 2024 & 2032
- Figure 57: Middle East and Africa Explainable AI Market Revenue Share (%), by Deployment 2024 & 2032
- Figure 58: Middle East and Africa Explainable AI Market Revenue (Million), by End-user Industry 2024 & 2032
- Figure 59: Middle East and Africa Explainable AI Market Revenue Share (%), by End-user Industry 2024 & 2032
- Figure 60: Middle East and Africa Explainable AI Market Revenue (Million), by Country 2024 & 2032
- Figure 61: Middle East and Africa Explainable AI Market Revenue Share (%), by Country 2024 & 2032
List of Tables
- Table 1: Global Explainable AI Market Revenue Million Forecast, by Region 2019 & 2032
- Table 2: Global Explainable AI Market Revenue Million Forecast, by Offering 2019 & 2032
- Table 3: Global Explainable AI Market Revenue Million Forecast, by Deployment 2019 & 2032
- Table 4: Global Explainable AI Market Revenue Million Forecast, by End-user Industry 2019 & 2032
- Table 5: Global Explainable AI Market Revenue Million Forecast, by Region 2019 & 2032
- Table 6: Global Explainable AI Market Revenue Million Forecast, by Country 2019 & 2032
- Table 7: United States Explainable AI Market Revenue (Million) Forecast, by Application 2019 & 2032
- Table 8: Canada Explainable AI Market Revenue (Million) Forecast, by Application 2019 & 2032
- Table 9: Mexico Explainable AI Market Revenue (Million) Forecast, by Application 2019 & 2032
- Table 10: Global Explainable AI Market Revenue Million Forecast, by Country 2019 & 2032
- Table 11: Germany Explainable AI Market Revenue (Million) Forecast, by Application 2019 & 2032
- Table 12: United Kingdom Explainable AI Market Revenue (Million) Forecast, by Application 2019 & 2032
- Table 13: France Explainable AI Market Revenue (Million) Forecast, by Application 2019 & 2032
- Table 14: Spain Explainable AI Market Revenue (Million) Forecast, by Application 2019 & 2032
- Table 15: Italy Explainable AI Market Revenue (Million) Forecast, by Application 2019 & 2032
- Table 16: Spain Explainable AI Market Revenue (Million) Forecast, by Application 2019 & 2032
- Table 17: Belgium Explainable AI Market Revenue (Million) Forecast, by Application 2019 & 2032
- Table 18: Netherland Explainable AI Market Revenue (Million) Forecast, by Application 2019 & 2032
- Table 19: Nordics Explainable AI Market Revenue (Million) Forecast, by Application 2019 & 2032
- Table 20: Rest of Europe Explainable AI Market Revenue (Million) Forecast, by Application 2019 & 2032
- Table 21: Global Explainable AI Market Revenue Million Forecast, by Country 2019 & 2032
- Table 22: China Explainable AI Market Revenue (Million) Forecast, by Application 2019 & 2032
- Table 23: Japan Explainable AI Market Revenue (Million) Forecast, by Application 2019 & 2032
- Table 24: India Explainable AI Market Revenue (Million) Forecast, by Application 2019 & 2032
- Table 25: South Korea Explainable AI Market Revenue (Million) Forecast, by Application 2019 & 2032
- Table 26: Southeast Asia Explainable AI Market Revenue (Million) Forecast, by Application 2019 & 2032
- Table 27: Australia Explainable AI Market Revenue (Million) Forecast, by Application 2019 & 2032
- Table 28: Indonesia Explainable AI Market Revenue (Million) Forecast, by Application 2019 & 2032
- Table 29: Phillipes Explainable AI Market Revenue (Million) Forecast, by Application 2019 & 2032
- Table 30: Singapore Explainable AI Market Revenue (Million) Forecast, by Application 2019 & 2032
- Table 31: Thailandc Explainable AI Market Revenue (Million) Forecast, by Application 2019 & 2032
- Table 32: Rest of Asia Pacific Explainable AI Market Revenue (Million) Forecast, by Application 2019 & 2032
- Table 33: Global Explainable AI Market Revenue Million Forecast, by Country 2019 & 2032
- Table 34: Brazil Explainable AI Market Revenue (Million) Forecast, by Application 2019 & 2032
- Table 35: Argentina Explainable AI Market Revenue (Million) Forecast, by Application 2019 & 2032
- Table 36: Peru Explainable AI Market Revenue (Million) Forecast, by Application 2019 & 2032
- Table 37: Chile Explainable AI Market Revenue (Million) Forecast, by Application 2019 & 2032
- Table 38: Colombia Explainable AI Market Revenue (Million) Forecast, by Application 2019 & 2032
- Table 39: Ecuador Explainable AI Market Revenue (Million) Forecast, by Application 2019 & 2032
- Table 40: Venezuela Explainable AI Market Revenue (Million) Forecast, by Application 2019 & 2032
- Table 41: Rest of South America Explainable AI Market Revenue (Million) Forecast, by Application 2019 & 2032
- Table 42: Global Explainable AI Market Revenue Million Forecast, by Country 2019 & 2032
- Table 43: United States Explainable AI Market Revenue (Million) Forecast, by Application 2019 & 2032
- Table 44: Canada Explainable AI Market Revenue (Million) Forecast, by Application 2019 & 2032
- Table 45: Mexico Explainable AI Market Revenue (Million) Forecast, by Application 2019 & 2032
- Table 46: Global Explainable AI Market Revenue Million Forecast, by Country 2019 & 2032
- Table 47: United Arab Emirates Explainable AI Market Revenue (Million) Forecast, by Application 2019 & 2032
- Table 48: Saudi Arabia Explainable AI Market Revenue (Million) Forecast, by Application 2019 & 2032
- Table 49: South Africa Explainable AI Market Revenue (Million) Forecast, by Application 2019 & 2032
- Table 50: Rest of Middle East and Africa Explainable AI Market Revenue (Million) Forecast, by Application 2019 & 2032
- Table 51: Global Explainable AI Market Revenue Million Forecast, by Offering 2019 & 2032
- Table 52: Global Explainable AI Market Revenue Million Forecast, by Deployment 2019 & 2032
- Table 53: Global Explainable AI Market Revenue Million Forecast, by End-user Industry 2019 & 2032
- Table 54: Global Explainable AI Market Revenue Million Forecast, by Country 2019 & 2032
- Table 55: Global Explainable AI Market Revenue Million Forecast, by Offering 2019 & 2032
- Table 56: Global Explainable AI Market Revenue Million Forecast, by Deployment 2019 & 2032
- Table 57: Global Explainable AI Market Revenue Million Forecast, by End-user Industry 2019 & 2032
- Table 58: Global Explainable AI Market Revenue Million Forecast, by Country 2019 & 2032
- Table 59: Global Explainable AI Market Revenue Million Forecast, by Offering 2019 & 2032
- Table 60: Global Explainable AI Market Revenue Million Forecast, by Deployment 2019 & 2032
- Table 61: Global Explainable AI Market Revenue Million Forecast, by End-user Industry 2019 & 2032
- Table 62: Global Explainable AI Market Revenue Million Forecast, by Country 2019 & 2032
- Table 63: Global Explainable AI Market Revenue Million Forecast, by Offering 2019 & 2032
- Table 64: Global Explainable AI Market Revenue Million Forecast, by Deployment 2019 & 2032
- Table 65: Global Explainable AI Market Revenue Million Forecast, by End-user Industry 2019 & 2032
- Table 66: Global Explainable AI Market Revenue Million Forecast, by Country 2019 & 2032
- Table 67: Global Explainable AI Market Revenue Million Forecast, by Offering 2019 & 2032
- Table 68: Global Explainable AI Market Revenue Million Forecast, by Deployment 2019 & 2032
- Table 69: Global Explainable AI Market Revenue Million Forecast, by End-user Industry 2019 & 2032
- Table 70: Global Explainable AI Market Revenue Million Forecast, by Country 2019 & 2032
- Table 71: Global Explainable AI Market Revenue Million Forecast, by Offering 2019 & 2032
- Table 72: Global Explainable AI Market Revenue Million Forecast, by Deployment 2019 & 2032
- Table 73: Global Explainable AI Market Revenue Million Forecast, by End-user Industry 2019 & 2032
- Table 74: Global Explainable AI Market Revenue Million Forecast, by Country 2019 & 2032
Frequently Asked Questions
1. What is the projected Compound Annual Growth Rate (CAGR) of the Explainable AI Market?
The projected CAGR is approximately 19.69%.
2. Which companies are prominent players in the Explainable AI Market?
Key companies in the market include Mphasis, IBM Corporation, Intel, Google LLC, Arthur ai, Microsoft Corporation, NVIDIA, Amelia US LLC, AWS, Ditto ai, Altery.
3. What are the main segments of the Explainable AI Market?
The market segments include Offering, Deployment, End-user Industry.
4. Can you provide details about the market size?
The market size is estimated to be USD 8.63 Million as of 2022.
5. What are some drivers contributing to market growth?
Growing Need for Accountability and Transparency in AI Systems; Increasing Use of Cutting-edge Technologies for Innovation.
6. What are the notable trends driving market growth?
BFSI Segment is Expected to Hold Significant Share of the Market.
7. Are there any restraints impacting market growth?
High Implementation Cost of Explainable AI; Lack of Skilled and Expert AI Technicians.
8. Can you provide examples of recent developments in the market?
N/A
9. What pricing options are available for accessing the report?
Pricing options include single-user, multi-user, and enterprise licenses priced at USD 4750, USD 5250, and USD 8750 respectively.
10. Is the market size provided in terms of value or volume?
The market size is provided in terms of value, measured in Million.
11. Are there any specific market keywords associated with the report?
Yes, the market keyword associated with the report is "Explainable AI Market," which aids in identifying and referencing the specific market segment covered.
12. How do I determine which pricing option suits my needs best?
The pricing options vary based on user requirements and access needs. Individual users may opt for single-user licenses, while businesses requiring broader access may choose multi-user or enterprise licenses for cost-effective access to the report.
13. Are there any additional resources or data provided in the Explainable AI Market report?
While the report offers comprehensive insights, it's advisable to review the specific contents or supplementary materials provided to ascertain if additional resources or data are available.
14. How can I stay updated on further developments or reports in the Explainable AI Market?
To stay informed about further developments, trends, and reports in the Explainable AI Market, consider subscribing to industry newsletters, following relevant companies and organizations, or regularly checking reputable industry news sources and publications.
Methodology
Step 1 - Identification of Relevant Samples Size from Population Database


Step 2 - Approaches for Defining Global Market Size (Value, Volume* & Price*)

Note*: In applicable scenarios
Step 3 - Data Sources
Primary Research
- Web Analytics
- Survey Reports
- Research Institute
- Latest Research Reports
- Opinion Leaders
Secondary Research
- Annual Reports
- White Paper
- Latest Press Release
- Industry Association
- Paid Database
- Investor Presentations

Step 4 - Data Triangulation
Involves using different sources of information in order to increase the validity of a study
These sources are likely to be stakeholders in a program - participants, other researchers, program staff, other community members, and so on.
Then we put all data in single framework & apply various statistical tools to find out the dynamic on the market.
During the analysis stage, feedback from the stakeholder groups would be compared to determine areas of agreement as well as areas of divergence
