

Key Insights
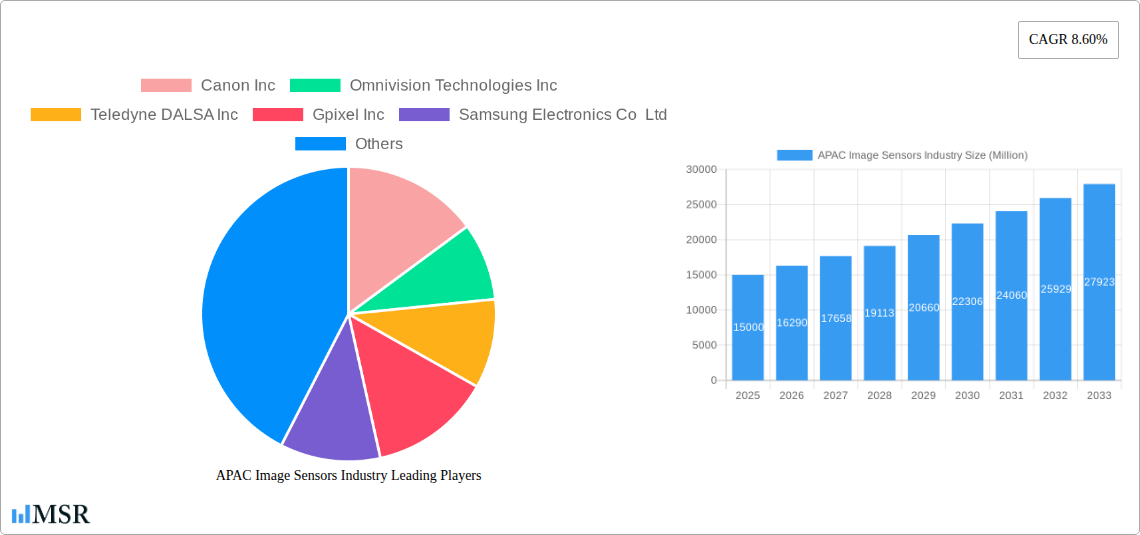
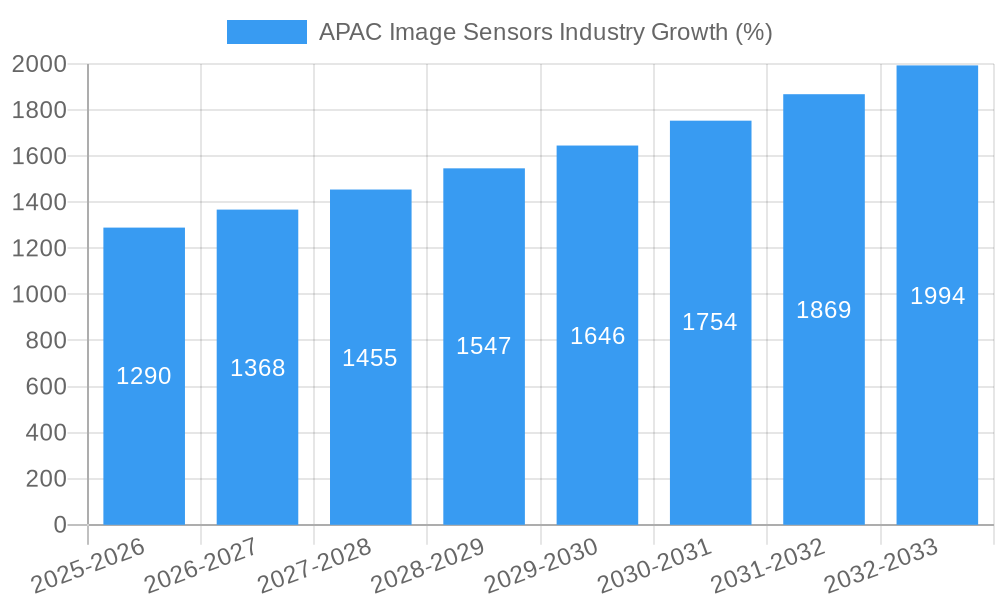
The Asia-Pacific (APAC) image sensor market is experiencing robust growth, fueled by increasing demand across diverse sectors. The region's considerable population, rapid technological advancements, and rising disposable incomes are key drivers. The 8.60% CAGR indicates a significant expansion, projected to continue throughout the forecast period (2025-2033). Consumer electronics, particularly smartphones and wearable devices, are major contributors to this growth, with China and India leading the charge as major manufacturing and consumption hubs. However, the healthcare and automotive sectors are also showing substantial potential, driving demand for high-resolution, low-light, and specialized image sensors. Advancements in artificial intelligence (AI) and machine learning (ML) are further boosting market expansion, as these technologies rely heavily on high-quality image data processing. While supply chain disruptions and component shortages pose challenges, the overall market outlook remains positive. The prevalence of CMOS image sensors over CCD technology due to cost-effectiveness and performance advantages further shapes the market landscape. Competition among major players like Sony, Samsung, and OmniVision is fierce, leading to continuous innovation and price reductions, benefiting consumers and industry stakeholders alike.
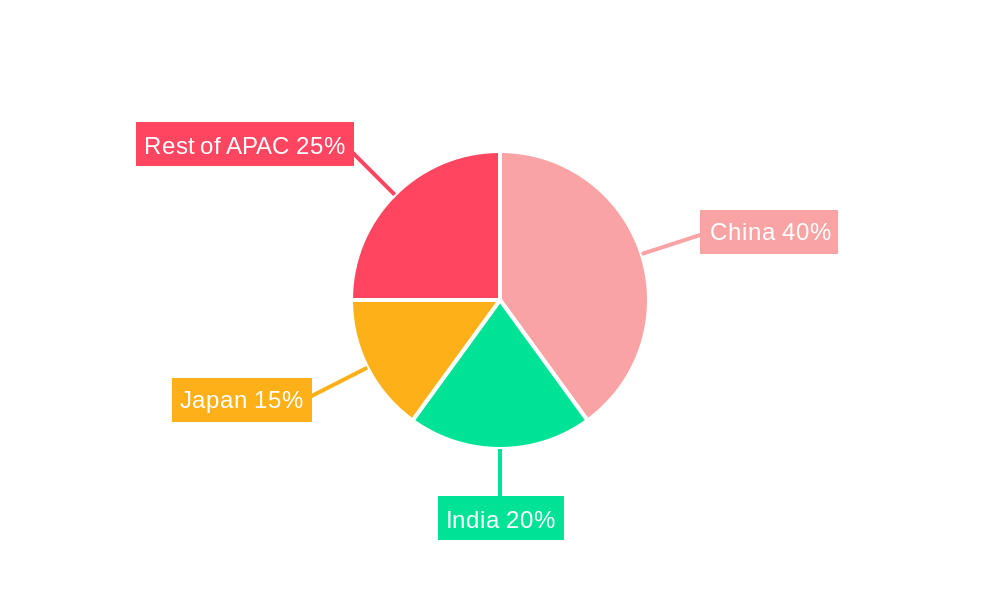
Growth within specific APAC nations reflects unique dynamics. China's massive domestic market and established manufacturing capabilities position it as a dominant force, while India's burgeoning tech sector and expanding middle class fuel significant demand. Japan maintains its technological leadership, contributing advanced sensor technologies. Other Southeast Asian nations are witnessing rapid growth driven by increasing smartphone penetration and infrastructure development. The market segmentation reveals a diversified landscape, with the consumer electronics sector dominating, followed by substantial contributions from healthcare, automotive, and security and surveillance applications. The forecast anticipates continued strong growth across all segments, driven by technological advancements, expanding applications, and increasing adoption rates across diverse end-user industries. Strategic partnerships, mergers and acquisitions, and continued R&D investments will shape the competitive dynamics within the APAC image sensor market in the coming years.
Unlocking Growth in the APAC Image Sensors Market: A Comprehensive Report (2019-2033)
This in-depth report provides a comprehensive analysis of the Asia-Pacific (APAC) image sensors market, offering invaluable insights for stakeholders across the value chain. From market dynamics and leading players to future growth projections, this report is your essential guide to navigating this dynamic industry. The study period covers 2019-2033, with 2025 as the base and estimated year. The forecast period spans 2025-2033, and the historical period encompasses 2019-2024. The report values are expressed in Millions.
APAC Image Sensors Industry Market Concentration & Dynamics
This section delves into the competitive landscape of the APAC image sensors market, analyzing market concentration, innovation ecosystems, regulatory frameworks, substitute products, end-user trends, and mergers & acquisitions (M&A) activities.
The market exhibits a moderately concentrated structure, with key players like Sony Corporation, Samsung Electronics Co Ltd, and Canon Inc holding significant market share. However, the presence of several smaller, innovative companies fosters competition and drives technological advancements. The market share of the top 5 players in 2025 is estimated at 65%, indicating some degree of concentration. The number of M&A deals in the APAC image sensor industry averaged xx per year during the historical period (2019-2024), with a notable increase in xx observed in 2024 driven by consolidation efforts.
- Innovation Ecosystems: Strong government support for R&D in several APAC countries, coupled with a robust pool of engineering talent, fuels innovation within the industry.
- Regulatory Frameworks: Varying regulatory landscapes across different APAC countries can influence market access and investment decisions. Compliance with data privacy regulations is a crucial factor.
- Substitute Products: While image sensors dominate the market, alternative technologies are emerging, including lidar and radar systems. These pose a potential threat in specific applications.
- End-User Trends: The rising adoption of image sensors across diverse end-user industries (consumer electronics, automotive, healthcare, etc.) is a major growth driver. Increased demand for high-resolution, low-light imaging capabilities is shaping product development.
APAC Image Sensors Industry Insights & Trends
The APAC image sensor market is experiencing robust growth, driven by technological advancements, evolving consumer behaviors, and increasing demand across various sectors. The market size reached xx Million in 2024 and is projected to reach xx Million by 2033, registering a CAGR of xx% during the forecast period.
The key drivers include the proliferation of smartphones with advanced camera features, the rapid expansion of the automotive industry (especially ADAS and autonomous driving systems), increasing demand for high-quality medical imaging equipment, and the growing adoption of security and surveillance systems. Technological disruptions, such as the shift towards higher-resolution CMOS image sensors and the development of 3D imaging capabilities, are further propelling market expansion. Consumer preference for high-quality images and videos across various applications also contributes to the growth.
Key Markets & Segments Leading APAC Image Sensors Industry
The CMOS segment dominates the APAC image sensor market, holding a market share of xx% in 2024. This dominance is primarily attributed to its advantages in terms of cost, power consumption, and integration capabilities compared to CCD technology.
Dominant Regions & Countries:
- China: The largest market, driven by strong domestic demand and a vibrant electronics manufacturing sector.
- Japan: A significant player, owing to the presence of leading image sensor manufacturers and advanced technological capabilities.
- South Korea: Significant presence of key manufacturers like Samsung.
- India: Experiencing rapid growth due to increasing smartphone penetration and rising demand from various end-user industries.
Dominant End-User Industries:
- Consumer Electronics: Smartphones, tablets, and digital cameras represent the largest end-user segment.
- Automotive and Transportation: The adoption of advanced driver-assistance systems (ADAS) and autonomous driving technologies is fuelling significant growth in this sector.
- Security and Surveillance: The increasing need for security solutions across both public and private sectors is driving market expansion.
Drivers for Growth:
- Economic Growth: Rising disposable incomes in several APAC countries are fueling demand for consumer electronics and automotive applications.
- Infrastructure Development: Expanding digital infrastructure, including 5G networks and improved internet connectivity, is supporting the adoption of advanced image sensor technologies.
- Government Initiatives: Policies promoting technological innovation and digitalization are positively influencing the industry's growth trajectory.
APAP Image Sensors Industry Product Developments
Recent advancements include high-resolution sensors with improved low-light performance, 3D imaging sensors for depth sensing applications, and specialized sensors for specific needs, such as medical imaging or automotive applications. These developments provide manufacturers with a competitive edge, enabling them to cater to increasingly sophisticated market demands. The integration of AI and machine learning capabilities into image sensors is further enhancing their capabilities and applications.
Challenges in the APAC Image Sensors Industry Market
The APAC image sensor market faces several challenges, including intensifying competition from both established players and new entrants, geopolitical uncertainties impacting supply chains, and the need to comply with increasingly stringent regulatory frameworks concerning data privacy and security. The potential for trade disputes and tariff barriers poses a threat to market stability and growth. Supply chain disruptions caused by events such as pandemics can significantly impact production and delivery schedules.
Forces Driving APAC Image Sensors Industry Growth
The key growth drivers include the technological advancements in sensor technology (higher resolution, improved low-light performance, 3D imaging), increasing demand from various end-user industries (especially automotive, healthcare, and security), and supportive government policies promoting technological innovation and digitalization. The growth of the smartphone and automotive sectors is a major force behind this growth.
Long-Term Growth Catalysts in the APAC Image Sensors Industry Market
Long-term growth is fueled by innovations in sensor technology, such as the development of event-based vision sensors and the integration of artificial intelligence and machine learning. Strategic partnerships and collaborations among sensor manufacturers, system integrators, and end-users are expected to accelerate the adoption of new technologies. The expansion into new markets, particularly in Southeast Asia, and continued investment in R&D will also be key factors driving long-term growth.
Emerging Opportunities in APAC Image Sensors Industry
Emerging opportunities lie in the growing adoption of AI-powered image sensors, the expansion into new applications such as augmented and virtual reality (AR/VR), and the increasing demand for high-performance image sensors for autonomous vehicles and robotics. Furthermore, opportunities exist in developing specialized sensors for niche markets, such as medical imaging and industrial automation.
Leading Players in the APAC Image Sensors Industry Sector
- Canon Inc
- Omnivision Technologies Inc
- Teledyne DALSA Inc
- Gpixel Inc
- Samsung Electronics Co Ltd
- STMicroelectronics NV
- SmartSens Technology Co Ltd
- ON Semiconductor Corporation
- GalaxyCore Inc
- Hynix Inc
- Ams AG
- Panasonic Corporation
- Sony Corporation
Key Milestones in APAC Image Sensors Industry Industry
- 2020: Sony launched its next-generation image sensor with enhanced low-light performance.
- 2021: Samsung announced a strategic partnership with an automotive company to develop advanced image sensors for autonomous driving.
- 2022: Several major M&A activities occurred consolidating market shares.
- 2023: Significant investments in R&D for AI-powered image sensors.
- 2024: New regulations on data privacy increased adoption of secure image sensor technologies.
Strategic Outlook for APAC Image Sensors Industry Market
The APAC image sensors market is poised for sustained growth over the next decade, driven by technological advancements, rising demand across various applications, and favorable economic conditions. Strategic opportunities for players include focusing on innovation, expanding into new markets, forming strategic partnerships, and investing in R&D to develop cutting-edge technologies. The continued growth of the smartphone, automotive, and healthcare sectors will be critical factors determining the overall market trajectory.
APAC Image Sensors Industry Segmentation
-
1. Type
- 1.1. CMOS
- 1.2. CCD
-
2. End-user Industry
- 2.1. Consumer Electronics
- 2.2. Healthcare
- 2.3. Industrial
- 2.4. Security and Surveillance
- 2.5. Automotive and Transportation
- 2.6. Aerospace and Defense
- 2.7. Other End-user Industries
APAC Image Sensors Industry Segmentation By Geography
-
1. North America
- 1.1. United States
- 1.2. Canada
- 1.3. Mexico
-
2. South America
- 2.1. Brazil
- 2.2. Argentina
- 2.3. Rest of South America
-
3. Europe
- 3.1. United Kingdom
- 3.2. Germany
- 3.3. France
- 3.4. Italy
- 3.5. Spain
- 3.6. Russia
- 3.7. Benelux
- 3.8. Nordics
- 3.9. Rest of Europe
-
4. Middle East & Africa
- 4.1. Turkey
- 4.2. Israel
- 4.3. GCC
- 4.4. North Africa
- 4.5. South Africa
- 4.6. Rest of Middle East & Africa
-
5. Asia Pacific
- 5.1. China
- 5.2. India
- 5.3. Japan
- 5.4. South Korea
- 5.5. ASEAN
- 5.6. Oceania
- 5.7. Rest of Asia Pacific
APAC Image Sensors Industry REPORT HIGHLIGHTS
| Aspects | Details |
|---|---|
| Study Period | 2019-2033 |
| Base Year | 2024 |
| Estimated Year | 2025 |
| Forecast Period | 2025-2033 |
| Historical Period | 2019-2024 |
| Growth Rate | CAGR of 8.60% from 2019-2033 |
| Segmentation |
|
Table of Contents
- 1. Introduction
- 1.1. Research Scope
- 1.2. Market Segmentation
- 1.3. Research Methodology
- 1.4. Definitions and Assumptions
- 2. Executive Summary
- 2.1. Introduction
- 3. Market Dynamics
- 3.1. Introduction
- 3.2. Market Drivers
- 3.2.1. ; Rising popularity of ADAS system is Boosting Image Sensor market demandfrom Automotive Sector.; Ongoing shift to CMOS technology and improvement in image quality favouring image sensor market development.
- 3.3. Market Restrains
- 3.3.1. ; Easy availability of light detection and ranging (LiDAR) solutions.
- 3.4. Market Trends
- 3.4.1. Consumer Electronics to Show Significant Growth
- 4. Market Factor Analysis
- 4.1. Porters Five Forces
- 4.2. Supply/Value Chain
- 4.3. PESTEL analysis
- 4.4. Market Entropy
- 4.5. Patent/Trademark Analysis
- 5. Global APAC Image Sensors Industry Analysis, Insights and Forecast, 2019-2031
- 5.1. Market Analysis, Insights and Forecast - by Type
- 5.1.1. CMOS
- 5.1.2. CCD
- 5.2. Market Analysis, Insights and Forecast - by End-user Industry
- 5.2.1. Consumer Electronics
- 5.2.2. Healthcare
- 5.2.3. Industrial
- 5.2.4. Security and Surveillance
- 5.2.5. Automotive and Transportation
- 5.2.6. Aerospace and Defense
- 5.2.7. Other End-user Industries
- 5.3. Market Analysis, Insights and Forecast - by Region
- 5.3.1. North America
- 5.3.2. South America
- 5.3.3. Europe
- 5.3.4. Middle East & Africa
- 5.3.5. Asia Pacific
- 5.1. Market Analysis, Insights and Forecast - by Type
- 6. North America APAC Image Sensors Industry Analysis, Insights and Forecast, 2019-2031
- 6.1. Market Analysis, Insights and Forecast - by Type
- 6.1.1. CMOS
- 6.1.2. CCD
- 6.2. Market Analysis, Insights and Forecast - by End-user Industry
- 6.2.1. Consumer Electronics
- 6.2.2. Healthcare
- 6.2.3. Industrial
- 6.2.4. Security and Surveillance
- 6.2.5. Automotive and Transportation
- 6.2.6. Aerospace and Defense
- 6.2.7. Other End-user Industries
- 6.1. Market Analysis, Insights and Forecast - by Type
- 7. South America APAC Image Sensors Industry Analysis, Insights and Forecast, 2019-2031
- 7.1. Market Analysis, Insights and Forecast - by Type
- 7.1.1. CMOS
- 7.1.2. CCD
- 7.2. Market Analysis, Insights and Forecast - by End-user Industry
- 7.2.1. Consumer Electronics
- 7.2.2. Healthcare
- 7.2.3. Industrial
- 7.2.4. Security and Surveillance
- 7.2.5. Automotive and Transportation
- 7.2.6. Aerospace and Defense
- 7.2.7. Other End-user Industries
- 7.1. Market Analysis, Insights and Forecast - by Type
- 8. Europe APAC Image Sensors Industry Analysis, Insights and Forecast, 2019-2031
- 8.1. Market Analysis, Insights and Forecast - by Type
- 8.1.1. CMOS
- 8.1.2. CCD
- 8.2. Market Analysis, Insights and Forecast - by End-user Industry
- 8.2.1. Consumer Electronics
- 8.2.2. Healthcare
- 8.2.3. Industrial
- 8.2.4. Security and Surveillance
- 8.2.5. Automotive and Transportation
- 8.2.6. Aerospace and Defense
- 8.2.7. Other End-user Industries
- 8.1. Market Analysis, Insights and Forecast - by Type
- 9. Middle East & Africa APAC Image Sensors Industry Analysis, Insights and Forecast, 2019-2031
- 9.1. Market Analysis, Insights and Forecast - by Type
- 9.1.1. CMOS
- 9.1.2. CCD
- 9.2. Market Analysis, Insights and Forecast - by End-user Industry
- 9.2.1. Consumer Electronics
- 9.2.2. Healthcare
- 9.2.3. Industrial
- 9.2.4. Security and Surveillance
- 9.2.5. Automotive and Transportation
- 9.2.6. Aerospace and Defense
- 9.2.7. Other End-user Industries
- 9.1. Market Analysis, Insights and Forecast - by Type
- 10. Asia Pacific APAC Image Sensors Industry Analysis, Insights and Forecast, 2019-2031
- 10.1. Market Analysis, Insights and Forecast - by Type
- 10.1.1. CMOS
- 10.1.2. CCD
- 10.2. Market Analysis, Insights and Forecast - by End-user Industry
- 10.2.1. Consumer Electronics
- 10.2.2. Healthcare
- 10.2.3. Industrial
- 10.2.4. Security and Surveillance
- 10.2.5. Automotive and Transportation
- 10.2.6. Aerospace and Defense
- 10.2.7. Other End-user Industries
- 10.1. Market Analysis, Insights and Forecast - by Type
- 11. North America APAC Image Sensors Industry Analysis, Insights and Forecast, 2019-2031
- 11.1. Market Analysis, Insights and Forecast - By Country/Sub-region
- 11.1.1 United States
- 11.1.2 Canada
- 11.1.3 Mexico
- 12. Europe APAC Image Sensors Industry Analysis, Insights and Forecast, 2019-2031
- 12.1. Market Analysis, Insights and Forecast - By Country/Sub-region
- 12.1.1 Germany
- 12.1.2 United Kingdom
- 12.1.3 France
- 12.1.4 Spain
- 12.1.5 Italy
- 12.1.6 Spain
- 12.1.7 Belgium
- 12.1.8 Netherland
- 12.1.9 Nordics
- 12.1.10 Rest of Europe
- 13. Asia Pacific APAC Image Sensors Industry Analysis, Insights and Forecast, 2019-2031
- 13.1. Market Analysis, Insights and Forecast - By Country/Sub-region
- 13.1.1 China
- 13.1.2 Japan
- 13.1.3 India
- 13.1.4 South Korea
- 13.1.5 Southeast Asia
- 13.1.6 Australia
- 13.1.7 Indonesia
- 13.1.8 Phillipes
- 13.1.9 Singapore
- 13.1.10 Thailandc
- 13.1.11 Rest of Asia Pacific
- 14. South America APAC Image Sensors Industry Analysis, Insights and Forecast, 2019-2031
- 14.1. Market Analysis, Insights and Forecast - By Country/Sub-region
- 14.1.1 Brazil
- 14.1.2 Argentina
- 14.1.3 Peru
- 14.1.4 Chile
- 14.1.5 Colombia
- 14.1.6 Ecuador
- 14.1.7 Venezuela
- 14.1.8 Rest of South America
- 15. North America APAC Image Sensors Industry Analysis, Insights and Forecast, 2019-2031
- 15.1. Market Analysis, Insights and Forecast - By Country/Sub-region
- 15.1.1 United States
- 15.1.2 Canada
- 15.1.3 Mexico
- 16. MEA APAC Image Sensors Industry Analysis, Insights and Forecast, 2019-2031
- 16.1. Market Analysis, Insights and Forecast - By Country/Sub-region
- 16.1.1 United Arab Emirates
- 16.1.2 Saudi Arabia
- 16.1.3 South Africa
- 16.1.4 Rest of Middle East and Africa
- 17. Competitive Analysis
- 17.1. Global Market Share Analysis 2024
- 17.2. Company Profiles
- 17.2.1 Canon Inc
- 17.2.1.1. Overview
- 17.2.1.2. Products
- 17.2.1.3. SWOT Analysis
- 17.2.1.4. Recent Developments
- 17.2.1.5. Financials (Based on Availability)
- 17.2.2 Omnivision Technologies Inc
- 17.2.2.1. Overview
- 17.2.2.2. Products
- 17.2.2.3. SWOT Analysis
- 17.2.2.4. Recent Developments
- 17.2.2.5. Financials (Based on Availability)
- 17.2.3 Teledyne DALSA Inc
- 17.2.3.1. Overview
- 17.2.3.2. Products
- 17.2.3.3. SWOT Analysis
- 17.2.3.4. Recent Developments
- 17.2.3.5. Financials (Based on Availability)
- 17.2.4 Gpixel Inc
- 17.2.4.1. Overview
- 17.2.4.2. Products
- 17.2.4.3. SWOT Analysis
- 17.2.4.4. Recent Developments
- 17.2.4.5. Financials (Based on Availability)
- 17.2.5 Samsung Electronics Co Ltd
- 17.2.5.1. Overview
- 17.2.5.2. Products
- 17.2.5.3. SWOT Analysis
- 17.2.5.4. Recent Developments
- 17.2.5.5. Financials (Based on Availability)
- 17.2.6 STMicroelectronics NV
- 17.2.6.1. Overview
- 17.2.6.2. Products
- 17.2.6.3. SWOT Analysis
- 17.2.6.4. Recent Developments
- 17.2.6.5. Financials (Based on Availability)
- 17.2.7 SmartSens Technology Co Ltd
- 17.2.7.1. Overview
- 17.2.7.2. Products
- 17.2.7.3. SWOT Analysis
- 17.2.7.4. Recent Developments
- 17.2.7.5. Financials (Based on Availability)
- 17.2.8 ON Semiconductor Corporation
- 17.2.8.1. Overview
- 17.2.8.2. Products
- 17.2.8.3. SWOT Analysis
- 17.2.8.4. Recent Developments
- 17.2.8.5. Financials (Based on Availability)
- 17.2.9 GalaxyCore Inc
- 17.2.9.1. Overview
- 17.2.9.2. Products
- 17.2.9.3. SWOT Analysis
- 17.2.9.4. Recent Developments
- 17.2.9.5. Financials (Based on Availability)
- 17.2.10 Hynix Inc
- 17.2.10.1. Overview
- 17.2.10.2. Products
- 17.2.10.3. SWOT Analysis
- 17.2.10.4. Recent Developments
- 17.2.10.5. Financials (Based on Availability)
- 17.2.11 Ams AG
- 17.2.11.1. Overview
- 17.2.11.2. Products
- 17.2.11.3. SWOT Analysis
- 17.2.11.4. Recent Developments
- 17.2.11.5. Financials (Based on Availability)
- 17.2.12 Panasonic Corporation
- 17.2.12.1. Overview
- 17.2.12.2. Products
- 17.2.12.3. SWOT Analysis
- 17.2.12.4. Recent Developments
- 17.2.12.5. Financials (Based on Availability)
- 17.2.13 Sony Corporation
- 17.2.13.1. Overview
- 17.2.13.2. Products
- 17.2.13.3. SWOT Analysis
- 17.2.13.4. Recent Developments
- 17.2.13.5. Financials (Based on Availability)
- 17.2.1 Canon Inc
List of Figures
- Figure 1: Global APAC Image Sensors Industry Revenue Breakdown (Million, %) by Region 2024 & 2032
- Figure 2: Global APAC Image Sensors Industry Volume Breakdown (K Unit, %) by Region 2024 & 2032
- Figure 3: North America APAC Image Sensors Industry Revenue (Million), by Country 2024 & 2032
- Figure 4: North America APAC Image Sensors Industry Volume (K Unit), by Country 2024 & 2032
- Figure 5: North America APAC Image Sensors Industry Revenue Share (%), by Country 2024 & 2032
- Figure 6: North America APAC Image Sensors Industry Volume Share (%), by Country 2024 & 2032
- Figure 7: Europe APAC Image Sensors Industry Revenue (Million), by Country 2024 & 2032
- Figure 8: Europe APAC Image Sensors Industry Volume (K Unit), by Country 2024 & 2032
- Figure 9: Europe APAC Image Sensors Industry Revenue Share (%), by Country 2024 & 2032
- Figure 10: Europe APAC Image Sensors Industry Volume Share (%), by Country 2024 & 2032
- Figure 11: Asia Pacific APAC Image Sensors Industry Revenue (Million), by Country 2024 & 2032
- Figure 12: Asia Pacific APAC Image Sensors Industry Volume (K Unit), by Country 2024 & 2032
- Figure 13: Asia Pacific APAC Image Sensors Industry Revenue Share (%), by Country 2024 & 2032
- Figure 14: Asia Pacific APAC Image Sensors Industry Volume Share (%), by Country 2024 & 2032
- Figure 15: South America APAC Image Sensors Industry Revenue (Million), by Country 2024 & 2032
- Figure 16: South America APAC Image Sensors Industry Volume (K Unit), by Country 2024 & 2032
- Figure 17: South America APAC Image Sensors Industry Revenue Share (%), by Country 2024 & 2032
- Figure 18: South America APAC Image Sensors Industry Volume Share (%), by Country 2024 & 2032
- Figure 19: North America APAC Image Sensors Industry Revenue (Million), by Country 2024 & 2032
- Figure 20: North America APAC Image Sensors Industry Volume (K Unit), by Country 2024 & 2032
- Figure 21: North America APAC Image Sensors Industry Revenue Share (%), by Country 2024 & 2032
- Figure 22: North America APAC Image Sensors Industry Volume Share (%), by Country 2024 & 2032
- Figure 23: MEA APAC Image Sensors Industry Revenue (Million), by Country 2024 & 2032
- Figure 24: MEA APAC Image Sensors Industry Volume (K Unit), by Country 2024 & 2032
- Figure 25: MEA APAC Image Sensors Industry Revenue Share (%), by Country 2024 & 2032
- Figure 26: MEA APAC Image Sensors Industry Volume Share (%), by Country 2024 & 2032
- Figure 27: North America APAC Image Sensors Industry Revenue (Million), by Type 2024 & 2032
- Figure 28: North America APAC Image Sensors Industry Volume (K Unit), by Type 2024 & 2032
- Figure 29: North America APAC Image Sensors Industry Revenue Share (%), by Type 2024 & 2032
- Figure 30: North America APAC Image Sensors Industry Volume Share (%), by Type 2024 & 2032
- Figure 31: North America APAC Image Sensors Industry Revenue (Million), by End-user Industry 2024 & 2032
- Figure 32: North America APAC Image Sensors Industry Volume (K Unit), by End-user Industry 2024 & 2032
- Figure 33: North America APAC Image Sensors Industry Revenue Share (%), by End-user Industry 2024 & 2032
- Figure 34: North America APAC Image Sensors Industry Volume Share (%), by End-user Industry 2024 & 2032
- Figure 35: North America APAC Image Sensors Industry Revenue (Million), by Country 2024 & 2032
- Figure 36: North America APAC Image Sensors Industry Volume (K Unit), by Country 2024 & 2032
- Figure 37: North America APAC Image Sensors Industry Revenue Share (%), by Country 2024 & 2032
- Figure 38: North America APAC Image Sensors Industry Volume Share (%), by Country 2024 & 2032
- Figure 39: South America APAC Image Sensors Industry Revenue (Million), by Type 2024 & 2032
- Figure 40: South America APAC Image Sensors Industry Volume (K Unit), by Type 2024 & 2032
- Figure 41: South America APAC Image Sensors Industry Revenue Share (%), by Type 2024 & 2032
- Figure 42: South America APAC Image Sensors Industry Volume Share (%), by Type 2024 & 2032
- Figure 43: South America APAC Image Sensors Industry Revenue (Million), by End-user Industry 2024 & 2032
- Figure 44: South America APAC Image Sensors Industry Volume (K Unit), by End-user Industry 2024 & 2032
- Figure 45: South America APAC Image Sensors Industry Revenue Share (%), by End-user Industry 2024 & 2032
- Figure 46: South America APAC Image Sensors Industry Volume Share (%), by End-user Industry 2024 & 2032
- Figure 47: South America APAC Image Sensors Industry Revenue (Million), by Country 2024 & 2032
- Figure 48: South America APAC Image Sensors Industry Volume (K Unit), by Country 2024 & 2032
- Figure 49: South America APAC Image Sensors Industry Revenue Share (%), by Country 2024 & 2032
- Figure 50: South America APAC Image Sensors Industry Volume Share (%), by Country 2024 & 2032
- Figure 51: Europe APAC Image Sensors Industry Revenue (Million), by Type 2024 & 2032
- Figure 52: Europe APAC Image Sensors Industry Volume (K Unit), by Type 2024 & 2032
- Figure 53: Europe APAC Image Sensors Industry Revenue Share (%), by Type 2024 & 2032
- Figure 54: Europe APAC Image Sensors Industry Volume Share (%), by Type 2024 & 2032
- Figure 55: Europe APAC Image Sensors Industry Revenue (Million), by End-user Industry 2024 & 2032
- Figure 56: Europe APAC Image Sensors Industry Volume (K Unit), by End-user Industry 2024 & 2032
- Figure 57: Europe APAC Image Sensors Industry Revenue Share (%), by End-user Industry 2024 & 2032
- Figure 58: Europe APAC Image Sensors Industry Volume Share (%), by End-user Industry 2024 & 2032
- Figure 59: Europe APAC Image Sensors Industry Revenue (Million), by Country 2024 & 2032
- Figure 60: Europe APAC Image Sensors Industry Volume (K Unit), by Country 2024 & 2032
- Figure 61: Europe APAC Image Sensors Industry Revenue Share (%), by Country 2024 & 2032
- Figure 62: Europe APAC Image Sensors Industry Volume Share (%), by Country 2024 & 2032
- Figure 63: Middle East & Africa APAC Image Sensors Industry Revenue (Million), by Type 2024 & 2032
- Figure 64: Middle East & Africa APAC Image Sensors Industry Volume (K Unit), by Type 2024 & 2032
- Figure 65: Middle East & Africa APAC Image Sensors Industry Revenue Share (%), by Type 2024 & 2032
- Figure 66: Middle East & Africa APAC Image Sensors Industry Volume Share (%), by Type 2024 & 2032
- Figure 67: Middle East & Africa APAC Image Sensors Industry Revenue (Million), by End-user Industry 2024 & 2032
- Figure 68: Middle East & Africa APAC Image Sensors Industry Volume (K Unit), by End-user Industry 2024 & 2032
- Figure 69: Middle East & Africa APAC Image Sensors Industry Revenue Share (%), by End-user Industry 2024 & 2032
- Figure 70: Middle East & Africa APAC Image Sensors Industry Volume Share (%), by End-user Industry 2024 & 2032
- Figure 71: Middle East & Africa APAC Image Sensors Industry Revenue (Million), by Country 2024 & 2032
- Figure 72: Middle East & Africa APAC Image Sensors Industry Volume (K Unit), by Country 2024 & 2032
- Figure 73: Middle East & Africa APAC Image Sensors Industry Revenue Share (%), by Country 2024 & 2032
- Figure 74: Middle East & Africa APAC Image Sensors Industry Volume Share (%), by Country 2024 & 2032
- Figure 75: Asia Pacific APAC Image Sensors Industry Revenue (Million), by Type 2024 & 2032
- Figure 76: Asia Pacific APAC Image Sensors Industry Volume (K Unit), by Type 2024 & 2032
- Figure 77: Asia Pacific APAC Image Sensors Industry Revenue Share (%), by Type 2024 & 2032
- Figure 78: Asia Pacific APAC Image Sensors Industry Volume Share (%), by Type 2024 & 2032
- Figure 79: Asia Pacific APAC Image Sensors Industry Revenue (Million), by End-user Industry 2024 & 2032
- Figure 80: Asia Pacific APAC Image Sensors Industry Volume (K Unit), by End-user Industry 2024 & 2032
- Figure 81: Asia Pacific APAC Image Sensors Industry Revenue Share (%), by End-user Industry 2024 & 2032
- Figure 82: Asia Pacific APAC Image Sensors Industry Volume Share (%), by End-user Industry 2024 & 2032
- Figure 83: Asia Pacific APAC Image Sensors Industry Revenue (Million), by Country 2024 & 2032
- Figure 84: Asia Pacific APAC Image Sensors Industry Volume (K Unit), by Country 2024 & 2032
- Figure 85: Asia Pacific APAC Image Sensors Industry Revenue Share (%), by Country 2024 & 2032
- Figure 86: Asia Pacific APAC Image Sensors Industry Volume Share (%), by Country 2024 & 2032
List of Tables
- Table 1: Global APAC Image Sensors Industry Revenue Million Forecast, by Region 2019 & 2032
- Table 2: Global APAC Image Sensors Industry Volume K Unit Forecast, by Region 2019 & 2032
- Table 3: Global APAC Image Sensors Industry Revenue Million Forecast, by Type 2019 & 2032
- Table 4: Global APAC Image Sensors Industry Volume K Unit Forecast, by Type 2019 & 2032
- Table 5: Global APAC Image Sensors Industry Revenue Million Forecast, by End-user Industry 2019 & 2032
- Table 6: Global APAC Image Sensors Industry Volume K Unit Forecast, by End-user Industry 2019 & 2032
- Table 7: Global APAC Image Sensors Industry Revenue Million Forecast, by Region 2019 & 2032
- Table 8: Global APAC Image Sensors Industry Volume K Unit Forecast, by Region 2019 & 2032
- Table 9: Global APAC Image Sensors Industry Revenue Million Forecast, by Country 2019 & 2032
- Table 10: Global APAC Image Sensors Industry Volume K Unit Forecast, by Country 2019 & 2032
- Table 11: United States APAC Image Sensors Industry Revenue (Million) Forecast, by Application 2019 & 2032
- Table 12: United States APAC Image Sensors Industry Volume (K Unit) Forecast, by Application 2019 & 2032
- Table 13: Canada APAC Image Sensors Industry Revenue (Million) Forecast, by Application 2019 & 2032
- Table 14: Canada APAC Image Sensors Industry Volume (K Unit) Forecast, by Application 2019 & 2032
- Table 15: Mexico APAC Image Sensors Industry Revenue (Million) Forecast, by Application 2019 & 2032
- Table 16: Mexico APAC Image Sensors Industry Volume (K Unit) Forecast, by Application 2019 & 2032
- Table 17: Global APAC Image Sensors Industry Revenue Million Forecast, by Country 2019 & 2032
- Table 18: Global APAC Image Sensors Industry Volume K Unit Forecast, by Country 2019 & 2032
- Table 19: Germany APAC Image Sensors Industry Revenue (Million) Forecast, by Application 2019 & 2032
- Table 20: Germany APAC Image Sensors Industry Volume (K Unit) Forecast, by Application 2019 & 2032
- Table 21: United Kingdom APAC Image Sensors Industry Revenue (Million) Forecast, by Application 2019 & 2032
- Table 22: United Kingdom APAC Image Sensors Industry Volume (K Unit) Forecast, by Application 2019 & 2032
- Table 23: France APAC Image Sensors Industry Revenue (Million) Forecast, by Application 2019 & 2032
- Table 24: France APAC Image Sensors Industry Volume (K Unit) Forecast, by Application 2019 & 2032
- Table 25: Spain APAC Image Sensors Industry Revenue (Million) Forecast, by Application 2019 & 2032
- Table 26: Spain APAC Image Sensors Industry Volume (K Unit) Forecast, by Application 2019 & 2032
- Table 27: Italy APAC Image Sensors Industry Revenue (Million) Forecast, by Application 2019 & 2032
- Table 28: Italy APAC Image Sensors Industry Volume (K Unit) Forecast, by Application 2019 & 2032
- Table 29: Spain APAC Image Sensors Industry Revenue (Million) Forecast, by Application 2019 & 2032
- Table 30: Spain APAC Image Sensors Industry Volume (K Unit) Forecast, by Application 2019 & 2032
- Table 31: Belgium APAC Image Sensors Industry Revenue (Million) Forecast, by Application 2019 & 2032
- Table 32: Belgium APAC Image Sensors Industry Volume (K Unit) Forecast, by Application 2019 & 2032
- Table 33: Netherland APAC Image Sensors Industry Revenue (Million) Forecast, by Application 2019 & 2032
- Table 34: Netherland APAC Image Sensors Industry Volume (K Unit) Forecast, by Application 2019 & 2032
- Table 35: Nordics APAC Image Sensors Industry Revenue (Million) Forecast, by Application 2019 & 2032
- Table 36: Nordics APAC Image Sensors Industry Volume (K Unit) Forecast, by Application 2019 & 2032
- Table 37: Rest of Europe APAC Image Sensors Industry Revenue (Million) Forecast, by Application 2019 & 2032
- Table 38: Rest of Europe APAC Image Sensors Industry Volume (K Unit) Forecast, by Application 2019 & 2032
- Table 39: Global APAC Image Sensors Industry Revenue Million Forecast, by Country 2019 & 2032
- Table 40: Global APAC Image Sensors Industry Volume K Unit Forecast, by Country 2019 & 2032
- Table 41: China APAC Image Sensors Industry Revenue (Million) Forecast, by Application 2019 & 2032
- Table 42: China APAC Image Sensors Industry Volume (K Unit) Forecast, by Application 2019 & 2032
- Table 43: Japan APAC Image Sensors Industry Revenue (Million) Forecast, by Application 2019 & 2032
- Table 44: Japan APAC Image Sensors Industry Volume (K Unit) Forecast, by Application 2019 & 2032
- Table 45: India APAC Image Sensors Industry Revenue (Million) Forecast, by Application 2019 & 2032
- Table 46: India APAC Image Sensors Industry Volume (K Unit) Forecast, by Application 2019 & 2032
- Table 47: South Korea APAC Image Sensors Industry Revenue (Million) Forecast, by Application 2019 & 2032
- Table 48: South Korea APAC Image Sensors Industry Volume (K Unit) Forecast, by Application 2019 & 2032
- Table 49: Southeast Asia APAC Image Sensors Industry Revenue (Million) Forecast, by Application 2019 & 2032
- Table 50: Southeast Asia APAC Image Sensors Industry Volume (K Unit) Forecast, by Application 2019 & 2032
- Table 51: Australia APAC Image Sensors Industry Revenue (Million) Forecast, by Application 2019 & 2032
- Table 52: Australia APAC Image Sensors Industry Volume (K Unit) Forecast, by Application 2019 & 2032
- Table 53: Indonesia APAC Image Sensors Industry Revenue (Million) Forecast, by Application 2019 & 2032
- Table 54: Indonesia APAC Image Sensors Industry Volume (K Unit) Forecast, by Application 2019 & 2032
- Table 55: Phillipes APAC Image Sensors Industry Revenue (Million) Forecast, by Application 2019 & 2032
- Table 56: Phillipes APAC Image Sensors Industry Volume (K Unit) Forecast, by Application 2019 & 2032
- Table 57: Singapore APAC Image Sensors Industry Revenue (Million) Forecast, by Application 2019 & 2032
- Table 58: Singapore APAC Image Sensors Industry Volume (K Unit) Forecast, by Application 2019 & 2032
- Table 59: Thailandc APAC Image Sensors Industry Revenue (Million) Forecast, by Application 2019 & 2032
- Table 60: Thailandc APAC Image Sensors Industry Volume (K Unit) Forecast, by Application 2019 & 2032
- Table 61: Rest of Asia Pacific APAC Image Sensors Industry Revenue (Million) Forecast, by Application 2019 & 2032
- Table 62: Rest of Asia Pacific APAC Image Sensors Industry Volume (K Unit) Forecast, by Application 2019 & 2032
- Table 63: Global APAC Image Sensors Industry Revenue Million Forecast, by Country 2019 & 2032
- Table 64: Global APAC Image Sensors Industry Volume K Unit Forecast, by Country 2019 & 2032
- Table 65: Brazil APAC Image Sensors Industry Revenue (Million) Forecast, by Application 2019 & 2032
- Table 66: Brazil APAC Image Sensors Industry Volume (K Unit) Forecast, by Application 2019 & 2032
- Table 67: Argentina APAC Image Sensors Industry Revenue (Million) Forecast, by Application 2019 & 2032
- Table 68: Argentina APAC Image Sensors Industry Volume (K Unit) Forecast, by Application 2019 & 2032
- Table 69: Peru APAC Image Sensors Industry Revenue (Million) Forecast, by Application 2019 & 2032
- Table 70: Peru APAC Image Sensors Industry Volume (K Unit) Forecast, by Application 2019 & 2032
- Table 71: Chile APAC Image Sensors Industry Revenue (Million) Forecast, by Application 2019 & 2032
- Table 72: Chile APAC Image Sensors Industry Volume (K Unit) Forecast, by Application 2019 & 2032
- Table 73: Colombia APAC Image Sensors Industry Revenue (Million) Forecast, by Application 2019 & 2032
- Table 74: Colombia APAC Image Sensors Industry Volume (K Unit) Forecast, by Application 2019 & 2032
- Table 75: Ecuador APAC Image Sensors Industry Revenue (Million) Forecast, by Application 2019 & 2032
- Table 76: Ecuador APAC Image Sensors Industry Volume (K Unit) Forecast, by Application 2019 & 2032
- Table 77: Venezuela APAC Image Sensors Industry Revenue (Million) Forecast, by Application 2019 & 2032
- Table 78: Venezuela APAC Image Sensors Industry Volume (K Unit) Forecast, by Application 2019 & 2032
- Table 79: Rest of South America APAC Image Sensors Industry Revenue (Million) Forecast, by Application 2019 & 2032
- Table 80: Rest of South America APAC Image Sensors Industry Volume (K Unit) Forecast, by Application 2019 & 2032
- Table 81: Global APAC Image Sensors Industry Revenue Million Forecast, by Country 2019 & 2032
- Table 82: Global APAC Image Sensors Industry Volume K Unit Forecast, by Country 2019 & 2032
- Table 83: United States APAC Image Sensors Industry Revenue (Million) Forecast, by Application 2019 & 2032
- Table 84: United States APAC Image Sensors Industry Volume (K Unit) Forecast, by Application 2019 & 2032
- Table 85: Canada APAC Image Sensors Industry Revenue (Million) Forecast, by Application 2019 & 2032
- Table 86: Canada APAC Image Sensors Industry Volume (K Unit) Forecast, by Application 2019 & 2032
- Table 87: Mexico APAC Image Sensors Industry Revenue (Million) Forecast, by Application 2019 & 2032
- Table 88: Mexico APAC Image Sensors Industry Volume (K Unit) Forecast, by Application 2019 & 2032
- Table 89: Global APAC Image Sensors Industry Revenue Million Forecast, by Country 2019 & 2032
- Table 90: Global APAC Image Sensors Industry Volume K Unit Forecast, by Country 2019 & 2032
- Table 91: United Arab Emirates APAC Image Sensors Industry Revenue (Million) Forecast, by Application 2019 & 2032
- Table 92: United Arab Emirates APAC Image Sensors Industry Volume (K Unit) Forecast, by Application 2019 & 2032
- Table 93: Saudi Arabia APAC Image Sensors Industry Revenue (Million) Forecast, by Application 2019 & 2032
- Table 94: Saudi Arabia APAC Image Sensors Industry Volume (K Unit) Forecast, by Application 2019 & 2032
- Table 95: South Africa APAC Image Sensors Industry Revenue (Million) Forecast, by Application 2019 & 2032
- Table 96: South Africa APAC Image Sensors Industry Volume (K Unit) Forecast, by Application 2019 & 2032
- Table 97: Rest of Middle East and Africa APAC Image Sensors Industry Revenue (Million) Forecast, by Application 2019 & 2032
- Table 98: Rest of Middle East and Africa APAC Image Sensors Industry Volume (K Unit) Forecast, by Application 2019 & 2032
- Table 99: Global APAC Image Sensors Industry Revenue Million Forecast, by Type 2019 & 2032
- Table 100: Global APAC Image Sensors Industry Volume K Unit Forecast, by Type 2019 & 2032
- Table 101: Global APAC Image Sensors Industry Revenue Million Forecast, by End-user Industry 2019 & 2032
- Table 102: Global APAC Image Sensors Industry Volume K Unit Forecast, by End-user Industry 2019 & 2032
- Table 103: Global APAC Image Sensors Industry Revenue Million Forecast, by Country 2019 & 2032
- Table 104: Global APAC Image Sensors Industry Volume K Unit Forecast, by Country 2019 & 2032
- Table 105: United States APAC Image Sensors Industry Revenue (Million) Forecast, by Application 2019 & 2032
- Table 106: United States APAC Image Sensors Industry Volume (K Unit) Forecast, by Application 2019 & 2032
- Table 107: Canada APAC Image Sensors Industry Revenue (Million) Forecast, by Application 2019 & 2032
- Table 108: Canada APAC Image Sensors Industry Volume (K Unit) Forecast, by Application 2019 & 2032
- Table 109: Mexico APAC Image Sensors Industry Revenue (Million) Forecast, by Application 2019 & 2032
- Table 110: Mexico APAC Image Sensors Industry Volume (K Unit) Forecast, by Application 2019 & 2032
- Table 111: Global APAC Image Sensors Industry Revenue Million Forecast, by Type 2019 & 2032
- Table 112: Global APAC Image Sensors Industry Volume K Unit Forecast, by Type 2019 & 2032
- Table 113: Global APAC Image Sensors Industry Revenue Million Forecast, by End-user Industry 2019 & 2032
- Table 114: Global APAC Image Sensors Industry Volume K Unit Forecast, by End-user Industry 2019 & 2032
- Table 115: Global APAC Image Sensors Industry Revenue Million Forecast, by Country 2019 & 2032
- Table 116: Global APAC Image Sensors Industry Volume K Unit Forecast, by Country 2019 & 2032
- Table 117: Brazil APAC Image Sensors Industry Revenue (Million) Forecast, by Application 2019 & 2032
- Table 118: Brazil APAC Image Sensors Industry Volume (K Unit) Forecast, by Application 2019 & 2032
- Table 119: Argentina APAC Image Sensors Industry Revenue (Million) Forecast, by Application 2019 & 2032
- Table 120: Argentina APAC Image Sensors Industry Volume (K Unit) Forecast, by Application 2019 & 2032
- Table 121: Rest of South America APAC Image Sensors Industry Revenue (Million) Forecast, by Application 2019 & 2032
- Table 122: Rest of South America APAC Image Sensors Industry Volume (K Unit) Forecast, by Application 2019 & 2032
- Table 123: Global APAC Image Sensors Industry Revenue Million Forecast, by Type 2019 & 2032
- Table 124: Global APAC Image Sensors Industry Volume K Unit Forecast, by Type 2019 & 2032
- Table 125: Global APAC Image Sensors Industry Revenue Million Forecast, by End-user Industry 2019 & 2032
- Table 126: Global APAC Image Sensors Industry Volume K Unit Forecast, by End-user Industry 2019 & 2032
- Table 127: Global APAC Image Sensors Industry Revenue Million Forecast, by Country 2019 & 2032
- Table 128: Global APAC Image Sensors Industry Volume K Unit Forecast, by Country 2019 & 2032
- Table 129: United Kingdom APAC Image Sensors Industry Revenue (Million) Forecast, by Application 2019 & 2032
- Table 130: United Kingdom APAC Image Sensors Industry Volume (K Unit) Forecast, by Application 2019 & 2032
- Table 131: Germany APAC Image Sensors Industry Revenue (Million) Forecast, by Application 2019 & 2032
- Table 132: Germany APAC Image Sensors Industry Volume (K Unit) Forecast, by Application 2019 & 2032
- Table 133: France APAC Image Sensors Industry Revenue (Million) Forecast, by Application 2019 & 2032
- Table 134: France APAC Image Sensors Industry Volume (K Unit) Forecast, by Application 2019 & 2032
- Table 135: Italy APAC Image Sensors Industry Revenue (Million) Forecast, by Application 2019 & 2032
- Table 136: Italy APAC Image Sensors Industry Volume (K Unit) Forecast, by Application 2019 & 2032
- Table 137: Spain APAC Image Sensors Industry Revenue (Million) Forecast, by Application 2019 & 2032
- Table 138: Spain APAC Image Sensors Industry Volume (K Unit) Forecast, by Application 2019 & 2032
- Table 139: Russia APAC Image Sensors Industry Revenue (Million) Forecast, by Application 2019 & 2032
- Table 140: Russia APAC Image Sensors Industry Volume (K Unit) Forecast, by Application 2019 & 2032
- Table 141: Benelux APAC Image Sensors Industry Revenue (Million) Forecast, by Application 2019 & 2032
- Table 142: Benelux APAC Image Sensors Industry Volume (K Unit) Forecast, by Application 2019 & 2032
- Table 143: Nordics APAC Image Sensors Industry Revenue (Million) Forecast, by Application 2019 & 2032
- Table 144: Nordics APAC Image Sensors Industry Volume (K Unit) Forecast, by Application 2019 & 2032
- Table 145: Rest of Europe APAC Image Sensors Industry Revenue (Million) Forecast, by Application 2019 & 2032
- Table 146: Rest of Europe APAC Image Sensors Industry Volume (K Unit) Forecast, by Application 2019 & 2032
- Table 147: Global APAC Image Sensors Industry Revenue Million Forecast, by Type 2019 & 2032
- Table 148: Global APAC Image Sensors Industry Volume K Unit Forecast, by Type 2019 & 2032
- Table 149: Global APAC Image Sensors Industry Revenue Million Forecast, by End-user Industry 2019 & 2032
- Table 150: Global APAC Image Sensors Industry Volume K Unit Forecast, by End-user Industry 2019 & 2032
- Table 151: Global APAC Image Sensors Industry Revenue Million Forecast, by Country 2019 & 2032
- Table 152: Global APAC Image Sensors Industry Volume K Unit Forecast, by Country 2019 & 2032
- Table 153: Turkey APAC Image Sensors Industry Revenue (Million) Forecast, by Application 2019 & 2032
- Table 154: Turkey APAC Image Sensors Industry Volume (K Unit) Forecast, by Application 2019 & 2032
- Table 155: Israel APAC Image Sensors Industry Revenue (Million) Forecast, by Application 2019 & 2032
- Table 156: Israel APAC Image Sensors Industry Volume (K Unit) Forecast, by Application 2019 & 2032
- Table 157: GCC APAC Image Sensors Industry Revenue (Million) Forecast, by Application 2019 & 2032
- Table 158: GCC APAC Image Sensors Industry Volume (K Unit) Forecast, by Application 2019 & 2032
- Table 159: North Africa APAC Image Sensors Industry Revenue (Million) Forecast, by Application 2019 & 2032
- Table 160: North Africa APAC Image Sensors Industry Volume (K Unit) Forecast, by Application 2019 & 2032
- Table 161: South Africa APAC Image Sensors Industry Revenue (Million) Forecast, by Application 2019 & 2032
- Table 162: South Africa APAC Image Sensors Industry Volume (K Unit) Forecast, by Application 2019 & 2032
- Table 163: Rest of Middle East & Africa APAC Image Sensors Industry Revenue (Million) Forecast, by Application 2019 & 2032
- Table 164: Rest of Middle East & Africa APAC Image Sensors Industry Volume (K Unit) Forecast, by Application 2019 & 2032
- Table 165: Global APAC Image Sensors Industry Revenue Million Forecast, by Type 2019 & 2032
- Table 166: Global APAC Image Sensors Industry Volume K Unit Forecast, by Type 2019 & 2032
- Table 167: Global APAC Image Sensors Industry Revenue Million Forecast, by End-user Industry 2019 & 2032
- Table 168: Global APAC Image Sensors Industry Volume K Unit Forecast, by End-user Industry 2019 & 2032
- Table 169: Global APAC Image Sensors Industry Revenue Million Forecast, by Country 2019 & 2032
- Table 170: Global APAC Image Sensors Industry Volume K Unit Forecast, by Country 2019 & 2032
- Table 171: China APAC Image Sensors Industry Revenue (Million) Forecast, by Application 2019 & 2032
- Table 172: China APAC Image Sensors Industry Volume (K Unit) Forecast, by Application 2019 & 2032
- Table 173: India APAC Image Sensors Industry Revenue (Million) Forecast, by Application 2019 & 2032
- Table 174: India APAC Image Sensors Industry Volume (K Unit) Forecast, by Application 2019 & 2032
- Table 175: Japan APAC Image Sensors Industry Revenue (Million) Forecast, by Application 2019 & 2032
- Table 176: Japan APAC Image Sensors Industry Volume (K Unit) Forecast, by Application 2019 & 2032
- Table 177: South Korea APAC Image Sensors Industry Revenue (Million) Forecast, by Application 2019 & 2032
- Table 178: South Korea APAC Image Sensors Industry Volume (K Unit) Forecast, by Application 2019 & 2032
- Table 179: ASEAN APAC Image Sensors Industry Revenue (Million) Forecast, by Application 2019 & 2032
- Table 180: ASEAN APAC Image Sensors Industry Volume (K Unit) Forecast, by Application 2019 & 2032
- Table 181: Oceania APAC Image Sensors Industry Revenue (Million) Forecast, by Application 2019 & 2032
- Table 182: Oceania APAC Image Sensors Industry Volume (K Unit) Forecast, by Application 2019 & 2032
- Table 183: Rest of Asia Pacific APAC Image Sensors Industry Revenue (Million) Forecast, by Application 2019 & 2032
- Table 184: Rest of Asia Pacific APAC Image Sensors Industry Volume (K Unit) Forecast, by Application 2019 & 2032
Frequently Asked Questions
1. What is the projected Compound Annual Growth Rate (CAGR) of the APAC Image Sensors Industry?
The projected CAGR is approximately 8.60%.
2. Which companies are prominent players in the APAC Image Sensors Industry?
Key companies in the market include Canon Inc, Omnivision Technologies Inc, Teledyne DALSA Inc, Gpixel Inc, Samsung Electronics Co Ltd, STMicroelectronics NV, SmartSens Technology Co Ltd , ON Semiconductor Corporation, GalaxyCore Inc, Hynix Inc, Ams AG, Panasonic Corporation, Sony Corporation.
3. What are the main segments of the APAC Image Sensors Industry?
The market segments include Type, End-user Industry.
4. Can you provide details about the market size?
The market size is estimated to be USD XX Million as of 2022.
5. What are some drivers contributing to market growth?
; Rising popularity of ADAS system is Boosting Image Sensor market demandfrom Automotive Sector.; Ongoing shift to CMOS technology and improvement in image quality favouring image sensor market development..
6. What are the notable trends driving market growth?
Consumer Electronics to Show Significant Growth.
7. Are there any restraints impacting market growth?
; Easy availability of light detection and ranging (LiDAR) solutions..
8. Can you provide examples of recent developments in the market?
N/A
9. What pricing options are available for accessing the report?
Pricing options include single-user, multi-user, and enterprise licenses priced at USD 4750, USD 5250, and USD 8750 respectively.
10. Is the market size provided in terms of value or volume?
The market size is provided in terms of value, measured in Million and volume, measured in K Unit.
11. Are there any specific market keywords associated with the report?
Yes, the market keyword associated with the report is "APAC Image Sensors Industry," which aids in identifying and referencing the specific market segment covered.
12. How do I determine which pricing option suits my needs best?
The pricing options vary based on user requirements and access needs. Individual users may opt for single-user licenses, while businesses requiring broader access may choose multi-user or enterprise licenses for cost-effective access to the report.
13. Are there any additional resources or data provided in the APAC Image Sensors Industry report?
While the report offers comprehensive insights, it's advisable to review the specific contents or supplementary materials provided to ascertain if additional resources or data are available.
14. How can I stay updated on further developments or reports in the APAC Image Sensors Industry?
To stay informed about further developments, trends, and reports in the APAC Image Sensors Industry, consider subscribing to industry newsletters, following relevant companies and organizations, or regularly checking reputable industry news sources and publications.
Methodology
Step 1 - Identification of Relevant Samples Size from Population Database


Step 2 - Approaches for Defining Global Market Size (Value, Volume* & Price*)

Note*: In applicable scenarios
Step 3 - Data Sources
Primary Research
- Web Analytics
- Survey Reports
- Research Institute
- Latest Research Reports
- Opinion Leaders
Secondary Research
- Annual Reports
- White Paper
- Latest Press Release
- Industry Association
- Paid Database
- Investor Presentations

Step 4 - Data Triangulation
Involves using different sources of information in order to increase the validity of a study
These sources are likely to be stakeholders in a program - participants, other researchers, program staff, other community members, and so on.
Then we put all data in single framework & apply various statistical tools to find out the dynamic on the market.
During the analysis stage, feedback from the stakeholder groups would be compared to determine areas of agreement as well as areas of divergence
