

Key Insights
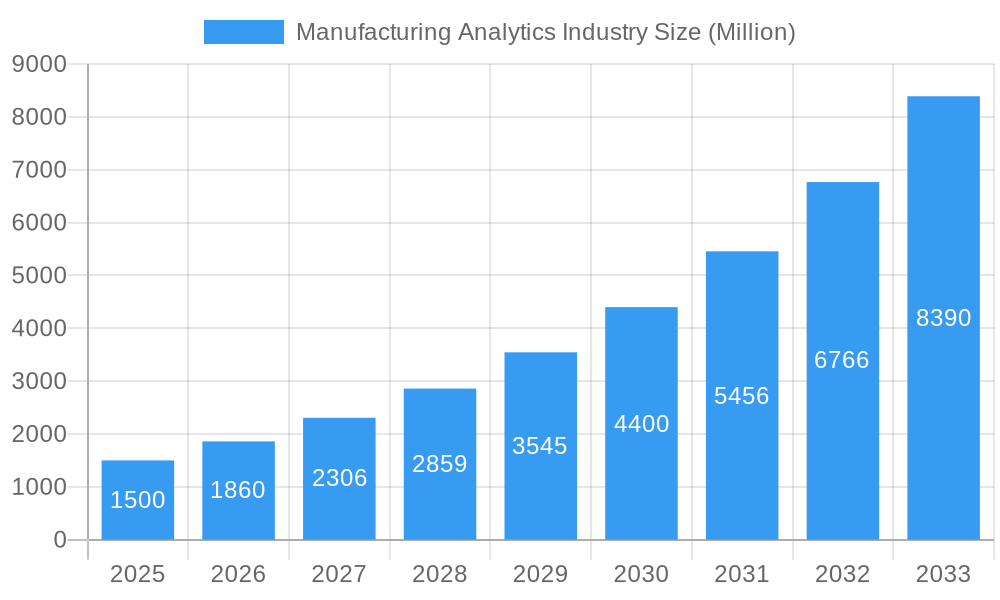
The Manufacturing Analytics market is projected for significant expansion, expected to reach $13.59 billion by 2025, with a robust Compound Annual Growth Rate (CAGR) of 19.23% through 2033. This growth is fueled by manufacturers' need to enhance operational efficiency, reduce costs, and gain a competitive advantage. Key drivers include the adoption of Industry 4.0 technologies, the proliferation of IoT devices generating production data, and the demand for real-time insights to optimize production processes. Predictive maintenance to minimize downtime and supply chain optimization are also significant contributors. The market is increasingly adopting cloud-based deployment models for scalability and flexibility, alongside advanced applications in inventory management.
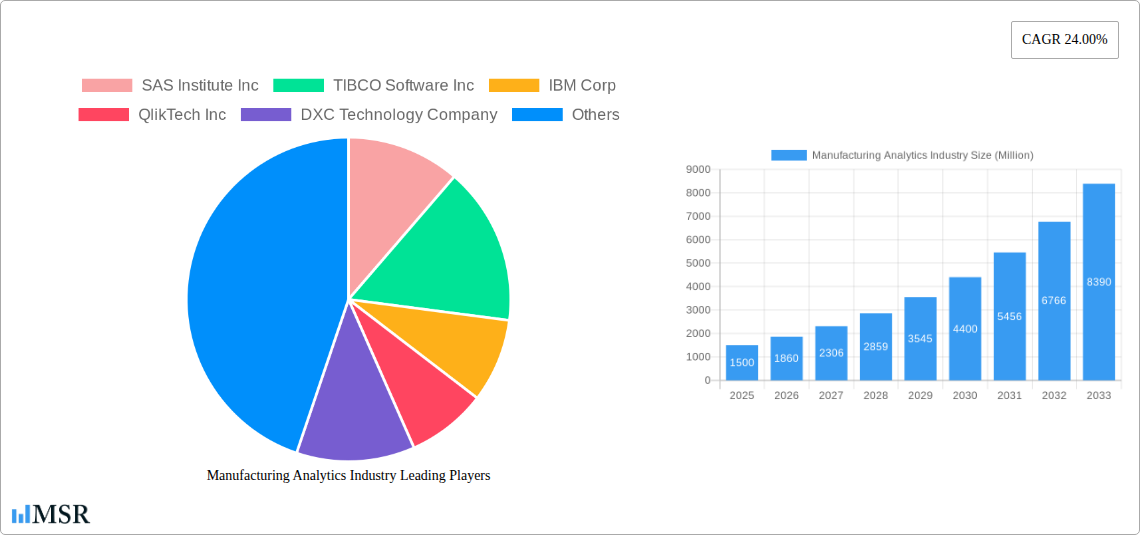
Manufacturing Analytics Industry Market Size (In Billion)
The transformative potential of manufacturing analytics is evident across diverse end-user sectors including Electronics, Oil & Gas, Automotive, Pharmaceutical, and Food & Beverage, where it drives quality control, compliance, and process integrity. While initial implementation costs and data integration challenges exist, advancements in AI and machine learning, coupled with a growing pool of skilled data scientists, are mitigating these restraints, fostering innovation and widespread adoption of manufacturing analytics solutions globally.
Manufacturing Analytics Industry Company Market Share
Manufacturing Analytics Market: Data-Driven Insights for Enhanced Efficiency and Innovation
Discover the power of data in modern manufacturing. This report explores the evolving landscape of manufacturing analytics, essential for optimizing operations, reducing costs, and driving innovation. Gain strategic insights into leveraging advanced analytics for real-time decision-making and a competitive edge in a transforming global market.
Manufacturing Analytics Industry Market Concentration & Dynamics
The manufacturing analytics industry exhibits a moderate to high market concentration, with key players like SAS Institute Inc, TIBCO Software Inc, IBM Corp, QlikTech Inc, and SAP SE dominating significant market share. Innovation ecosystems are thriving, fueled by substantial investments in research and development, leading to frequent product advancements. Regulatory frameworks are evolving to address data privacy and security concerns, particularly in sectors like pharmaceuticals and oil & gas. Substitute products, such as traditional business intelligence tools, are increasingly being augmented or replaced by specialized manufacturing analytics solutions. End-user trends indicate a strong demand for solutions that provide actionable insights into complex operational data. Mergers and acquisitions (M&A) activity is a significant dynamic, with companies strategically acquiring smaller innovative firms to expand their portfolios and market reach. For instance, the past few years have seen an estimated XX M&A deals, signifying a consolidation trend. The overall market share is estimated to be in the range of $XX Million in the base year, with ongoing strategic collaborations between technology providers and manufacturing giants driving future growth.
Manufacturing Analytics Industry Industry Insights & Trends
The manufacturing analytics industry is poised for robust growth, driven by the imperative for enhanced operational efficiency and cost reduction across diverse manufacturing sectors. The market size is projected to reach an estimated $XX Billion by 2033, exhibiting a Compound Annual Growth Rate (CAGR) of approximately XX% during the forecast period (2025–2033). This impressive expansion is fueled by several key factors. The increasing adoption of Industry 4.0 technologies, including the Internet of Things (IoT), artificial intelligence (AI), and machine learning (ML), is generating vast amounts of data that require sophisticated analytical tools for extraction of meaningful insights. Predictive maintenance, a cornerstone application, is revolutionizing asset management by minimizing downtime and reducing maintenance costs, leading to substantial savings for manufacturers. Supply chain optimization is another critical driver, enabling companies to enhance visibility, agility, and resilience in their complex global supply networks. Furthermore, the escalating demand for personalized products and faster time-to-market necessitates advanced analytics for agile production planning and execution. The evolving consumer behavior towards sustainability and ethical manufacturing also plays a role, pushing companies to use analytics for tracking and improving their environmental footprint. The historical period (2019–2024) witnessed a steady rise in adoption, with the base year (2025) serving as a springboard for accelerated growth, further strengthened by ongoing technological advancements and a growing understanding of the ROI from data-driven manufacturing processes.
Key Markets & Segments Leading Manufacturing Analytics Industry
Dominant Region: North America currently leads the manufacturing analytics market, driven by a strong presence of advanced manufacturing facilities, early adoption of digital technologies, and substantial R&D investments. The United States, in particular, benefits from a robust industrial base and a mature technology ecosystem.
Key Deployment Segments:
- Cloud-based Deployment: Experiencing significant growth due to its scalability, flexibility, and cost-effectiveness.
- Drivers: Reduced IT infrastructure costs, faster deployment times, enhanced accessibility, and seamless integration with other cloud services.
- On-premise Deployment: Remains relevant for organizations with stringent data security and regulatory compliance requirements.
- Drivers: Enhanced data control and security for sensitive information, compliance with specific industry regulations.
Leading Application Segments:
- Predictive Maintenance: This segment is a major growth accelerator, enabling manufacturers to forecast equipment failures and schedule maintenance proactively, minimizing costly downtime.
- Drivers: Significant ROI through reduced maintenance costs and improved asset uptime, integration with IoT sensor data.
- Supply Chain Optimization: Crucial for enhancing visibility, efficiency, and resilience in complex global supply chains.
- Drivers: Mitigation of disruptions, improved inventory management, better demand forecasting, and optimized logistics.
- Inventory Management: Essential for reducing holding costs, preventing stockouts, and improving overall working capital efficiency.
- Drivers: Real-time tracking, demand forecasting accuracy, reduction in waste and obsolescence.
Prominent End-user Industries:
- Automotive: High demand for analytics to optimize production lines, manage complex supply chains, and ensure quality control.
- Drivers: Complex assembly processes, stringent quality standards, and a highly competitive market.
- Electronics: Driven by rapid product cycles, demand for miniaturization, and the need for efficient production of high-value components.
- Drivers: Short product lifecycles, high-volume production, and the need for precision manufacturing.
- Oil & Gas: Analytics are critical for optimizing exploration, production, and refining processes, as well as ensuring safety and environmental compliance.
- Drivers: High-risk operations, significant capital investments, and regulatory oversight.
- Pharmaceutical: Analytics are vital for ensuring product quality, regulatory compliance, and efficient production of life-saving drugs.
- Drivers: Strict regulatory requirements, complex manufacturing processes, and a focus on patient safety.
- Food & Beverage: Analytics help in optimizing production, ensuring food safety, managing shelf life, and meeting consumer demand.
- Drivers: Perishable goods, stringent safety standards, and dynamic consumer preferences.
Manufacturing Analytics Industry Product Developments
The manufacturing analytics industry is witnessing a surge in product innovations, characterized by the integration of AI and ML for more sophisticated predictive and prescriptive analytics. Companies are developing advanced platforms offering real-time dashboards, anomaly detection, and automated root cause analysis. These developments focus on enhancing user-friendliness, enabling seamless data integration from disparate sources, and providing actionable insights for operational improvements. Solutions are increasingly being tailored for specific manufacturing sub-sectors, addressing unique challenges and offering specialized functionalities. The emphasis is on delivering tangible ROI through improved efficiency, reduced waste, and enhanced quality control, driving competitive advantage for adopters.
Challenges in the Manufacturing Analytics Industry Market
The manufacturing analytics industry faces several hurdles. High initial implementation costs and the complexity of integrating new analytics solutions with legacy systems remain significant barriers. A shortage of skilled data scientists and analysts capable of interpreting and actioning complex data also presents a challenge. Furthermore, concerns regarding data security and privacy, especially with the increasing adoption of cloud-based solutions, necessitate robust security measures. Overcoming resistance to change within organizations and demonstrating clear ROI to stakeholders are also crucial challenges that need to be addressed for widespread adoption and market growth.
Forces Driving Manufacturing Analytics Industry Growth
Several forces are propelling the growth of the manufacturing analytics industry. The pervasive adoption of Industry 4.0 technologies, particularly the Internet of Things (IoT), is generating massive datasets that require advanced analytics. The relentless pursuit of operational efficiency and cost reduction by manufacturers worldwide is a primary driver. Furthermore, the increasing complexity of global supply chains necessitates greater visibility and optimization capabilities. Regulatory pressures for improved quality, safety, and sustainability are also compelling manufacturers to invest in data-driven insights. The development of more sophisticated AI and ML algorithms is continuously enhancing the predictive and prescriptive power of these analytics solutions, making them indispensable tools for modern manufacturing.
Challenges in the Manufacturing Analytics Industry Market
Long-term growth catalysts for the manufacturing analytics industry lie in continuous innovation and strategic market expansion. The development of more intuitive and user-friendly analytics platforms will broaden adoption beyond highly technical users. Deeper integration with emerging technologies like digital twins and augmented reality will unlock new application areas. Partnerships between analytics providers and industrial automation companies will foster a more holistic approach to smart manufacturing. Furthermore, addressing the specific analytics needs of emerging economies and small and medium-sized enterprises (SMEs) will open up significant new market opportunities.
Emerging Opportunities in Manufacturing Analytics Industry
Emerging opportunities in the manufacturing analytics industry are abundant, driven by the increasing demand for hyper-personalization and the rise of the circular economy. The development of predictive quality analytics, which moves beyond defect detection to predicting and preventing quality issues, represents a significant frontier. Leveraging AI for autonomous decision-making within production processes is another key trend. Furthermore, the growing focus on sustainability and environmental, social, and governance (ESG) reporting is creating a demand for analytics solutions that can track and optimize resource utilization and waste reduction. The expansion of the metaverse and digital twin technologies offers new avenues for virtual testing, simulation, and training, further enhancing the value proposition of manufacturing analytics.
Leading Players in the Manufacturing Analytics Industry Sector
- SAS Institute Inc
- TIBCO Software Inc
- IBM Corp
- QlikTech Inc
- DXC Technology Company
- Wipro Limited
- Northwest Analytics Inc
- Alteryx Inc
- Salesforce com Inc (Tableau Software Inc)
- Oracle Corp
- Sisense Inc
- General Electric Company
- SAP SE
Key Milestones in Manufacturing Analytics Industry Industry
- 2019: Increased adoption of AI/ML in predictive maintenance solutions, leading to an estimated XX% improvement in asset uptime for early adopters.
- 2020: Expansion of cloud-based manufacturing analytics platforms, making advanced analytics more accessible to SMEs.
- 2021: Growing focus on supply chain visibility and risk management analytics in response to global disruptions, with an estimated XX% increase in investment in this area.
- 2022: Introduction of prescriptive analytics capabilities, moving beyond insights to automated recommendations for operational adjustments.
- 2023: Enhanced integration of IoT data with manufacturing analytics platforms, enabling real-time monitoring and control.
- 2024: Rise of industry-specific analytics solutions tailored for sectors like automotive and pharmaceuticals.
- 2025 (Estimated): Emergence of AI-powered autonomous decision-making in production scheduling and resource allocation.
Strategic Outlook for Manufacturing Analytics Industry Market
The strategic outlook for the manufacturing analytics industry is overwhelmingly positive, driven by a confluence of technological advancements and evolving market demands. Key growth accelerators include the deepening integration of AI and ML, the expansion of IoT deployments, and the increasing demand for real-time, actionable insights across the entire manufacturing value chain. Companies that can effectively leverage data for predictive and prescriptive actions, optimize their supply chains, and ensure superior product quality will achieve significant competitive advantages. The future will see a greater emphasis on democratizing analytics, making powerful tools accessible to a wider range of users within organizations, and fostering a data-driven culture for sustained operational excellence and innovation.
Manufacturing Analytics Industry Segmentation
-
1. Deployment
- 1.1. Cloud-based
- 1.2. On-premise
-
2. Appllication
- 2.1. Inventory Management
- 2.2. Supply Chain Optimization
- 2.3. Predictive Maintenance
- 2.4. Other Applications
-
3. End-user Industry
- 3.1. Electronics
- 3.2. Oil & Gas
- 3.3. Automotive
- 3.4. Pharmaceutical
- 3.5. Food & Beverage
- 3.6. Other End-user Industries
Manufacturing Analytics Industry Segmentation By Geography
- 1. North America
- 2. Europe
- 3. Asia Pacific
- 4. Latin America
- 5. Middle East
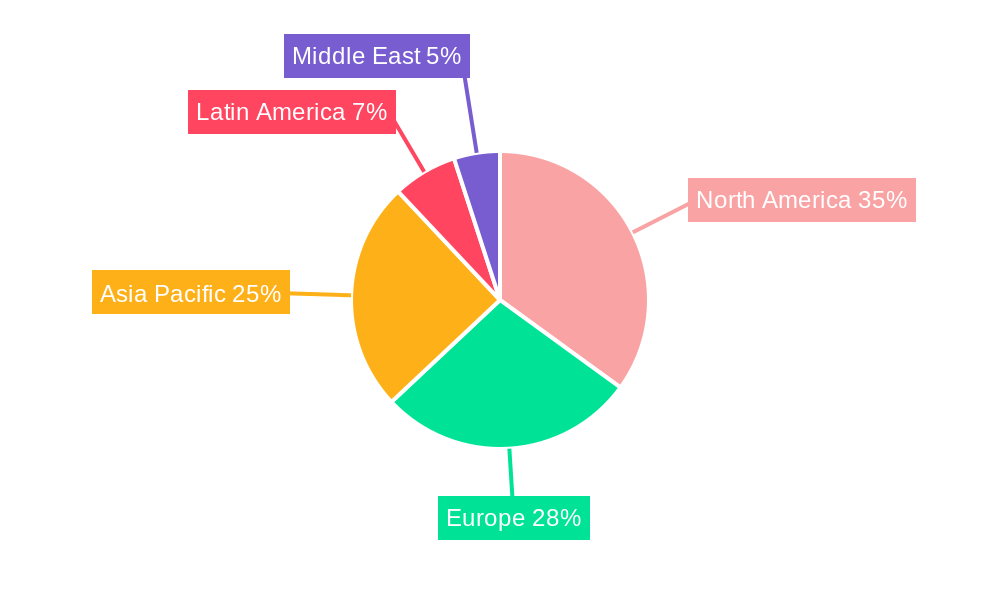
Manufacturing Analytics Industry Regional Market Share
Geographic Coverage of Manufacturing Analytics Industry
Manufacturing Analytics Industry REPORT HIGHLIGHTS
| Aspects | Details |
|---|---|
| Study Period | 2020-2034 |
| Base Year | 2025 |
| Estimated Year | 2026 |
| Forecast Period | 2026-2034 |
| Historical Period | 2020-2025 |
| Growth Rate | CAGR of 19.23% from 2020-2034 |
| Segmentation |
|
Table of Contents
- 1. Introduction
- 1.1. Research Scope
- 1.2. Market Segmentation
- 1.3. Research Methodology
- 1.4. Definitions and Assumptions
- 2. Executive Summary
- 2.1. Introduction
- 3. Market Dynamics
- 3.1. Introduction
- 3.2. Market Drivers
- 3.2.1. ; Adoption of BI and Advanced Data Management Strategies in Manufacturing Applications; Increasing Application of Industry 4.0 Across Various Segments of Manufacturing Industries
- 3.3. Market Restrains
- 3.3.1. ; High Initial Investment in the Transation of IIoT Across Industrial Region
- 3.4. Market Trends
- 3.4.1. Automotive Sector is Expected to Grow at a Significant Rate
- 4. Market Factor Analysis
- 4.1. Porters Five Forces
- 4.2. Supply/Value Chain
- 4.3. PESTEL analysis
- 4.4. Market Entropy
- 4.5. Patent/Trademark Analysis
- 5. Global Manufacturing Analytics Industry Analysis, Insights and Forecast, 2020-2032
- 5.1. Market Analysis, Insights and Forecast - by Deployment
- 5.1.1. Cloud-based
- 5.1.2. On-premise
- 5.2. Market Analysis, Insights and Forecast - by Appllication
- 5.2.1. Inventory Management
- 5.2.2. Supply Chain Optimization
- 5.2.3. Predictive Maintenance
- 5.2.4. Other Applications
- 5.3. Market Analysis, Insights and Forecast - by End-user Industry
- 5.3.1. Electronics
- 5.3.2. Oil & Gas
- 5.3.3. Automotive
- 5.3.4. Pharmaceutical
- 5.3.5. Food & Beverage
- 5.3.6. Other End-user Industries
- 5.4. Market Analysis, Insights and Forecast - by Region
- 5.4.1. North America
- 5.4.2. Europe
- 5.4.3. Asia Pacific
- 5.4.4. Latin America
- 5.4.5. Middle East
- 5.1. Market Analysis, Insights and Forecast - by Deployment
- 6. North America Manufacturing Analytics Industry Analysis, Insights and Forecast, 2020-2032
- 6.1. Market Analysis, Insights and Forecast - by Deployment
- 6.1.1. Cloud-based
- 6.1.2. On-premise
- 6.2. Market Analysis, Insights and Forecast - by Appllication
- 6.2.1. Inventory Management
- 6.2.2. Supply Chain Optimization
- 6.2.3. Predictive Maintenance
- 6.2.4. Other Applications
- 6.3. Market Analysis, Insights and Forecast - by End-user Industry
- 6.3.1. Electronics
- 6.3.2. Oil & Gas
- 6.3.3. Automotive
- 6.3.4. Pharmaceutical
- 6.3.5. Food & Beverage
- 6.3.6. Other End-user Industries
- 6.1. Market Analysis, Insights and Forecast - by Deployment
- 7. Europe Manufacturing Analytics Industry Analysis, Insights and Forecast, 2020-2032
- 7.1. Market Analysis, Insights and Forecast - by Deployment
- 7.1.1. Cloud-based
- 7.1.2. On-premise
- 7.2. Market Analysis, Insights and Forecast - by Appllication
- 7.2.1. Inventory Management
- 7.2.2. Supply Chain Optimization
- 7.2.3. Predictive Maintenance
- 7.2.4. Other Applications
- 7.3. Market Analysis, Insights and Forecast - by End-user Industry
- 7.3.1. Electronics
- 7.3.2. Oil & Gas
- 7.3.3. Automotive
- 7.3.4. Pharmaceutical
- 7.3.5. Food & Beverage
- 7.3.6. Other End-user Industries
- 7.1. Market Analysis, Insights and Forecast - by Deployment
- 8. Asia Pacific Manufacturing Analytics Industry Analysis, Insights and Forecast, 2020-2032
- 8.1. Market Analysis, Insights and Forecast - by Deployment
- 8.1.1. Cloud-based
- 8.1.2. On-premise
- 8.2. Market Analysis, Insights and Forecast - by Appllication
- 8.2.1. Inventory Management
- 8.2.2. Supply Chain Optimization
- 8.2.3. Predictive Maintenance
- 8.2.4. Other Applications
- 8.3. Market Analysis, Insights and Forecast - by End-user Industry
- 8.3.1. Electronics
- 8.3.2. Oil & Gas
- 8.3.3. Automotive
- 8.3.4. Pharmaceutical
- 8.3.5. Food & Beverage
- 8.3.6. Other End-user Industries
- 8.1. Market Analysis, Insights and Forecast - by Deployment
- 9. Latin America Manufacturing Analytics Industry Analysis, Insights and Forecast, 2020-2032
- 9.1. Market Analysis, Insights and Forecast - by Deployment
- 9.1.1. Cloud-based
- 9.1.2. On-premise
- 9.2. Market Analysis, Insights and Forecast - by Appllication
- 9.2.1. Inventory Management
- 9.2.2. Supply Chain Optimization
- 9.2.3. Predictive Maintenance
- 9.2.4. Other Applications
- 9.3. Market Analysis, Insights and Forecast - by End-user Industry
- 9.3.1. Electronics
- 9.3.2. Oil & Gas
- 9.3.3. Automotive
- 9.3.4. Pharmaceutical
- 9.3.5. Food & Beverage
- 9.3.6. Other End-user Industries
- 9.1. Market Analysis, Insights and Forecast - by Deployment
- 10. Middle East Manufacturing Analytics Industry Analysis, Insights and Forecast, 2020-2032
- 10.1. Market Analysis, Insights and Forecast - by Deployment
- 10.1.1. Cloud-based
- 10.1.2. On-premise
- 10.2. Market Analysis, Insights and Forecast - by Appllication
- 10.2.1. Inventory Management
- 10.2.2. Supply Chain Optimization
- 10.2.3. Predictive Maintenance
- 10.2.4. Other Applications
- 10.3. Market Analysis, Insights and Forecast - by End-user Industry
- 10.3.1. Electronics
- 10.3.2. Oil & Gas
- 10.3.3. Automotive
- 10.3.4. Pharmaceutical
- 10.3.5. Food & Beverage
- 10.3.6. Other End-user Industries
- 10.1. Market Analysis, Insights and Forecast - by Deployment
- 11. Competitive Analysis
- 11.1. Global Market Share Analysis 2025
- 11.2. Company Profiles
- 11.2.1 SAS Institute Inc
- 11.2.1.1. Overview
- 11.2.1.2. Products
- 11.2.1.3. SWOT Analysis
- 11.2.1.4. Recent Developments
- 11.2.1.5. Financials (Based on Availability)
- 11.2.2 TIBCO Software Inc
- 11.2.2.1. Overview
- 11.2.2.2. Products
- 11.2.2.3. SWOT Analysis
- 11.2.2.4. Recent Developments
- 11.2.2.5. Financials (Based on Availability)
- 11.2.3 IBM Corp
- 11.2.3.1. Overview
- 11.2.3.2. Products
- 11.2.3.3. SWOT Analysis
- 11.2.3.4. Recent Developments
- 11.2.3.5. Financials (Based on Availability)
- 11.2.4 QlikTech Inc
- 11.2.4.1. Overview
- 11.2.4.2. Products
- 11.2.4.3. SWOT Analysis
- 11.2.4.4. Recent Developments
- 11.2.4.5. Financials (Based on Availability)
- 11.2.5 DXC Technology Company
- 11.2.5.1. Overview
- 11.2.5.2. Products
- 11.2.5.3. SWOT Analysis
- 11.2.5.4. Recent Developments
- 11.2.5.5. Financials (Based on Availability)
- 11.2.6 Wipro Limited
- 11.2.6.1. Overview
- 11.2.6.2. Products
- 11.2.6.3. SWOT Analysis
- 11.2.6.4. Recent Developments
- 11.2.6.5. Financials (Based on Availability)
- 11.2.7 Northwest Analytics Inc
- 11.2.7.1. Overview
- 11.2.7.2. Products
- 11.2.7.3. SWOT Analysis
- 11.2.7.4. Recent Developments
- 11.2.7.5. Financials (Based on Availability)
- 11.2.8 Alteryx Inc
- 11.2.8.1. Overview
- 11.2.8.2. Products
- 11.2.8.3. SWOT Analysis
- 11.2.8.4. Recent Developments
- 11.2.8.5. Financials (Based on Availability)
- 11.2.9 Salesforce com Inc (Tableau Software Inc )
- 11.2.9.1. Overview
- 11.2.9.2. Products
- 11.2.9.3. SWOT Analysis
- 11.2.9.4. Recent Developments
- 11.2.9.5. Financials (Based on Availability)
- 11.2.10 Oracle Corp
- 11.2.10.1. Overview
- 11.2.10.2. Products
- 11.2.10.3. SWOT Analysis
- 11.2.10.4. Recent Developments
- 11.2.10.5. Financials (Based on Availability)
- 11.2.11 Sisense Inc
- 11.2.11.1. Overview
- 11.2.11.2. Products
- 11.2.11.3. SWOT Analysis
- 11.2.11.4. Recent Developments
- 11.2.11.5. Financials (Based on Availability)
- 11.2.12 General Electric Company
- 11.2.12.1. Overview
- 11.2.12.2. Products
- 11.2.12.3. SWOT Analysis
- 11.2.12.4. Recent Developments
- 11.2.12.5. Financials (Based on Availability)
- 11.2.13 SAP SE
- 11.2.13.1. Overview
- 11.2.13.2. Products
- 11.2.13.3. SWOT Analysis
- 11.2.13.4. Recent Developments
- 11.2.13.5. Financials (Based on Availability)
- 11.2.1 SAS Institute Inc
List of Figures
- Figure 1: Global Manufacturing Analytics Industry Revenue Breakdown (billion, %) by Region 2025 & 2033
- Figure 2: Global Manufacturing Analytics Industry Volume Breakdown (K Unit, %) by Region 2025 & 2033
- Figure 3: North America Manufacturing Analytics Industry Revenue (billion), by Deployment 2025 & 2033
- Figure 4: North America Manufacturing Analytics Industry Volume (K Unit), by Deployment 2025 & 2033
- Figure 5: North America Manufacturing Analytics Industry Revenue Share (%), by Deployment 2025 & 2033
- Figure 6: North America Manufacturing Analytics Industry Volume Share (%), by Deployment 2025 & 2033
- Figure 7: North America Manufacturing Analytics Industry Revenue (billion), by Appllication 2025 & 2033
- Figure 8: North America Manufacturing Analytics Industry Volume (K Unit), by Appllication 2025 & 2033
- Figure 9: North America Manufacturing Analytics Industry Revenue Share (%), by Appllication 2025 & 2033
- Figure 10: North America Manufacturing Analytics Industry Volume Share (%), by Appllication 2025 & 2033
- Figure 11: North America Manufacturing Analytics Industry Revenue (billion), by End-user Industry 2025 & 2033
- Figure 12: North America Manufacturing Analytics Industry Volume (K Unit), by End-user Industry 2025 & 2033
- Figure 13: North America Manufacturing Analytics Industry Revenue Share (%), by End-user Industry 2025 & 2033
- Figure 14: North America Manufacturing Analytics Industry Volume Share (%), by End-user Industry 2025 & 2033
- Figure 15: North America Manufacturing Analytics Industry Revenue (billion), by Country 2025 & 2033
- Figure 16: North America Manufacturing Analytics Industry Volume (K Unit), by Country 2025 & 2033
- Figure 17: North America Manufacturing Analytics Industry Revenue Share (%), by Country 2025 & 2033
- Figure 18: North America Manufacturing Analytics Industry Volume Share (%), by Country 2025 & 2033
- Figure 19: Europe Manufacturing Analytics Industry Revenue (billion), by Deployment 2025 & 2033
- Figure 20: Europe Manufacturing Analytics Industry Volume (K Unit), by Deployment 2025 & 2033
- Figure 21: Europe Manufacturing Analytics Industry Revenue Share (%), by Deployment 2025 & 2033
- Figure 22: Europe Manufacturing Analytics Industry Volume Share (%), by Deployment 2025 & 2033
- Figure 23: Europe Manufacturing Analytics Industry Revenue (billion), by Appllication 2025 & 2033
- Figure 24: Europe Manufacturing Analytics Industry Volume (K Unit), by Appllication 2025 & 2033
- Figure 25: Europe Manufacturing Analytics Industry Revenue Share (%), by Appllication 2025 & 2033
- Figure 26: Europe Manufacturing Analytics Industry Volume Share (%), by Appllication 2025 & 2033
- Figure 27: Europe Manufacturing Analytics Industry Revenue (billion), by End-user Industry 2025 & 2033
- Figure 28: Europe Manufacturing Analytics Industry Volume (K Unit), by End-user Industry 2025 & 2033
- Figure 29: Europe Manufacturing Analytics Industry Revenue Share (%), by End-user Industry 2025 & 2033
- Figure 30: Europe Manufacturing Analytics Industry Volume Share (%), by End-user Industry 2025 & 2033
- Figure 31: Europe Manufacturing Analytics Industry Revenue (billion), by Country 2025 & 2033
- Figure 32: Europe Manufacturing Analytics Industry Volume (K Unit), by Country 2025 & 2033
- Figure 33: Europe Manufacturing Analytics Industry Revenue Share (%), by Country 2025 & 2033
- Figure 34: Europe Manufacturing Analytics Industry Volume Share (%), by Country 2025 & 2033
- Figure 35: Asia Pacific Manufacturing Analytics Industry Revenue (billion), by Deployment 2025 & 2033
- Figure 36: Asia Pacific Manufacturing Analytics Industry Volume (K Unit), by Deployment 2025 & 2033
- Figure 37: Asia Pacific Manufacturing Analytics Industry Revenue Share (%), by Deployment 2025 & 2033
- Figure 38: Asia Pacific Manufacturing Analytics Industry Volume Share (%), by Deployment 2025 & 2033
- Figure 39: Asia Pacific Manufacturing Analytics Industry Revenue (billion), by Appllication 2025 & 2033
- Figure 40: Asia Pacific Manufacturing Analytics Industry Volume (K Unit), by Appllication 2025 & 2033
- Figure 41: Asia Pacific Manufacturing Analytics Industry Revenue Share (%), by Appllication 2025 & 2033
- Figure 42: Asia Pacific Manufacturing Analytics Industry Volume Share (%), by Appllication 2025 & 2033
- Figure 43: Asia Pacific Manufacturing Analytics Industry Revenue (billion), by End-user Industry 2025 & 2033
- Figure 44: Asia Pacific Manufacturing Analytics Industry Volume (K Unit), by End-user Industry 2025 & 2033
- Figure 45: Asia Pacific Manufacturing Analytics Industry Revenue Share (%), by End-user Industry 2025 & 2033
- Figure 46: Asia Pacific Manufacturing Analytics Industry Volume Share (%), by End-user Industry 2025 & 2033
- Figure 47: Asia Pacific Manufacturing Analytics Industry Revenue (billion), by Country 2025 & 2033
- Figure 48: Asia Pacific Manufacturing Analytics Industry Volume (K Unit), by Country 2025 & 2033
- Figure 49: Asia Pacific Manufacturing Analytics Industry Revenue Share (%), by Country 2025 & 2033
- Figure 50: Asia Pacific Manufacturing Analytics Industry Volume Share (%), by Country 2025 & 2033
- Figure 51: Latin America Manufacturing Analytics Industry Revenue (billion), by Deployment 2025 & 2033
- Figure 52: Latin America Manufacturing Analytics Industry Volume (K Unit), by Deployment 2025 & 2033
- Figure 53: Latin America Manufacturing Analytics Industry Revenue Share (%), by Deployment 2025 & 2033
- Figure 54: Latin America Manufacturing Analytics Industry Volume Share (%), by Deployment 2025 & 2033
- Figure 55: Latin America Manufacturing Analytics Industry Revenue (billion), by Appllication 2025 & 2033
- Figure 56: Latin America Manufacturing Analytics Industry Volume (K Unit), by Appllication 2025 & 2033
- Figure 57: Latin America Manufacturing Analytics Industry Revenue Share (%), by Appllication 2025 & 2033
- Figure 58: Latin America Manufacturing Analytics Industry Volume Share (%), by Appllication 2025 & 2033
- Figure 59: Latin America Manufacturing Analytics Industry Revenue (billion), by End-user Industry 2025 & 2033
- Figure 60: Latin America Manufacturing Analytics Industry Volume (K Unit), by End-user Industry 2025 & 2033
- Figure 61: Latin America Manufacturing Analytics Industry Revenue Share (%), by End-user Industry 2025 & 2033
- Figure 62: Latin America Manufacturing Analytics Industry Volume Share (%), by End-user Industry 2025 & 2033
- Figure 63: Latin America Manufacturing Analytics Industry Revenue (billion), by Country 2025 & 2033
- Figure 64: Latin America Manufacturing Analytics Industry Volume (K Unit), by Country 2025 & 2033
- Figure 65: Latin America Manufacturing Analytics Industry Revenue Share (%), by Country 2025 & 2033
- Figure 66: Latin America Manufacturing Analytics Industry Volume Share (%), by Country 2025 & 2033
- Figure 67: Middle East Manufacturing Analytics Industry Revenue (billion), by Deployment 2025 & 2033
- Figure 68: Middle East Manufacturing Analytics Industry Volume (K Unit), by Deployment 2025 & 2033
- Figure 69: Middle East Manufacturing Analytics Industry Revenue Share (%), by Deployment 2025 & 2033
- Figure 70: Middle East Manufacturing Analytics Industry Volume Share (%), by Deployment 2025 & 2033
- Figure 71: Middle East Manufacturing Analytics Industry Revenue (billion), by Appllication 2025 & 2033
- Figure 72: Middle East Manufacturing Analytics Industry Volume (K Unit), by Appllication 2025 & 2033
- Figure 73: Middle East Manufacturing Analytics Industry Revenue Share (%), by Appllication 2025 & 2033
- Figure 74: Middle East Manufacturing Analytics Industry Volume Share (%), by Appllication 2025 & 2033
- Figure 75: Middle East Manufacturing Analytics Industry Revenue (billion), by End-user Industry 2025 & 2033
- Figure 76: Middle East Manufacturing Analytics Industry Volume (K Unit), by End-user Industry 2025 & 2033
- Figure 77: Middle East Manufacturing Analytics Industry Revenue Share (%), by End-user Industry 2025 & 2033
- Figure 78: Middle East Manufacturing Analytics Industry Volume Share (%), by End-user Industry 2025 & 2033
- Figure 79: Middle East Manufacturing Analytics Industry Revenue (billion), by Country 2025 & 2033
- Figure 80: Middle East Manufacturing Analytics Industry Volume (K Unit), by Country 2025 & 2033
- Figure 81: Middle East Manufacturing Analytics Industry Revenue Share (%), by Country 2025 & 2033
- Figure 82: Middle East Manufacturing Analytics Industry Volume Share (%), by Country 2025 & 2033
List of Tables
- Table 1: Global Manufacturing Analytics Industry Revenue billion Forecast, by Deployment 2020 & 2033
- Table 2: Global Manufacturing Analytics Industry Volume K Unit Forecast, by Deployment 2020 & 2033
- Table 3: Global Manufacturing Analytics Industry Revenue billion Forecast, by Appllication 2020 & 2033
- Table 4: Global Manufacturing Analytics Industry Volume K Unit Forecast, by Appllication 2020 & 2033
- Table 5: Global Manufacturing Analytics Industry Revenue billion Forecast, by End-user Industry 2020 & 2033
- Table 6: Global Manufacturing Analytics Industry Volume K Unit Forecast, by End-user Industry 2020 & 2033
- Table 7: Global Manufacturing Analytics Industry Revenue billion Forecast, by Region 2020 & 2033
- Table 8: Global Manufacturing Analytics Industry Volume K Unit Forecast, by Region 2020 & 2033
- Table 9: Global Manufacturing Analytics Industry Revenue billion Forecast, by Deployment 2020 & 2033
- Table 10: Global Manufacturing Analytics Industry Volume K Unit Forecast, by Deployment 2020 & 2033
- Table 11: Global Manufacturing Analytics Industry Revenue billion Forecast, by Appllication 2020 & 2033
- Table 12: Global Manufacturing Analytics Industry Volume K Unit Forecast, by Appllication 2020 & 2033
- Table 13: Global Manufacturing Analytics Industry Revenue billion Forecast, by End-user Industry 2020 & 2033
- Table 14: Global Manufacturing Analytics Industry Volume K Unit Forecast, by End-user Industry 2020 & 2033
- Table 15: Global Manufacturing Analytics Industry Revenue billion Forecast, by Country 2020 & 2033
- Table 16: Global Manufacturing Analytics Industry Volume K Unit Forecast, by Country 2020 & 2033
- Table 17: Global Manufacturing Analytics Industry Revenue billion Forecast, by Deployment 2020 & 2033
- Table 18: Global Manufacturing Analytics Industry Volume K Unit Forecast, by Deployment 2020 & 2033
- Table 19: Global Manufacturing Analytics Industry Revenue billion Forecast, by Appllication 2020 & 2033
- Table 20: Global Manufacturing Analytics Industry Volume K Unit Forecast, by Appllication 2020 & 2033
- Table 21: Global Manufacturing Analytics Industry Revenue billion Forecast, by End-user Industry 2020 & 2033
- Table 22: Global Manufacturing Analytics Industry Volume K Unit Forecast, by End-user Industry 2020 & 2033
- Table 23: Global Manufacturing Analytics Industry Revenue billion Forecast, by Country 2020 & 2033
- Table 24: Global Manufacturing Analytics Industry Volume K Unit Forecast, by Country 2020 & 2033
- Table 25: Global Manufacturing Analytics Industry Revenue billion Forecast, by Deployment 2020 & 2033
- Table 26: Global Manufacturing Analytics Industry Volume K Unit Forecast, by Deployment 2020 & 2033
- Table 27: Global Manufacturing Analytics Industry Revenue billion Forecast, by Appllication 2020 & 2033
- Table 28: Global Manufacturing Analytics Industry Volume K Unit Forecast, by Appllication 2020 & 2033
- Table 29: Global Manufacturing Analytics Industry Revenue billion Forecast, by End-user Industry 2020 & 2033
- Table 30: Global Manufacturing Analytics Industry Volume K Unit Forecast, by End-user Industry 2020 & 2033
- Table 31: Global Manufacturing Analytics Industry Revenue billion Forecast, by Country 2020 & 2033
- Table 32: Global Manufacturing Analytics Industry Volume K Unit Forecast, by Country 2020 & 2033
- Table 33: Global Manufacturing Analytics Industry Revenue billion Forecast, by Deployment 2020 & 2033
- Table 34: Global Manufacturing Analytics Industry Volume K Unit Forecast, by Deployment 2020 & 2033
- Table 35: Global Manufacturing Analytics Industry Revenue billion Forecast, by Appllication 2020 & 2033
- Table 36: Global Manufacturing Analytics Industry Volume K Unit Forecast, by Appllication 2020 & 2033
- Table 37: Global Manufacturing Analytics Industry Revenue billion Forecast, by End-user Industry 2020 & 2033
- Table 38: Global Manufacturing Analytics Industry Volume K Unit Forecast, by End-user Industry 2020 & 2033
- Table 39: Global Manufacturing Analytics Industry Revenue billion Forecast, by Country 2020 & 2033
- Table 40: Global Manufacturing Analytics Industry Volume K Unit Forecast, by Country 2020 & 2033
- Table 41: Global Manufacturing Analytics Industry Revenue billion Forecast, by Deployment 2020 & 2033
- Table 42: Global Manufacturing Analytics Industry Volume K Unit Forecast, by Deployment 2020 & 2033
- Table 43: Global Manufacturing Analytics Industry Revenue billion Forecast, by Appllication 2020 & 2033
- Table 44: Global Manufacturing Analytics Industry Volume K Unit Forecast, by Appllication 2020 & 2033
- Table 45: Global Manufacturing Analytics Industry Revenue billion Forecast, by End-user Industry 2020 & 2033
- Table 46: Global Manufacturing Analytics Industry Volume K Unit Forecast, by End-user Industry 2020 & 2033
- Table 47: Global Manufacturing Analytics Industry Revenue billion Forecast, by Country 2020 & 2033
- Table 48: Global Manufacturing Analytics Industry Volume K Unit Forecast, by Country 2020 & 2033
Frequently Asked Questions
1. What is the projected Compound Annual Growth Rate (CAGR) of the Manufacturing Analytics Industry?
The projected CAGR is approximately 19.23%.
2. Which companies are prominent players in the Manufacturing Analytics Industry?
Key companies in the market include SAS Institute Inc, TIBCO Software Inc, IBM Corp, QlikTech Inc, DXC Technology Company, Wipro Limited, Northwest Analytics Inc, Alteryx Inc, Salesforce com Inc (Tableau Software Inc ), Oracle Corp, Sisense Inc, General Electric Company, SAP SE.
3. What are the main segments of the Manufacturing Analytics Industry?
The market segments include Deployment, Appllication, End-user Industry.
4. Can you provide details about the market size?
The market size is estimated to be USD 13.59 billion as of 2022.
5. What are some drivers contributing to market growth?
; Adoption of BI and Advanced Data Management Strategies in Manufacturing Applications; Increasing Application of Industry 4.0 Across Various Segments of Manufacturing Industries.
6. What are the notable trends driving market growth?
Automotive Sector is Expected to Grow at a Significant Rate.
7. Are there any restraints impacting market growth?
; High Initial Investment in the Transation of IIoT Across Industrial Region.
8. Can you provide examples of recent developments in the market?
N/A
9. What pricing options are available for accessing the report?
Pricing options include single-user, multi-user, and enterprise licenses priced at USD 4750, USD 5250, and USD 8750 respectively.
10. Is the market size provided in terms of value or volume?
The market size is provided in terms of value, measured in billion and volume, measured in K Unit.
11. Are there any specific market keywords associated with the report?
Yes, the market keyword associated with the report is "Manufacturing Analytics Industry," which aids in identifying and referencing the specific market segment covered.
12. How do I determine which pricing option suits my needs best?
The pricing options vary based on user requirements and access needs. Individual users may opt for single-user licenses, while businesses requiring broader access may choose multi-user or enterprise licenses for cost-effective access to the report.
13. Are there any additional resources or data provided in the Manufacturing Analytics Industry report?
While the report offers comprehensive insights, it's advisable to review the specific contents or supplementary materials provided to ascertain if additional resources or data are available.
14. How can I stay updated on further developments or reports in the Manufacturing Analytics Industry?
To stay informed about further developments, trends, and reports in the Manufacturing Analytics Industry, consider subscribing to industry newsletters, following relevant companies and organizations, or regularly checking reputable industry news sources and publications.
Methodology
Step 1 - Identification of Relevant Samples Size from Population Database


Step 2 - Approaches for Defining Global Market Size (Value, Volume* & Price*)

Note*: In applicable scenarios
Step 3 - Data Sources
Primary Research
- Web Analytics
- Survey Reports
- Research Institute
- Latest Research Reports
- Opinion Leaders
Secondary Research
- Annual Reports
- White Paper
- Latest Press Release
- Industry Association
- Paid Database
- Investor Presentations

Step 4 - Data Triangulation
Involves using different sources of information in order to increase the validity of a study
These sources are likely to be stakeholders in a program - participants, other researchers, program staff, other community members, and so on.
Then we put all data in single framework & apply various statistical tools to find out the dynamic on the market.
During the analysis stage, feedback from the stakeholder groups would be compared to determine areas of agreement as well as areas of divergence