

Key Insights
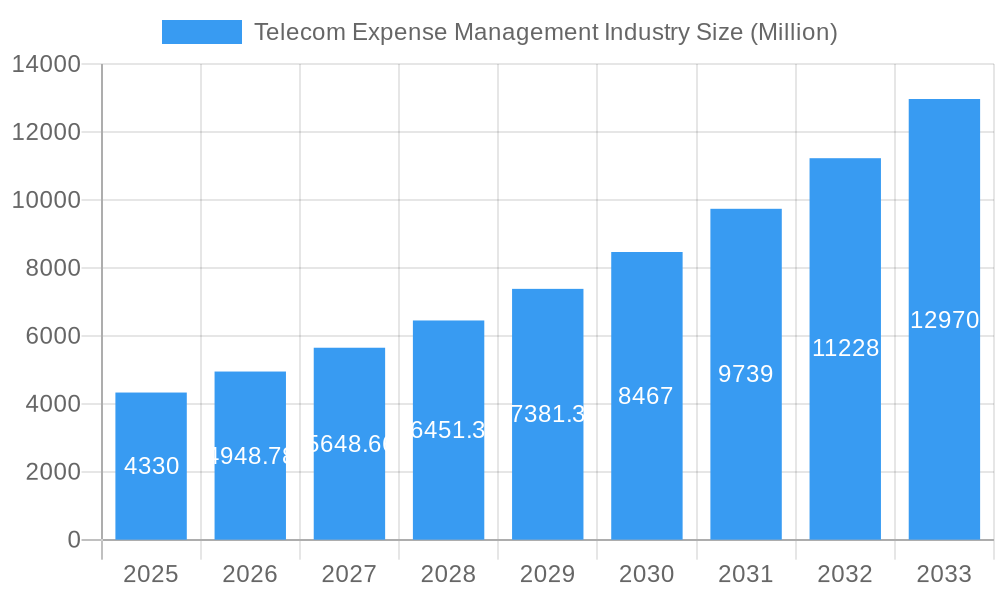
The Telecom Expense Management (TEM) industry is experiencing robust growth, projected to reach a market size of $4.33 billion in 2025, exhibiting a Compound Annual Growth Rate (CAGR) of 14.26% from 2019 to 2033. This expansion is fueled by several key drivers. The increasing complexity of telecom contracts and services necessitates efficient management solutions. Businesses across sectors, particularly BFSI (Banking, Financial Services, and Insurance), Consumer Goods & Retail, and Manufacturing, are adopting TEM solutions to optimize their telecom spending, improve visibility into their usage, and reduce operational costs. The shift towards cloud-based hosted services and managed services offers scalability and flexibility, further boosting market adoption. Growing data volumes and the increasing reliance on mobile devices and advanced communication technologies also contribute significantly to the rising demand for sophisticated TEM solutions that can handle the complexities of modern communication infrastructures. While potential restraints like the initial investment costs for TEM implementation and integration complexities exist, the long-term cost savings and enhanced efficiency are compelling businesses to adopt these solutions. Furthermore, industry trends indicate a move toward AI-powered TEM solutions to automate processes and provide more insightful analytics, thereby improving decision-making and further driving market expansion.
Telecom Expense Management Industry Market Size (In Billion)
The segmentation of the TEM market reveals a strong demand across various solution categories. Invoice management, sourcing management, and business management remain crucial components, with dispute management gaining importance due to the complexity of telecom billing. The hosted service model enjoys significant popularity due to its ease of implementation and reduced upfront investment. Regionally, North America and Europe are expected to maintain significant market share, driven by early adoption and high technological maturity. However, the Asia-Pacific region is projected to witness rapid growth, fueled by rising digitalization and a burgeoning telecom sector. The competitive landscape features a blend of established players and emerging companies, with continuous innovation driving market dynamics. This competitive landscape encourages development of innovative features and services, such as enhanced reporting capabilities, predictive analytics, and integration with other business systems. This dynamic environment ensures continuous improvement and adaptability within the TEM market, fostering further growth and evolution.
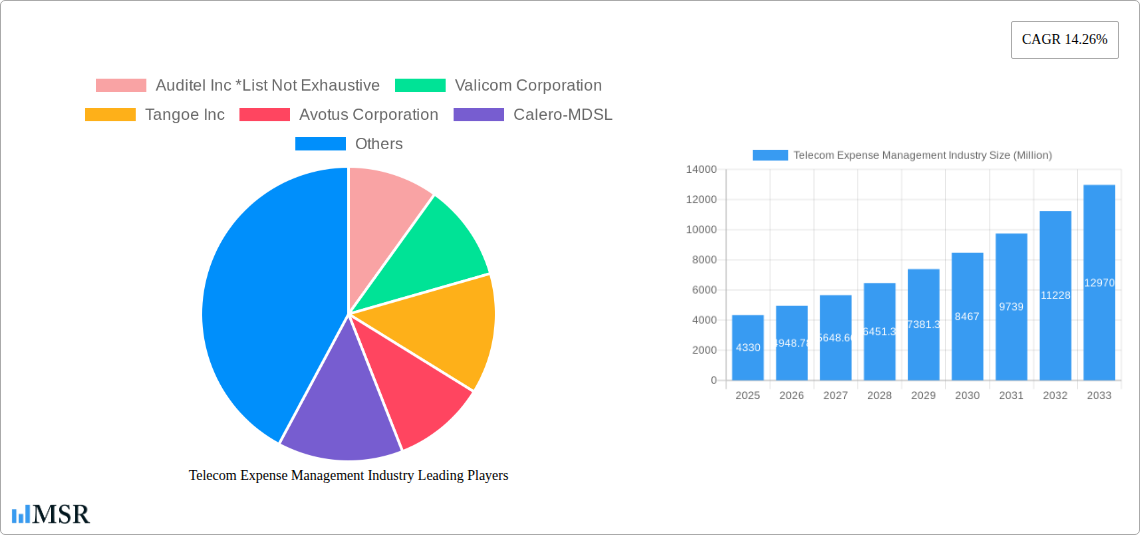
Telecom Expense Management Industry Company Market Share
Telecom Expense Management (TEM) Market Report: 2019-2033
This comprehensive report provides a detailed analysis of the Telecom Expense Management (TEM) industry, offering invaluable insights for stakeholders, investors, and industry professionals. With a study period spanning 2019-2033, a base year of 2025, and a forecast period of 2025-2033, this report unveils the market's current state and future trajectory, projecting a market size of xx Million by 2033, exhibiting a CAGR of xx%.
Telecom Expense Management Industry Market Concentration & Dynamics
The Telecom Expense Management (TEM) market exhibits a moderately concentrated landscape, with several key players holding significant market share. While precise market share figures for each company are proprietary, leading players like Auditel Inc, Valicom Corporation, Tangoe Inc, Avotus Corporation, Calero-MDSL, CGI Inc, WidePoint Solutions Corporation, Upland Software Inc (Cimpl), Sakon Inc, and TeleManagement Technologies Inc. compete fiercely. The industry is characterized by continuous innovation, driven by technological advancements and evolving customer needs. Regulatory frameworks, particularly concerning data privacy and security, significantly influence market dynamics. The presence of substitute products, such as in-house TEM solutions, adds competitive pressure. End-user trends toward cloud-based solutions and automation are shaping market demand. The market has witnessed significant M&A activity in recent years, with a total of xx M&A deals recorded between 2019 and 2024. This activity reflects the industry's consolidation and the pursuit of broader market reach and enhanced capabilities.
- Market Concentration: Moderately concentrated, with key players commanding significant but not dominant shares.
- Innovation Ecosystems: Active, driven by technological advancements in automation, AI, and cloud computing.
- Regulatory Frameworks: Impactful, particularly concerning data privacy and security compliance.
- Substitute Products: Present, including in-house TEM solutions and alternative billing platforms.
- End-User Trends: Shift towards cloud-based and automated TEM solutions is prevalent.
- M&A Activity: Significant, with xx deals recorded between 2019 and 2024, indicating industry consolidation.
Telecom Expense Management Industry Industry Insights & Trends
The global Telecom Expense Management (TEM) market is experiencing robust growth, fueled by several key factors. The increasing complexity of telecom bills, the need for improved cost optimization, and the growing adoption of cloud-based solutions are driving market expansion. Technological advancements, such as artificial intelligence (AI) and machine learning (ML), are revolutionizing TEM processes, enhancing accuracy and efficiency. Furthermore, evolving consumer behaviors, particularly the demand for transparent and cost-effective telecom services, are influencing market dynamics. The market's growth is further amplified by the expansion of the IT & Telecom sector and the increasing adoption of TEM solutions across various end-user industries. The global market size was valued at xx Million in 2024 and is projected to reach xx Million by 2033, exhibiting a CAGR of xx% during the forecast period. This growth is primarily driven by the increasing demand for efficient cost management, the adoption of advanced technologies, and the rising complexity of telecommunications expenses.
Key Markets & Segments Leading Telecom Expense Management Industry
The North American region currently holds the leading position in the global TEM market, driven by strong economic growth, advanced technological infrastructure, and a high concentration of major TEM providers. Within the market segmentation, the Invoice Management solution segment dominates due to the fundamental need for accurate and efficient invoice processing. The Hosted Service delivery model enjoys significant traction due to its scalability and cost-effectiveness. The IT & Telecom end-user industry exhibits the highest adoption rate due to the inherent complexity of their telecom expenses.
- Dominant Region: North America.
- Dominant Solution Segment: Invoice Management.
- Dominant Service Segment: Hosted Service.
- Dominant End-user Industry: IT & Telecom.
Drivers:
- Economic Growth: Strong economic growth in key regions fuels demand for TEM solutions.
- Technological Advancements: AI, ML, and automation drive efficiency and accuracy.
- Regulatory Compliance: Increasing regulatory scrutiny necessitates robust TEM solutions.
- Infrastructure Development: Expansion of telecom infrastructure fuels demand for efficient cost management.
Telecom Expense Management Industry Product Developments
Recent product innovations in the TEM market have focused on enhancing automation, integrating AI and ML capabilities, and providing more user-friendly interfaces. These advancements enhance data analysis, improve reporting capabilities, and streamline processes. The incorporation of Robotic Process Automation (RPA), as demonstrated by Tangoe’s implementation, significantly improves efficiency and reduces errors in invoice processing, highlighting a key competitive edge. Cloud-based solutions are gaining widespread adoption due to their scalability and accessibility.
Challenges in the Telecom Expense Management Industry Market
The TEM market faces several challenges, including stringent regulatory compliance requirements which increase operational costs and complexity. Supply chain disruptions can impact the availability of essential hardware and software components, affecting project timelines and overall market growth. Intense competition from both established players and emerging startups puts pressure on pricing and profitability margins, forcing companies to continuously innovate and offer superior value propositions. These challenges, if not addressed effectively, could limit market growth to approximately xx Million in a pessimistic scenario.
Forces Driving Telecom Expense Management Industry Growth
Several key factors are driving the growth of the TEM industry. The increasing complexity of telecom services and billing systems creates a strong demand for efficient management solutions. Technological advancements, such as AI and automation, are enhancing the capabilities of TEM platforms, leading to improved accuracy and cost savings. Favorable regulatory environments in certain regions are encouraging the adoption of TEM solutions, while the increasing need for cost optimization across various industries further fuels market growth.
Challenges in the Telecom Expense Management Industry Market
Long-term growth in the TEM market depends on several key factors. Continued innovation in areas such as AI and machine learning will be critical for enhancing the efficiency and capabilities of TEM platforms. Strategic partnerships between TEM providers and other technology companies can lead to the development of integrated solutions that offer greater value to customers. Expanding into new markets and serving a broader range of industries will create new opportunities for growth. These factors are expected to propel market growth towards xx Million in an optimistic scenario.
Emerging Opportunities in Telecom Expense Management Industry
The TEM market offers several emerging opportunities. The increasing adoption of 5G technology is creating a demand for sophisticated TEM solutions to manage the associated costs and complexities. The growing focus on sustainability and environmental responsibility is driving the development of TEM solutions that help organizations reduce their carbon footprint. The expansion into new markets, especially in developing economies, offers significant growth potential. Finally, the increasing demand for real-time data analytics and predictive modeling creates opportunities for TEM providers to offer value-added services.
Leading Players in the Telecom Expense Management Industry Sector
- Auditel Inc
- Valicom Corporation
- Tangoe Inc
- Avotus Corporation
- Calero-MDSL
- CGI Inc
- WidePoint Solutions Corporation
- Upland Software Inc (Cimpl)
- Sakon Inc
- TeleManagement Technologies Inc
Key Milestones in Telecom Expense Management Industry Industry
- September 2023: Prodapt partners with ServiceNow to expand its TMT business, driving digital workflows and enhancing customer experiences for CSPs.
- November 2022: Renodis acquires 12 Points Consulting, strengthening its telecom and utility management services.
- September 2022: Tangoe integrates robotic process automation, improving data processing and strengthening its competitive advantage.
Strategic Outlook for Telecom Expense Management Industry Market
The future of the TEM market looks promising, with significant growth potential driven by technological advancements, increasing demand for cost optimization, and expansion into new markets. Strategic partnerships, focused innovation, and the adoption of cutting-edge technologies like AI and ML will be crucial for success. The market is poised for continued consolidation, with larger players acquiring smaller companies to expand their market share and service offerings. The overall outlook suggests substantial growth opportunities for companies that can adapt to the changing landscape and effectively address the evolving needs of their customers.
Telecom Expense Management Industry Segmentation
-
1. Solution
- 1.1. Invoice Management
- 1.2. Sourcing Management
- 1.3. Business Management
- 1.4. Dispute Management
- 1.5. Other Solutions
-
2. Service
- 2.1. Hosted Service
- 2.2. Managed Service
-
3. End-user Industry
- 3.1. BFSI
- 3.2. Consumer Goods & Retail
- 3.3. Manufacturing
- 3.4. IT & Telecom
- 3.5. Healthcare
- 3.6. Other End-user Industries
Telecom Expense Management Industry Segmentation By Geography
- 1. North America
- 2. Europe
- 3. Asia Pacific
- 4. Latin America
- 5. Middle East
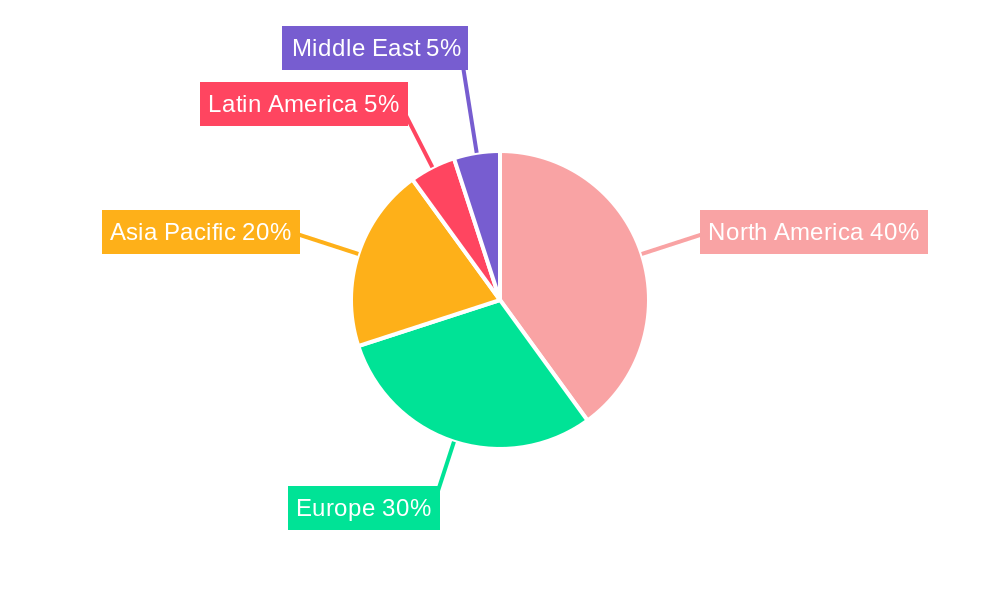
Telecom Expense Management Industry Regional Market Share
Geographic Coverage of Telecom Expense Management Industry
Telecom Expense Management Industry REPORT HIGHLIGHTS
| Aspects | Details |
|---|---|
| Study Period | 2020-2034 |
| Base Year | 2025 |
| Estimated Year | 2026 |
| Forecast Period | 2026-2034 |
| Historical Period | 2020-2025 |
| Growth Rate | CAGR of 14.26% from 2020-2034 |
| Segmentation |
|
Table of Contents
- 1. Introduction
- 1.1. Research Scope
- 1.2. Market Segmentation
- 1.3. Research Objective
- 1.4. Definitions and Assumptions
- 2. Executive Summary
- 2.1. Market Snapshot
- 3. Market Dynamics
- 3.1. Market Drivers
- 3.2. Market Restrains
- 3.3. Market Trends
- 3.4. Market Opportunities
- 4. Market Factor Analysis
- 4.1. Porters Five Forces
- 4.1.1. Bargaining Power of Suppliers
- 4.1.2. Bargaining Power of Buyers
- 4.1.3. Threat of New Entrants
- 4.1.4. Threat of Substitutes
- 4.1.5. Competitive Rivalry
- 4.2. PESTEL analysis
- 4.3. BCG Analysis
- 4.3.1. Stars (High Growth, High Market Share)
- 4.3.2. Cash Cows (Low Growth, High Market Share)
- 4.3.3. Question Mark (High Growth, Low Market Share)
- 4.3.4. Dogs (Low Growth, Low Market Share)
- 4.4. Ansoff Matrix Analysis
- 4.5. Supply Chain Analysis
- 4.6. Regulatory Landscape
- 4.7. Current Market Potential and Opportunity Assessment (TAM–SAM–SOM Framework)
- 4.8. MSR Analyst Note
- 4.1. Porters Five Forces
- 5. Market Analysis, Insights and Forecast 2021-2033
- 5.1. Market Analysis, Insights and Forecast - by Solution
- 5.1.1. Invoice Management
- 5.1.2. Sourcing Management
- 5.1.3. Business Management
- 5.1.4. Dispute Management
- 5.1.5. Other Solutions
- 5.2. Market Analysis, Insights and Forecast - by Service
- 5.2.1. Hosted Service
- 5.2.2. Managed Service
- 5.3. Market Analysis, Insights and Forecast - by End-user Industry
- 5.3.1. BFSI
- 5.3.2. Consumer Goods & Retail
- 5.3.3. Manufacturing
- 5.3.4. IT & Telecom
- 5.3.5. Healthcare
- 5.3.6. Other End-user Industries
- 5.4. Market Analysis, Insights and Forecast - by Region
- 5.4.1. North America
- 5.4.2. Europe
- 5.4.3. Asia Pacific
- 5.4.4. Latin America
- 5.4.5. Middle East
- 5.1. Market Analysis, Insights and Forecast - by Solution
- 6. Global Telecom Expense Management Industry Analysis, Insights and Forecast, 2021-2033
- 6.1. Market Analysis, Insights and Forecast - by Solution
- 6.1.1. Invoice Management
- 6.1.2. Sourcing Management
- 6.1.3. Business Management
- 6.1.4. Dispute Management
- 6.1.5. Other Solutions
- 6.2. Market Analysis, Insights and Forecast - by Service
- 6.2.1. Hosted Service
- 6.2.2. Managed Service
- 6.3. Market Analysis, Insights and Forecast - by End-user Industry
- 6.3.1. BFSI
- 6.3.2. Consumer Goods & Retail
- 6.3.3. Manufacturing
- 6.3.4. IT & Telecom
- 6.3.5. Healthcare
- 6.3.6. Other End-user Industries
- 6.1. Market Analysis, Insights and Forecast - by Solution
- 7. North America Telecom Expense Management Industry Analysis, Insights and Forecast, 2020-2032
- 7.1. Market Analysis, Insights and Forecast - by Solution
- 7.1.1. Invoice Management
- 7.1.2. Sourcing Management
- 7.1.3. Business Management
- 7.1.4. Dispute Management
- 7.1.5. Other Solutions
- 7.2. Market Analysis, Insights and Forecast - by Service
- 7.2.1. Hosted Service
- 7.2.2. Managed Service
- 7.3. Market Analysis, Insights and Forecast - by End-user Industry
- 7.3.1. BFSI
- 7.3.2. Consumer Goods & Retail
- 7.3.3. Manufacturing
- 7.3.4. IT & Telecom
- 7.3.5. Healthcare
- 7.3.6. Other End-user Industries
- 7.1. Market Analysis, Insights and Forecast - by Solution
- 8. Europe Telecom Expense Management Industry Analysis, Insights and Forecast, 2020-2032
- 8.1. Market Analysis, Insights and Forecast - by Solution
- 8.1.1. Invoice Management
- 8.1.2. Sourcing Management
- 8.1.3. Business Management
- 8.1.4. Dispute Management
- 8.1.5. Other Solutions
- 8.2. Market Analysis, Insights and Forecast - by Service
- 8.2.1. Hosted Service
- 8.2.2. Managed Service
- 8.3. Market Analysis, Insights and Forecast - by End-user Industry
- 8.3.1. BFSI
- 8.3.2. Consumer Goods & Retail
- 8.3.3. Manufacturing
- 8.3.4. IT & Telecom
- 8.3.5. Healthcare
- 8.3.6. Other End-user Industries
- 8.1. Market Analysis, Insights and Forecast - by Solution
- 9. Asia Pacific Telecom Expense Management Industry Analysis, Insights and Forecast, 2020-2032
- 9.1. Market Analysis, Insights and Forecast - by Solution
- 9.1.1. Invoice Management
- 9.1.2. Sourcing Management
- 9.1.3. Business Management
- 9.1.4. Dispute Management
- 9.1.5. Other Solutions
- 9.2. Market Analysis, Insights and Forecast - by Service
- 9.2.1. Hosted Service
- 9.2.2. Managed Service
- 9.3. Market Analysis, Insights and Forecast - by End-user Industry
- 9.3.1. BFSI
- 9.3.2. Consumer Goods & Retail
- 9.3.3. Manufacturing
- 9.3.4. IT & Telecom
- 9.3.5. Healthcare
- 9.3.6. Other End-user Industries
- 9.1. Market Analysis, Insights and Forecast - by Solution
- 10. Latin America Telecom Expense Management Industry Analysis, Insights and Forecast, 2020-2032
- 10.1. Market Analysis, Insights and Forecast - by Solution
- 10.1.1. Invoice Management
- 10.1.2. Sourcing Management
- 10.1.3. Business Management
- 10.1.4. Dispute Management
- 10.1.5. Other Solutions
- 10.2. Market Analysis, Insights and Forecast - by Service
- 10.2.1. Hosted Service
- 10.2.2. Managed Service
- 10.3. Market Analysis, Insights and Forecast - by End-user Industry
- 10.3.1. BFSI
- 10.3.2. Consumer Goods & Retail
- 10.3.3. Manufacturing
- 10.3.4. IT & Telecom
- 10.3.5. Healthcare
- 10.3.6. Other End-user Industries
- 10.1. Market Analysis, Insights and Forecast - by Solution
- 11. Middle East Telecom Expense Management Industry Analysis, Insights and Forecast, 2020-2032
- 11.1. Market Analysis, Insights and Forecast - by Solution
- 11.1.1. Invoice Management
- 11.1.2. Sourcing Management
- 11.1.3. Business Management
- 11.1.4. Dispute Management
- 11.1.5. Other Solutions
- 11.2. Market Analysis, Insights and Forecast - by Service
- 11.2.1. Hosted Service
- 11.2.2. Managed Service
- 11.3. Market Analysis, Insights and Forecast - by End-user Industry
- 11.3.1. BFSI
- 11.3.2. Consumer Goods & Retail
- 11.3.3. Manufacturing
- 11.3.4. IT & Telecom
- 11.3.5. Healthcare
- 11.3.6. Other End-user Industries
- 11.1. Market Analysis, Insights and Forecast - by Solution
- 12. Competitive Analysis
- 12.1. Company Profiles
- 12.1.1 Auditel Inc *List Not Exhaustive
- 12.1.1.1. Company Overview
- 12.1.1.2. Products
- 12.1.1.3. Company Financials
- 12.1.1.4. SWOT Analysis
- 12.1.2 Valicom Corporation
- 12.1.2.1. Company Overview
- 12.1.2.2. Products
- 12.1.2.3. Company Financials
- 12.1.2.4. SWOT Analysis
- 12.1.3 Tangoe Inc
- 12.1.3.1. Company Overview
- 12.1.3.2. Products
- 12.1.3.3. Company Financials
- 12.1.3.4. SWOT Analysis
- 12.1.4 Avotus Corporation
- 12.1.4.1. Company Overview
- 12.1.4.2. Products
- 12.1.4.3. Company Financials
- 12.1.4.4. SWOT Analysis
- 12.1.5 Calero-MDSL
- 12.1.5.1. Company Overview
- 12.1.5.2. Products
- 12.1.5.3. Company Financials
- 12.1.5.4. SWOT Analysis
- 12.1.6 CGI Inc
- 12.1.6.1. Company Overview
- 12.1.6.2. Products
- 12.1.6.3. Company Financials
- 12.1.6.4. SWOT Analysis
- 12.1.7 WidePoint Solutions Corporation
- 12.1.7.1. Company Overview
- 12.1.7.2. Products
- 12.1.7.3. Company Financials
- 12.1.7.4. SWOT Analysis
- 12.1.8 Upland Software Inc (Cimpl)
- 12.1.8.1. Company Overview
- 12.1.8.2. Products
- 12.1.8.3. Company Financials
- 12.1.8.4. SWOT Analysis
- 12.1.9 Sakon Inc
- 12.1.9.1. Company Overview
- 12.1.9.2. Products
- 12.1.9.3. Company Financials
- 12.1.9.4. SWOT Analysis
- 12.1.10 TeleManagement Technologies Inc
- 12.1.10.1. Company Overview
- 12.1.10.2. Products
- 12.1.10.3. Company Financials
- 12.1.10.4. SWOT Analysis
- 12.1.1 Auditel Inc *List Not Exhaustive
- 12.2. Market Entropy
- 12.2.1 Company's Key Areas Served
- 12.2.2 Recent Developments
- 12.3. Company Market Share Analysis 2025
- 12.3.1 Top 5 Companies Market Share Analysis
- 12.3.2 Top 3 Companies Market Share Analysis
- 12.4. List of Potential Customers
- 13. Research Methodology
List of Figures
- Figure 1: Global Telecom Expense Management Industry Revenue Breakdown (Million, %) by Region 2025 & 2033
- Figure 2: North America Telecom Expense Management Industry Revenue (Million), by Solution 2025 & 2033
- Figure 3: North America Telecom Expense Management Industry Revenue Share (%), by Solution 2025 & 2033
- Figure 4: North America Telecom Expense Management Industry Revenue (Million), by Service 2025 & 2033
- Figure 5: North America Telecom Expense Management Industry Revenue Share (%), by Service 2025 & 2033
- Figure 6: North America Telecom Expense Management Industry Revenue (Million), by End-user Industry 2025 & 2033
- Figure 7: North America Telecom Expense Management Industry Revenue Share (%), by End-user Industry 2025 & 2033
- Figure 8: North America Telecom Expense Management Industry Revenue (Million), by Country 2025 & 2033
- Figure 9: North America Telecom Expense Management Industry Revenue Share (%), by Country 2025 & 2033
- Figure 10: Europe Telecom Expense Management Industry Revenue (Million), by Solution 2025 & 2033
- Figure 11: Europe Telecom Expense Management Industry Revenue Share (%), by Solution 2025 & 2033
- Figure 12: Europe Telecom Expense Management Industry Revenue (Million), by Service 2025 & 2033
- Figure 13: Europe Telecom Expense Management Industry Revenue Share (%), by Service 2025 & 2033
- Figure 14: Europe Telecom Expense Management Industry Revenue (Million), by End-user Industry 2025 & 2033
- Figure 15: Europe Telecom Expense Management Industry Revenue Share (%), by End-user Industry 2025 & 2033
- Figure 16: Europe Telecom Expense Management Industry Revenue (Million), by Country 2025 & 2033
- Figure 17: Europe Telecom Expense Management Industry Revenue Share (%), by Country 2025 & 2033
- Figure 18: Asia Pacific Telecom Expense Management Industry Revenue (Million), by Solution 2025 & 2033
- Figure 19: Asia Pacific Telecom Expense Management Industry Revenue Share (%), by Solution 2025 & 2033
- Figure 20: Asia Pacific Telecom Expense Management Industry Revenue (Million), by Service 2025 & 2033
- Figure 21: Asia Pacific Telecom Expense Management Industry Revenue Share (%), by Service 2025 & 2033
- Figure 22: Asia Pacific Telecom Expense Management Industry Revenue (Million), by End-user Industry 2025 & 2033
- Figure 23: Asia Pacific Telecom Expense Management Industry Revenue Share (%), by End-user Industry 2025 & 2033
- Figure 24: Asia Pacific Telecom Expense Management Industry Revenue (Million), by Country 2025 & 2033
- Figure 25: Asia Pacific Telecom Expense Management Industry Revenue Share (%), by Country 2025 & 2033
- Figure 26: Latin America Telecom Expense Management Industry Revenue (Million), by Solution 2025 & 2033
- Figure 27: Latin America Telecom Expense Management Industry Revenue Share (%), by Solution 2025 & 2033
- Figure 28: Latin America Telecom Expense Management Industry Revenue (Million), by Service 2025 & 2033
- Figure 29: Latin America Telecom Expense Management Industry Revenue Share (%), by Service 2025 & 2033
- Figure 30: Latin America Telecom Expense Management Industry Revenue (Million), by End-user Industry 2025 & 2033
- Figure 31: Latin America Telecom Expense Management Industry Revenue Share (%), by End-user Industry 2025 & 2033
- Figure 32: Latin America Telecom Expense Management Industry Revenue (Million), by Country 2025 & 2033
- Figure 33: Latin America Telecom Expense Management Industry Revenue Share (%), by Country 2025 & 2033
- Figure 34: Middle East Telecom Expense Management Industry Revenue (Million), by Solution 2025 & 2033
- Figure 35: Middle East Telecom Expense Management Industry Revenue Share (%), by Solution 2025 & 2033
- Figure 36: Middle East Telecom Expense Management Industry Revenue (Million), by Service 2025 & 2033
- Figure 37: Middle East Telecom Expense Management Industry Revenue Share (%), by Service 2025 & 2033
- Figure 38: Middle East Telecom Expense Management Industry Revenue (Million), by End-user Industry 2025 & 2033
- Figure 39: Middle East Telecom Expense Management Industry Revenue Share (%), by End-user Industry 2025 & 2033
- Figure 40: Middle East Telecom Expense Management Industry Revenue (Million), by Country 2025 & 2033
- Figure 41: Middle East Telecom Expense Management Industry Revenue Share (%), by Country 2025 & 2033
List of Tables
- Table 1: Global Telecom Expense Management Industry Revenue Million Forecast, by Solution 2020 & 2033
- Table 2: Global Telecom Expense Management Industry Revenue Million Forecast, by Service 2020 & 2033
- Table 3: Global Telecom Expense Management Industry Revenue Million Forecast, by End-user Industry 2020 & 2033
- Table 4: Global Telecom Expense Management Industry Revenue Million Forecast, by Region 2020 & 2033
- Table 5: Global Telecom Expense Management Industry Revenue Million Forecast, by Solution 2020 & 2033
- Table 6: Global Telecom Expense Management Industry Revenue Million Forecast, by Service 2020 & 2033
- Table 7: Global Telecom Expense Management Industry Revenue Million Forecast, by End-user Industry 2020 & 2033
- Table 8: Global Telecom Expense Management Industry Revenue Million Forecast, by Country 2020 & 2033
- Table 9: Global Telecom Expense Management Industry Revenue Million Forecast, by Solution 2020 & 2033
- Table 10: Global Telecom Expense Management Industry Revenue Million Forecast, by Service 2020 & 2033
- Table 11: Global Telecom Expense Management Industry Revenue Million Forecast, by End-user Industry 2020 & 2033
- Table 12: Global Telecom Expense Management Industry Revenue Million Forecast, by Country 2020 & 2033
- Table 13: Global Telecom Expense Management Industry Revenue Million Forecast, by Solution 2020 & 2033
- Table 14: Global Telecom Expense Management Industry Revenue Million Forecast, by Service 2020 & 2033
- Table 15: Global Telecom Expense Management Industry Revenue Million Forecast, by End-user Industry 2020 & 2033
- Table 16: Global Telecom Expense Management Industry Revenue Million Forecast, by Country 2020 & 2033
- Table 17: Global Telecom Expense Management Industry Revenue Million Forecast, by Solution 2020 & 2033
- Table 18: Global Telecom Expense Management Industry Revenue Million Forecast, by Service 2020 & 2033
- Table 19: Global Telecom Expense Management Industry Revenue Million Forecast, by End-user Industry 2020 & 2033
- Table 20: Global Telecom Expense Management Industry Revenue Million Forecast, by Country 2020 & 2033
- Table 21: Global Telecom Expense Management Industry Revenue Million Forecast, by Solution 2020 & 2033
- Table 22: Global Telecom Expense Management Industry Revenue Million Forecast, by Service 2020 & 2033
- Table 23: Global Telecom Expense Management Industry Revenue Million Forecast, by End-user Industry 2020 & 2033
- Table 24: Global Telecom Expense Management Industry Revenue Million Forecast, by Country 2020 & 2033
Frequently Asked Questions
1. What is the projected Compound Annual Growth Rate (CAGR) of the Telecom Expense Management Industry?
The projected CAGR is approximately 14.26%.
2. Which companies are prominent players in the Telecom Expense Management Industry?
Key companies in the market include Auditel Inc *List Not Exhaustive, Valicom Corporation, Tangoe Inc, Avotus Corporation, Calero-MDSL, CGI Inc, WidePoint Solutions Corporation, Upland Software Inc (Cimpl), Sakon Inc, TeleManagement Technologies Inc.
3. What are the main segments of the Telecom Expense Management Industry?
The market segments include Solution, Service, End-user Industry.
4. Can you provide details about the market size?
The market size is estimated to be USD 4.33 Million as of 2022.
5. What are some drivers contributing to market growth?
Increasing Adoption of Mobile Phones and Other Portable Devices; Significant Cost Reduction and Expense Visibility.
6. What are the notable trends driving market growth?
BFSI Segment is Expected to Gain Significant Traction.
7. Are there any restraints impacting market growth?
Lack of Interoperability Due to Set Industry Standards.
8. Can you provide examples of recent developments in the market?
September 2023: Prodapt, one of the largest and fastest-growing specialized firms in the Connectedness industry, partnered to enable ServiceNow to expand its telecom, media, and tech (TMT) business to assist Communication Service Providers (CSPs). The expanded scope would drive digital workflows for greater operational agility, enhanced productivity, and intuitive customer experiences.
9. What pricing options are available for accessing the report?
Pricing options include single-user, multi-user, and enterprise licenses priced at USD 4750, USD 5250, and USD 8750 respectively.
10. Is the market size provided in terms of value or volume?
The market size is provided in terms of value, measured in Million.
11. Are there any specific market keywords associated with the report?
Yes, the market keyword associated with the report is "Telecom Expense Management Industry," which aids in identifying and referencing the specific market segment covered.
12. How do I determine which pricing option suits my needs best?
The pricing options vary based on user requirements and access needs. Individual users may opt for single-user licenses, while businesses requiring broader access may choose multi-user or enterprise licenses for cost-effective access to the report.
13. Are there any additional resources or data provided in the Telecom Expense Management Industry report?
While the report offers comprehensive insights, it's advisable to review the specific contents or supplementary materials provided to ascertain if additional resources or data are available.
14. How can I stay updated on further developments or reports in the Telecom Expense Management Industry?
To stay informed about further developments, trends, and reports in the Telecom Expense Management Industry, consider subscribing to industry newsletters, following relevant companies and organizations, or regularly checking reputable industry news sources and publications.
Methodology
Step 1 - Identification of Relevant Samples Size from Population Database


Step 2 - Approaches for Defining Global Market Size (Value, Volume* & Price*)

Note*: In applicable scenarios
Step 3 - Data Sources
Primary Research
- Web Analytics
- Survey Reports
- Research Institute
- Latest Research Reports
- Opinion Leaders
Secondary Research
- Annual Reports
- White Paper
- Latest Press Release
- Industry Association
- Paid Database
- Investor Presentations

Step 4 - Data Triangulation
Involves using different sources of information in order to increase the validity of a study
These sources are likely to be stakeholders in a program - participants, other researchers, program staff, other community members, and so on.
Then we put all data in single framework & apply various statistical tools to find out the dynamic on the market.
During the analysis stage, feedback from the stakeholder groups would be compared to determine areas of agreement as well as areas of divergence