

Key Insights
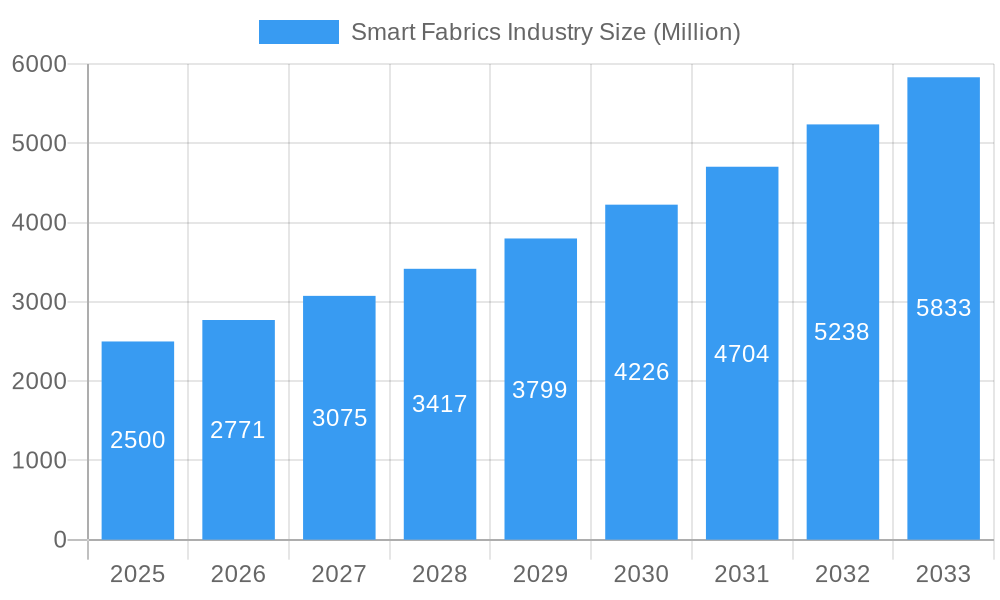
The global smart fabrics market is projected for substantial growth, expected to reach a market size of 39.51 billion by 2025, expanding at a Compound Annual Growth Rate (CAGR) of 28.4% from 2025 to 2033. This surge is driven by escalating demand for advanced textiles with functionalities beyond traditional applications. Key growth enablers include innovations in conductive yarns, sensor integration, and textile-based energy harvesting. The fashion, sports, and fitness sectors are leading adoption, capitalizing on consumer interest in performance-enhancing and interactive apparel. Significant contributions also stem from the medical industry's increasing use of smart fabrics for remote monitoring, diagnostics, and advanced wound care.
Smart Fabrics Industry Market Size (In Billion)
Technological advancements are diversifying the smart fabrics market. While passive smart fabrics currently dominate, active and ultra-smart fabrics are experiencing accelerated growth. These advanced categories incorporate microelectronics and AI for complex data processing and responsiveness. Market challenges include high production costs, scalability issues, and the need for standardization in interoperability and data security. However, ongoing R&D, strategic partnerships, and increased investment are addressing these restraints. The Asia Pacific region is anticipated to lead market growth due to its strong manufacturing capabilities and high adoption of wearable technology.
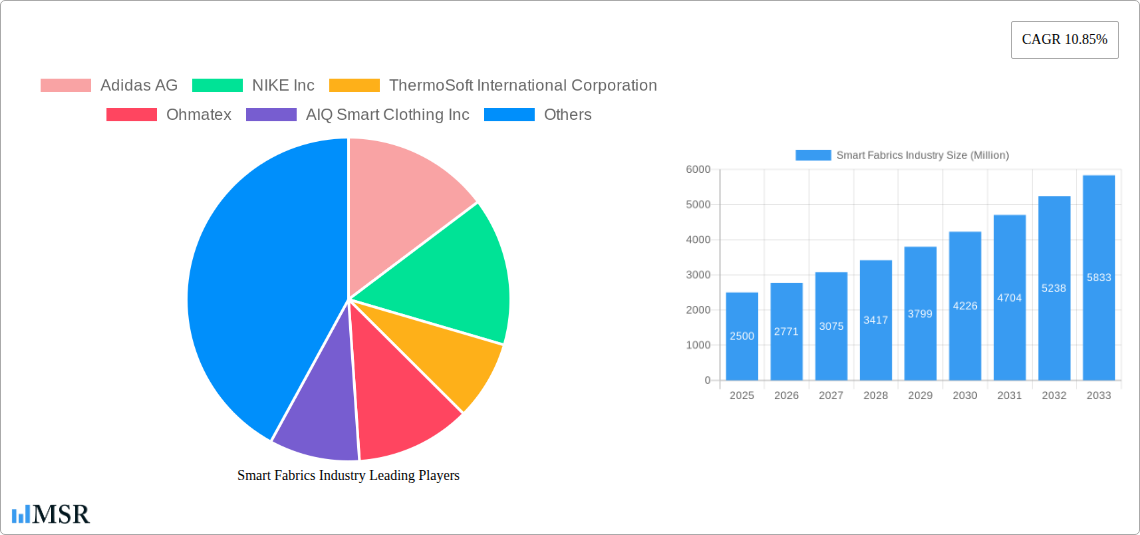
Smart Fabrics Industry Company Market Share
Gain comprehensive insights into the smart fabrics industry with our detailed market analysis. This report covers the base year 2025 and a forecast period extending to 2033, providing critical data on wearable technology, e-textiles, and connected clothing. Understand market dynamics, key players, and transformative innovations defining the future of textiles.
Smart Fabrics Industry Market Concentration & Dynamics
The global Smart Fabrics Industry exhibits a moderate to high concentration, driven by significant R&D investments and a growing demand for innovative textiles across diverse applications. Leading companies are actively engaged in strategic partnerships and acquisitions to bolster their technological capabilities and market reach. The innovation ecosystem is vibrant, with universities and research institutions playing a crucial role in developing next-generation smart textiles. Regulatory frameworks are still evolving, but focus on safety and data privacy is increasing. Substitute products, such as traditional performance wear, remain a challenge, but the unique functionalities of smart fabrics are creating distinct market segments. End-user trends lean towards enhanced comfort, personalized health monitoring, and integrated digital experiences. M&A activity is expected to increase as larger players seek to integrate advanced textile technology into their portfolios. Key metrics indicate a growing number of patent filings related to electronic textiles and conductive fabrics.
- Market Concentration: Moderate to High
- Innovation Ecosystem: Vibrant, driven by R&D and academic collaborations.
- Regulatory Frameworks: Evolving, with focus on safety and data.
- Substitute Products: Traditional performance wear remains competitive.
- End-User Trends: Demand for comfort, health monitoring, and digital integration.
- M&A Activities: Expected to increase with strategic integrations.
Smart Fabrics Industry Industry Insights & Trends
The Smart Fabrics Industry is poised for substantial growth, projected to reach billions of dollars in market size by 2033, with a compelling Compound Annual Growth Rate (CAGR). This expansion is fueled by a confluence of factors, including escalating consumer demand for interactive clothing, advancements in sensor technology, and the increasing integration of IoT devices into everyday wear. The medical wearables market is a significant growth driver, with smart fabrics enabling continuous health monitoring, remote patient care, and early disease detection. In sports and fitness, these textiles offer performance enhancement, real-time biomechanical feedback, and personalized training insights. The fashion and entertainment sector is embracing smart fabrics for their aesthetic appeal and unique interactive features, creating novel consumer experiences. Technological disruptions are continuously emerging, from the development of self-healing fabrics to the integration of energy harvesting capabilities, reducing reliance on external power sources. Evolving consumer behaviors reflect a growing preference for personalized solutions and a desire for seamless integration of technology into their lifestyles. The increasing accessibility and affordability of conductive yarns and flexible electronics further democratize the development and adoption of smart textiles. This dynamic market is also witnessing innovations in washable smart textiles, a critical factor for consumer adoption in everyday apparel.
Key Markets & Segments Leading Smart Fabrics Industry
The Smart Fabrics Industry is witnessing robust growth across various geographical regions, with North America and Europe currently leading in adoption due to high disposable incomes and a strong emphasis on technological innovation. However, the Asia-Pacific region is emerging as a significant growth engine, driven by its vast manufacturing capabilities, increasing R&D investments in advanced textiles, and a rapidly growing consumer base adopting wearable technology.
Within the Type segmentation, Active Fabrics are currently dominating the market. These fabrics possess integrated functionalities such as sensing, actuation, and communication, enabling direct interaction and response. This dominance is propelled by their widespread application in sports performance monitoring, medical diagnostics, and military operations where real-time data and feedback are crucial. Passive Smart Fabrics, which incorporate components for sensing or energy harvesting without active electronic elements, are also gaining traction, particularly in fashion and general consumer goods due to their cost-effectiveness and ease of integration. Ultra-smart Fabrics, representing the cutting edge with complex integrated functionalities like artificial intelligence and advanced self-regulation, represent a smaller but rapidly growing segment with immense future potential.
In terms of Application, the Sports and Fitness segment leads the market. The demand for advanced performance monitoring, injury prevention, and enhanced athletic capabilities has made smart fabrics indispensable for athletes and fitness enthusiasts alike. The Medical segment follows closely, driven by the need for remote patient monitoring, chronic disease management, and personalized healthcare solutions. Fashion and Entertainment is another rapidly expanding area, with designers and brands integrating smart textiles for unique aesthetic and interactive experiences. The Space and Military segment showcases the ruggedness and critical functionalities of smart fabrics for demanding environments, including advanced communication and protection. Industrial applications are also growing, with smart fabrics being utilized for safety monitoring, asset tracking, and smart manufacturing processes.
- Dominant Region: North America and Europe, with Asia-Pacific as a fast-growing market.
- Leading Segment by Type: Active Fabrics, driven by advanced functionalities.
- Leading Segment by Application: Sports and Fitness, followed by Medical.
- Drivers for Sports & Fitness Dominance: Performance enhancement, injury prevention, real-time feedback.
- Drivers for Medical Segment Growth: Remote patient monitoring, chronic disease management, personalized healthcare.
Smart Fabrics Industry Product Developments
The Smart Fabrics Industry is characterized by continuous product innovation, with a focus on integrating advanced functionalities into textiles. Recent developments include fabrics with embedded LEDs for enhanced visibility and aesthetic appeal, energy harvesting capabilities to power integrated electronics, and sophisticated sensors for comprehensive data collection. These advancements are expanding the market relevance of smart textiles across sectors like fashion tech, healthcare textiles, and performance apparel. Companies are achieving competitive edges by developing washable smart fabrics and achieving greater integration of electronics without compromising comfort or aesthetics, paving the way for wider consumer adoption.
Challenges in the Smart Fabrics Industry Market
Despite its promising growth trajectory, the Smart Fabrics Industry faces several significant challenges. Manufacturing scalability and cost-effectiveness remain primary hurdles, particularly for complex e-textiles. Ensuring the durability and washability of integrated electronic components is critical for consumer acceptance. Regulatory compliance and data privacy concerns surrounding the collection and use of personal biometric data require careful navigation. Supply chain complexities for specialized electronic components and conductive materials can also lead to delays and increased costs.
Forces Driving Smart Fabrics Industry Growth
The growth of the Smart Fabrics Industry is primarily driven by several key forces. Technological advancements in materials science, sensor technology, and miniaturization of electronics are continuously pushing the boundaries of what’s possible. Increasing consumer demand for personalized experiences, health monitoring, and integrated technology in everyday products is a significant catalyst. Growing investments in research and development by both established players and startups are fostering innovation. Furthermore, the expanding applications across sectors like healthcare, sports, and military are opening up new market opportunities.
Challenges in the Smart Fabrics Industry Market
Long-term growth catalysts for the Smart Fabrics Industry lie in fostering greater integration and seamless user experiences. Continued innovation in power management, including more efficient energy harvesting and storage solutions, will be crucial. Strategic partnerships between textile manufacturers, electronics companies, and software developers are essential for creating holistic smart textile ecosystems. Market expansions into emerging economies and the development of mass-market affordable smart textiles will unlock significant growth potential.
Emerging Opportunities in Smart Fabrics Industry
Emerging opportunities in the Smart Fabrics Industry are abundant. The growing trend of personalized medicine presents a significant opening for smart fabrics in diagnostic and therapeutic applications. The demand for sustainable and eco-friendly smart textiles is creating a niche for environmentally conscious innovations. Advancements in AI-powered textiles that can learn and adapt to user needs offer groundbreaking possibilities. Furthermore, the integration of smart fabrics into the Internet of Things (IoT) ecosystem for seamless connectivity and data exchange represents a vast untapped market.
Leading Players in the Smart Fabrics Industry Sector
- Adidas AG
- NIKE Inc
- ThermoSoft International Corporation
- Ohmatex
- AIQ Smart Clothing Inc
- OTEX Specialty Narrow Fabrics Inc
- Sensoria Inc
- Schoeller Textil AG
- Interactive Wear AG
- Kolon Industries Inc
Key Milestones in Smart Fabrics Industry Industry
- April 2023: A team at Cambridge University developed a fabric incorporating LEDs, energy harvesting, storage, and sensors, demonstrating an inexpensive production method compatible with existing textile manufacturing technology.
- March 2023: Schoeller Textil AG launched its Re-Source sustainable textile collection, offering breathability, thermal regulation, and wind/water resistance, made from bio-based, post- and pre-consumer materials.
- April 2022: At the Smart Textiles Summit, Advanced Functional Fabrics of America (AFFOA) showcased advanced functional fiber preforms and fibers with LED chips, highlighting their role at the forefront of high-tech textile systems.
Strategic Outlook for Smart Fabrics Industry Market
The strategic outlook for the Smart Fabrics Industry Market is exceptionally positive, driven by an increasing convergence of fashion, technology, and health. Future market potential is immense as smart textiles move beyond niche applications into mainstream consumer products. Strategic opportunities lie in developing more integrated and user-friendly solutions, fostering stronger collaborative ecosystems, and tapping into emerging markets. The industry is expected to witness significant growth fueled by continuous innovation in materials, functionalities, and applications, promising a future where clothing is not just worn, but is an intelligent extension of our digital lives.
Smart Fabrics Industry Segmentation
-
1. Type
- 1.1. Passive Smart Fabrics
- 1.2. Active Fabrics
- 1.3. Ultra-smart Fabrics
-
2. Application
- 2.1. Fashion and Entertainment
- 2.2. Sports and Fitness
- 2.3. Medical
- 2.4. Transportation and Others
- 2.5. Space and Military
- 2.6. Industrial
Smart Fabrics Industry Segmentation By Geography
- 1. North America
- 2. Asia Pacific
- 3. Europe
- 4. Rest of the World
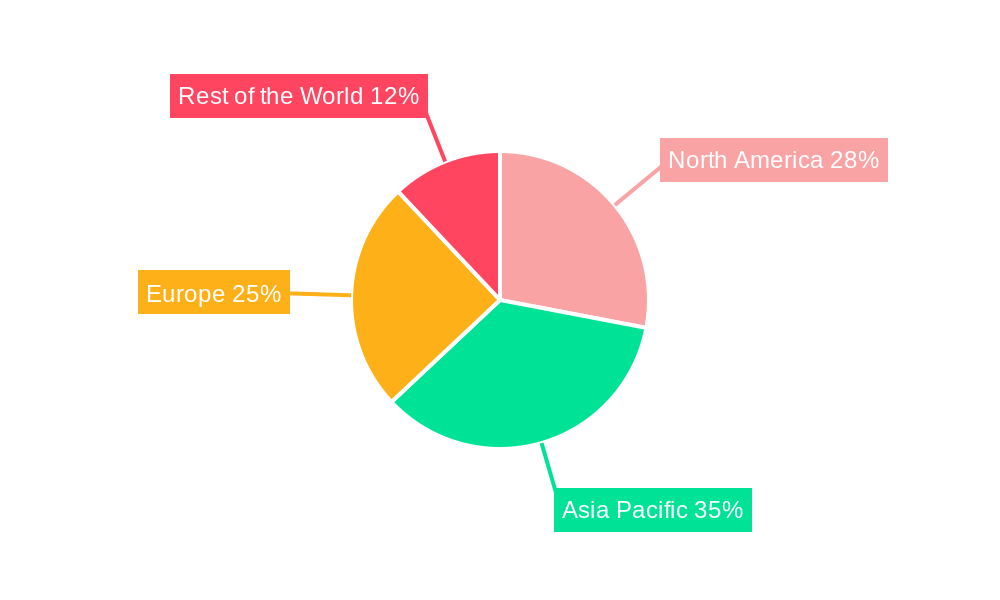
Smart Fabrics Industry Regional Market Share
Geographic Coverage of Smart Fabrics Industry
Smart Fabrics Industry REPORT HIGHLIGHTS
| Aspects | Details |
|---|---|
| Study Period | 2020-2034 |
| Base Year | 2025 |
| Estimated Year | 2026 |
| Forecast Period | 2026-2034 |
| Historical Period | 2020-2025 |
| Growth Rate | CAGR of 28.4% from 2020-2034 |
| Segmentation |
|
Table of Contents
- 1. Introduction
- 1.1. Research Scope
- 1.2. Market Segmentation
- 1.3. Research Methodology
- 1.4. Definitions and Assumptions
- 2. Executive Summary
- 2.1. Introduction
- 3. Market Dynamics
- 3.1. Introduction
- 3.2. Market Drivers
- 3.2.1. Growth in Wearable Electronics Industry; Miniaturization of Electronics and Developments across Flexible Electronics
- 3.3. Market Restrains
- 3.3.1. High Initial Cost
- 3.4. Market Trends
- 3.4.1. Fashion and Entertainment Industry to Witness Significant Growth
- 4. Market Factor Analysis
- 4.1. Porters Five Forces
- 4.2. Supply/Value Chain
- 4.3. PESTEL analysis
- 4.4. Market Entropy
- 4.5. Patent/Trademark Analysis
- 5. Global Smart Fabrics Industry Analysis, Insights and Forecast, 2020-2032
- 5.1. Market Analysis, Insights and Forecast - by Type
- 5.1.1. Passive Smart Fabrics
- 5.1.2. Active Fabrics
- 5.1.3. Ultra-smart Fabrics
- 5.2. Market Analysis, Insights and Forecast - by Application
- 5.2.1. Fashion and Entertainment
- 5.2.2. Sports and Fitness
- 5.2.3. Medical
- 5.2.4. Transportation and Others
- 5.2.5. Space and Military
- 5.2.6. Industrial
- 5.3. Market Analysis, Insights and Forecast - by Region
- 5.3.1. North America
- 5.3.2. Asia Pacific
- 5.3.3. Europe
- 5.3.4. Rest of the World
- 5.1. Market Analysis, Insights and Forecast - by Type
- 6. North America Smart Fabrics Industry Analysis, Insights and Forecast, 2020-2032
- 6.1. Market Analysis, Insights and Forecast - by Type
- 6.1.1. Passive Smart Fabrics
- 6.1.2. Active Fabrics
- 6.1.3. Ultra-smart Fabrics
- 6.2. Market Analysis, Insights and Forecast - by Application
- 6.2.1. Fashion and Entertainment
- 6.2.2. Sports and Fitness
- 6.2.3. Medical
- 6.2.4. Transportation and Others
- 6.2.5. Space and Military
- 6.2.6. Industrial
- 6.1. Market Analysis, Insights and Forecast - by Type
- 7. Asia Pacific Smart Fabrics Industry Analysis, Insights and Forecast, 2020-2032
- 7.1. Market Analysis, Insights and Forecast - by Type
- 7.1.1. Passive Smart Fabrics
- 7.1.2. Active Fabrics
- 7.1.3. Ultra-smart Fabrics
- 7.2. Market Analysis, Insights and Forecast - by Application
- 7.2.1. Fashion and Entertainment
- 7.2.2. Sports and Fitness
- 7.2.3. Medical
- 7.2.4. Transportation and Others
- 7.2.5. Space and Military
- 7.2.6. Industrial
- 7.1. Market Analysis, Insights and Forecast - by Type
- 8. Europe Smart Fabrics Industry Analysis, Insights and Forecast, 2020-2032
- 8.1. Market Analysis, Insights and Forecast - by Type
- 8.1.1. Passive Smart Fabrics
- 8.1.2. Active Fabrics
- 8.1.3. Ultra-smart Fabrics
- 8.2. Market Analysis, Insights and Forecast - by Application
- 8.2.1. Fashion and Entertainment
- 8.2.2. Sports and Fitness
- 8.2.3. Medical
- 8.2.4. Transportation and Others
- 8.2.5. Space and Military
- 8.2.6. Industrial
- 8.1. Market Analysis, Insights and Forecast - by Type
- 9. Rest of the World Smart Fabrics Industry Analysis, Insights and Forecast, 2020-2032
- 9.1. Market Analysis, Insights and Forecast - by Type
- 9.1.1. Passive Smart Fabrics
- 9.1.2. Active Fabrics
- 9.1.3. Ultra-smart Fabrics
- 9.2. Market Analysis, Insights and Forecast - by Application
- 9.2.1. Fashion and Entertainment
- 9.2.2. Sports and Fitness
- 9.2.3. Medical
- 9.2.4. Transportation and Others
- 9.2.5. Space and Military
- 9.2.6. Industrial
- 9.1. Market Analysis, Insights and Forecast - by Type
- 10. Competitive Analysis
- 10.1. Global Market Share Analysis 2025
- 10.2. Company Profiles
- 10.2.1 Adidas AG
- 10.2.1.1. Overview
- 10.2.1.2. Products
- 10.2.1.3. SWOT Analysis
- 10.2.1.4. Recent Developments
- 10.2.1.5. Financials (Based on Availability)
- 10.2.2 NIKE Inc
- 10.2.2.1. Overview
- 10.2.2.2. Products
- 10.2.2.3. SWOT Analysis
- 10.2.2.4. Recent Developments
- 10.2.2.5. Financials (Based on Availability)
- 10.2.3 ThermoSoft International Corporation
- 10.2.3.1. Overview
- 10.2.3.2. Products
- 10.2.3.3. SWOT Analysis
- 10.2.3.4. Recent Developments
- 10.2.3.5. Financials (Based on Availability)
- 10.2.4 Ohmatex
- 10.2.4.1. Overview
- 10.2.4.2. Products
- 10.2.4.3. SWOT Analysis
- 10.2.4.4. Recent Developments
- 10.2.4.5. Financials (Based on Availability)
- 10.2.5 AIQ Smart Clothing Inc
- 10.2.5.1. Overview
- 10.2.5.2. Products
- 10.2.5.3. SWOT Analysis
- 10.2.5.4. Recent Developments
- 10.2.5.5. Financials (Based on Availability)
- 10.2.6 OTEX Specialty Narrow Fabrics Inc
- 10.2.6.1. Overview
- 10.2.6.2. Products
- 10.2.6.3. SWOT Analysis
- 10.2.6.4. Recent Developments
- 10.2.6.5. Financials (Based on Availability)
- 10.2.7 Sensoria Inc
- 10.2.7.1. Overview
- 10.2.7.2. Products
- 10.2.7.3. SWOT Analysis
- 10.2.7.4. Recent Developments
- 10.2.7.5. Financials (Based on Availability)
- 10.2.8 Schoeller Textil AG
- 10.2.8.1. Overview
- 10.2.8.2. Products
- 10.2.8.3. SWOT Analysis
- 10.2.8.4. Recent Developments
- 10.2.8.5. Financials (Based on Availability)
- 10.2.9 Interactive Wear AG
- 10.2.9.1. Overview
- 10.2.9.2. Products
- 10.2.9.3. SWOT Analysis
- 10.2.9.4. Recent Developments
- 10.2.9.5. Financials (Based on Availability)
- 10.2.10 Kolon Industries Inc
- 10.2.10.1. Overview
- 10.2.10.2. Products
- 10.2.10.3. SWOT Analysis
- 10.2.10.4. Recent Developments
- 10.2.10.5. Financials (Based on Availability)
- 10.2.1 Adidas AG
List of Figures
- Figure 1: Global Smart Fabrics Industry Revenue Breakdown (billion, %) by Region 2025 & 2033
- Figure 2: Global Smart Fabrics Industry Volume Breakdown (Million, %) by Region 2025 & 2033
- Figure 3: North America Smart Fabrics Industry Revenue (billion), by Type 2025 & 2033
- Figure 4: North America Smart Fabrics Industry Volume (Million), by Type 2025 & 2033
- Figure 5: North America Smart Fabrics Industry Revenue Share (%), by Type 2025 & 2033
- Figure 6: North America Smart Fabrics Industry Volume Share (%), by Type 2025 & 2033
- Figure 7: North America Smart Fabrics Industry Revenue (billion), by Application 2025 & 2033
- Figure 8: North America Smart Fabrics Industry Volume (Million), by Application 2025 & 2033
- Figure 9: North America Smart Fabrics Industry Revenue Share (%), by Application 2025 & 2033
- Figure 10: North America Smart Fabrics Industry Volume Share (%), by Application 2025 & 2033
- Figure 11: North America Smart Fabrics Industry Revenue (billion), by Country 2025 & 2033
- Figure 12: North America Smart Fabrics Industry Volume (Million), by Country 2025 & 2033
- Figure 13: North America Smart Fabrics Industry Revenue Share (%), by Country 2025 & 2033
- Figure 14: North America Smart Fabrics Industry Volume Share (%), by Country 2025 & 2033
- Figure 15: Asia Pacific Smart Fabrics Industry Revenue (billion), by Type 2025 & 2033
- Figure 16: Asia Pacific Smart Fabrics Industry Volume (Million), by Type 2025 & 2033
- Figure 17: Asia Pacific Smart Fabrics Industry Revenue Share (%), by Type 2025 & 2033
- Figure 18: Asia Pacific Smart Fabrics Industry Volume Share (%), by Type 2025 & 2033
- Figure 19: Asia Pacific Smart Fabrics Industry Revenue (billion), by Application 2025 & 2033
- Figure 20: Asia Pacific Smart Fabrics Industry Volume (Million), by Application 2025 & 2033
- Figure 21: Asia Pacific Smart Fabrics Industry Revenue Share (%), by Application 2025 & 2033
- Figure 22: Asia Pacific Smart Fabrics Industry Volume Share (%), by Application 2025 & 2033
- Figure 23: Asia Pacific Smart Fabrics Industry Revenue (billion), by Country 2025 & 2033
- Figure 24: Asia Pacific Smart Fabrics Industry Volume (Million), by Country 2025 & 2033
- Figure 25: Asia Pacific Smart Fabrics Industry Revenue Share (%), by Country 2025 & 2033
- Figure 26: Asia Pacific Smart Fabrics Industry Volume Share (%), by Country 2025 & 2033
- Figure 27: Europe Smart Fabrics Industry Revenue (billion), by Type 2025 & 2033
- Figure 28: Europe Smart Fabrics Industry Volume (Million), by Type 2025 & 2033
- Figure 29: Europe Smart Fabrics Industry Revenue Share (%), by Type 2025 & 2033
- Figure 30: Europe Smart Fabrics Industry Volume Share (%), by Type 2025 & 2033
- Figure 31: Europe Smart Fabrics Industry Revenue (billion), by Application 2025 & 2033
- Figure 32: Europe Smart Fabrics Industry Volume (Million), by Application 2025 & 2033
- Figure 33: Europe Smart Fabrics Industry Revenue Share (%), by Application 2025 & 2033
- Figure 34: Europe Smart Fabrics Industry Volume Share (%), by Application 2025 & 2033
- Figure 35: Europe Smart Fabrics Industry Revenue (billion), by Country 2025 & 2033
- Figure 36: Europe Smart Fabrics Industry Volume (Million), by Country 2025 & 2033
- Figure 37: Europe Smart Fabrics Industry Revenue Share (%), by Country 2025 & 2033
- Figure 38: Europe Smart Fabrics Industry Volume Share (%), by Country 2025 & 2033
- Figure 39: Rest of the World Smart Fabrics Industry Revenue (billion), by Type 2025 & 2033
- Figure 40: Rest of the World Smart Fabrics Industry Volume (Million), by Type 2025 & 2033
- Figure 41: Rest of the World Smart Fabrics Industry Revenue Share (%), by Type 2025 & 2033
- Figure 42: Rest of the World Smart Fabrics Industry Volume Share (%), by Type 2025 & 2033
- Figure 43: Rest of the World Smart Fabrics Industry Revenue (billion), by Application 2025 & 2033
- Figure 44: Rest of the World Smart Fabrics Industry Volume (Million), by Application 2025 & 2033
- Figure 45: Rest of the World Smart Fabrics Industry Revenue Share (%), by Application 2025 & 2033
- Figure 46: Rest of the World Smart Fabrics Industry Volume Share (%), by Application 2025 & 2033
- Figure 47: Rest of the World Smart Fabrics Industry Revenue (billion), by Country 2025 & 2033
- Figure 48: Rest of the World Smart Fabrics Industry Volume (Million), by Country 2025 & 2033
- Figure 49: Rest of the World Smart Fabrics Industry Revenue Share (%), by Country 2025 & 2033
- Figure 50: Rest of the World Smart Fabrics Industry Volume Share (%), by Country 2025 & 2033
List of Tables
- Table 1: Global Smart Fabrics Industry Revenue billion Forecast, by Type 2020 & 2033
- Table 2: Global Smart Fabrics Industry Volume Million Forecast, by Type 2020 & 2033
- Table 3: Global Smart Fabrics Industry Revenue billion Forecast, by Application 2020 & 2033
- Table 4: Global Smart Fabrics Industry Volume Million Forecast, by Application 2020 & 2033
- Table 5: Global Smart Fabrics Industry Revenue billion Forecast, by Region 2020 & 2033
- Table 6: Global Smart Fabrics Industry Volume Million Forecast, by Region 2020 & 2033
- Table 7: Global Smart Fabrics Industry Revenue billion Forecast, by Type 2020 & 2033
- Table 8: Global Smart Fabrics Industry Volume Million Forecast, by Type 2020 & 2033
- Table 9: Global Smart Fabrics Industry Revenue billion Forecast, by Application 2020 & 2033
- Table 10: Global Smart Fabrics Industry Volume Million Forecast, by Application 2020 & 2033
- Table 11: Global Smart Fabrics Industry Revenue billion Forecast, by Country 2020 & 2033
- Table 12: Global Smart Fabrics Industry Volume Million Forecast, by Country 2020 & 2033
- Table 13: Global Smart Fabrics Industry Revenue billion Forecast, by Type 2020 & 2033
- Table 14: Global Smart Fabrics Industry Volume Million Forecast, by Type 2020 & 2033
- Table 15: Global Smart Fabrics Industry Revenue billion Forecast, by Application 2020 & 2033
- Table 16: Global Smart Fabrics Industry Volume Million Forecast, by Application 2020 & 2033
- Table 17: Global Smart Fabrics Industry Revenue billion Forecast, by Country 2020 & 2033
- Table 18: Global Smart Fabrics Industry Volume Million Forecast, by Country 2020 & 2033
- Table 19: Global Smart Fabrics Industry Revenue billion Forecast, by Type 2020 & 2033
- Table 20: Global Smart Fabrics Industry Volume Million Forecast, by Type 2020 & 2033
- Table 21: Global Smart Fabrics Industry Revenue billion Forecast, by Application 2020 & 2033
- Table 22: Global Smart Fabrics Industry Volume Million Forecast, by Application 2020 & 2033
- Table 23: Global Smart Fabrics Industry Revenue billion Forecast, by Country 2020 & 2033
- Table 24: Global Smart Fabrics Industry Volume Million Forecast, by Country 2020 & 2033
- Table 25: Global Smart Fabrics Industry Revenue billion Forecast, by Type 2020 & 2033
- Table 26: Global Smart Fabrics Industry Volume Million Forecast, by Type 2020 & 2033
- Table 27: Global Smart Fabrics Industry Revenue billion Forecast, by Application 2020 & 2033
- Table 28: Global Smart Fabrics Industry Volume Million Forecast, by Application 2020 & 2033
- Table 29: Global Smart Fabrics Industry Revenue billion Forecast, by Country 2020 & 2033
- Table 30: Global Smart Fabrics Industry Volume Million Forecast, by Country 2020 & 2033
Frequently Asked Questions
1. What is the projected Compound Annual Growth Rate (CAGR) of the Smart Fabrics Industry?
The projected CAGR is approximately 28.4%.
2. Which companies are prominent players in the Smart Fabrics Industry?
Key companies in the market include Adidas AG, NIKE Inc, ThermoSoft International Corporation, Ohmatex, AIQ Smart Clothing Inc, OTEX Specialty Narrow Fabrics Inc , Sensoria Inc, Schoeller Textil AG, Interactive Wear AG, Kolon Industries Inc.
3. What are the main segments of the Smart Fabrics Industry?
The market segments include Type, Application.
4. Can you provide details about the market size?
The market size is estimated to be USD 39.51 billion as of 2022.
5. What are some drivers contributing to market growth?
Growth in Wearable Electronics Industry; Miniaturization of Electronics and Developments across Flexible Electronics.
6. What are the notable trends driving market growth?
Fashion and Entertainment Industry to Witness Significant Growth.
7. Are there any restraints impacting market growth?
High Initial Cost.
8. Can you provide examples of recent developments in the market?
April 2023 : A team at Cambridge University has developed a fabric that would incorporate LEDs, energy harvesting, storage capabilities, and sensors into clothing. The researchers have exhibited a method to produce next-generation smart textiles inexpensively and without changing the technology currently used for textile manufacturing.
9. What pricing options are available for accessing the report?
Pricing options include single-user, multi-user, and enterprise licenses priced at USD 4750, USD 5250, and USD 8750 respectively.
10. Is the market size provided in terms of value or volume?
The market size is provided in terms of value, measured in billion and volume, measured in Million.
11. Are there any specific market keywords associated with the report?
Yes, the market keyword associated with the report is "Smart Fabrics Industry," which aids in identifying and referencing the specific market segment covered.
12. How do I determine which pricing option suits my needs best?
The pricing options vary based on user requirements and access needs. Individual users may opt for single-user licenses, while businesses requiring broader access may choose multi-user or enterprise licenses for cost-effective access to the report.
13. Are there any additional resources or data provided in the Smart Fabrics Industry report?
While the report offers comprehensive insights, it's advisable to review the specific contents or supplementary materials provided to ascertain if additional resources or data are available.
14. How can I stay updated on further developments or reports in the Smart Fabrics Industry?
To stay informed about further developments, trends, and reports in the Smart Fabrics Industry, consider subscribing to industry newsletters, following relevant companies and organizations, or regularly checking reputable industry news sources and publications.
Methodology
Step 1 - Identification of Relevant Samples Size from Population Database


Step 2 - Approaches for Defining Global Market Size (Value, Volume* & Price*)

Note*: In applicable scenarios
Step 3 - Data Sources
Primary Research
- Web Analytics
- Survey Reports
- Research Institute
- Latest Research Reports
- Opinion Leaders
Secondary Research
- Annual Reports
- White Paper
- Latest Press Release
- Industry Association
- Paid Database
- Investor Presentations

Step 4 - Data Triangulation
Involves using different sources of information in order to increase the validity of a study
These sources are likely to be stakeholders in a program - participants, other researchers, program staff, other community members, and so on.
Then we put all data in single framework & apply various statistical tools to find out the dynamic on the market.
During the analysis stage, feedback from the stakeholder groups would be compared to determine areas of agreement as well as areas of divergence