

Key Insights
The MEA (Middle East and Africa) Hazardous Location Connectors market, currently experiencing robust growth, is projected to expand significantly over the forecast period (2025-2033). Driven by the burgeoning oil and gas, petrochemical, and pharmaceutical sectors in the region, along with increasing investments in infrastructure development and industrial automation, demand for explosion-proof and intrinsically safe connectors is steadily rising. The market segmentation reveals a strong preference for Class I and II connectors, reflecting the prevalence of flammable gases and combustible dusts in various industrial applications across MEA. Zone 1 and Zone 2 classifications dominate the market share, indicating a high concentration of hazardous locations within industrial facilities. The food and beverage processing industry is also contributing to market growth, driven by the need for reliable and safe electrical connections in potentially explosive environments. While regulatory compliance and stringent safety standards pose some restraints, the overall market outlook remains positive, fueled by government initiatives promoting industrial safety and the continuous expansion of key industries within MEA.
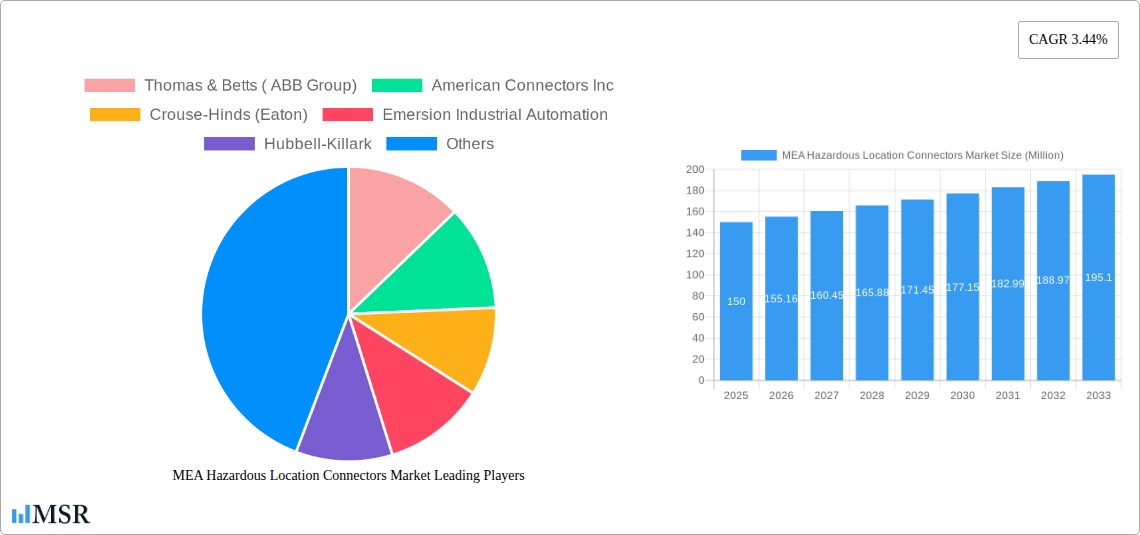
Competitive landscape analysis suggests that established players like Thomas & Betts (ABB Group), Eaton (Crouse-Hinds), and Hubbell-Killark hold significant market shares due to their established brand reputation and comprehensive product portfolios. However, smaller players and new entrants are also emerging, capitalizing on the increasing demand and offering specialized solutions for niche applications within the MEA market. Technological advancements, such as improved connector designs for enhanced safety and reliability, are also driving market expansion. The focus on smart manufacturing and the adoption of Industry 4.0 technologies further propel the demand for advanced hazardous location connectors capable of integrating with sophisticated control systems. Future growth will largely depend on the sustained expansion of key industries, infrastructure development, and the ongoing adoption of safety standards within the region.
MEA Hazardous Location Connectors Market: A Comprehensive Report (2019-2033)
This comprehensive report provides an in-depth analysis of the MEA Hazardous Location Connectors Market, offering valuable insights for industry stakeholders, investors, and strategic decision-makers. Covering the period from 2019 to 2033, with a focus on the estimated year 2025, this report meticulously examines market dynamics, key segments, leading players, and future growth opportunities. The MEA region presents a significant market for hazardous location connectors, driven by robust growth in key industries and expanding infrastructure projects. The market is expected to reach xx Million by 2033.
MEA Hazardous Location Connectors Market Concentration & Dynamics
This section assesses the competitive landscape, innovation, regulations, and market trends within the MEA Hazardous Location Connectors Market. The market exhibits a moderately concentrated structure, with key players holding significant market share.
Market Concentration: The top five players, including Thomas & Betts (ABB Group), Crouse-Hinds (Eaton), Hubbell-Killark, Amphenol Industrial Products Group, and Emerson Industrial Automation, collectively account for an estimated xx% of the market share in 2025. Smaller players contribute to a more fragmented market landscape.
Innovation Ecosystem: Ongoing innovation focuses on enhancing safety features, improving durability in harsh environments, and developing connectors that meet increasingly stringent industry regulations. Advancements in materials science and miniaturization are driving product development.
Regulatory Frameworks: Stringent safety regulations within the MEA region, aligned with international standards, significantly influence product design and market entry. Compliance with these standards is paramount for all market participants.
Substitute Products: While limited, alternative connection methods exist; however, the specialized safety features and reliability of hazardous location connectors limit the impact of substitutes.
End-User Trends: The increasing adoption of automation and digitalization in various industries, particularly oil & gas and petrochemicals, is a key driver of market growth. Demand for robust and reliable connectors is expected to grow in line with this trend.
M&A Activities: The number of M&A deals in this sector has been relatively low in recent years (approximately xx deals between 2019 and 2024), indicating a more organic growth strategy among major players.
MEA Hazardous Location Connectors Market Industry Insights & Trends
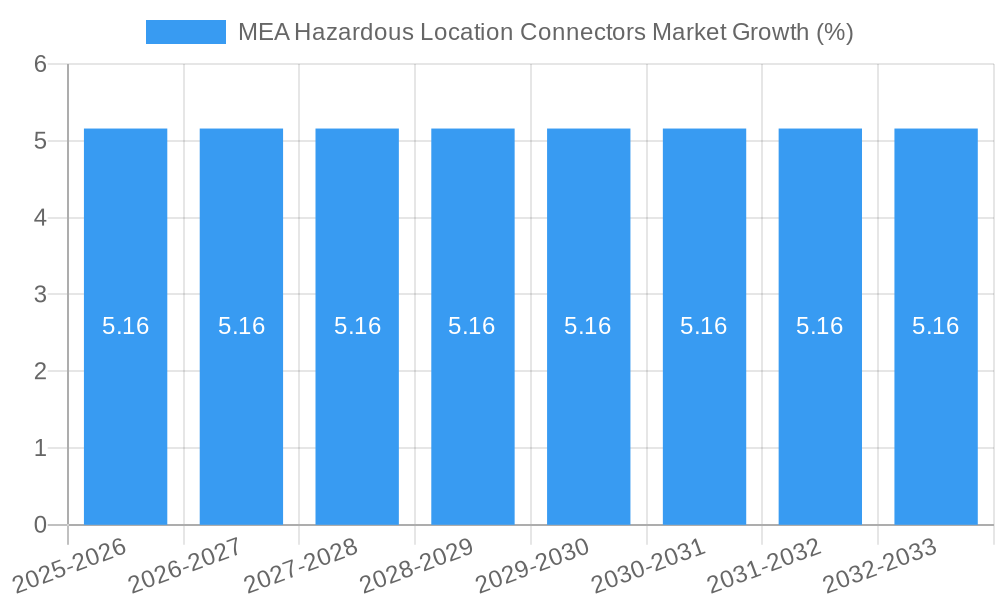
The MEA Hazardous Location Connectors Market is experiencing robust growth, driven by several factors. The market size reached xx Million in 2024 and is projected to grow at a Compound Annual Growth Rate (CAGR) of xx% during the forecast period (2025-2033).
This expansion is fueled by rising investments in infrastructure projects, particularly in the oil & gas, petrochemical, and pharmaceutical sectors. Stringent safety regulations are also driving demand for compliant connectors. Technological advancements, such as improved sealing mechanisms and enhanced material properties, are contributing to product innovation and market expansion. Furthermore, increasing awareness of workplace safety and the need for reliable electrical connections in hazardous environments are contributing to market growth. The market is also witnessing a growing trend toward the adoption of smart connectors, enabled by embedded sensors and data analytics capabilities. This trend is transforming the way connectivity is managed in hazardous locations, enabling proactive maintenance and improved safety. The increasing adoption of automation and Industry 4.0 technologies across various sectors further propels the demand for high-performance, reliable connectors in hazardous environments.
Key Markets & Segments Leading MEA Hazardous Location Connectors Market
The MEA Hazardous Location Connectors Market demonstrates diverse segment performance across classes, hazardous zones, and applications.
By Class: Class I connectors hold the largest market share, driven by their prevalence in applications involving flammable gases or vapors. Class II and Class III segments follow, catering to specific hazardous environments.
By Hazardous Zones: Zone 1 and Zone 2 installations dominate the market due to the broader range of industries and applications within these zones. Zone 0 installations comprise a smaller, specialized segment.
By Applications:
- Oil & Gas Production: A major driver due to the inherent hazards in this industry.
- Oil Refineries & Petrochemical Refineries: High demand for safety-critical connectors.
- Pharmaceutical Manufacturing: Stringent regulations and safety concerns fuel market growth.
- Food & Beverage Processing: Demand is driven by the need for hygienic and explosion-proof connectors.
- Wastewater Treatment Facilities: Demand is driven by the corrosive and potentially explosive nature of the environment.
- Other Applications: This segment includes various industries with hazardous environments, contributing to overall market growth.
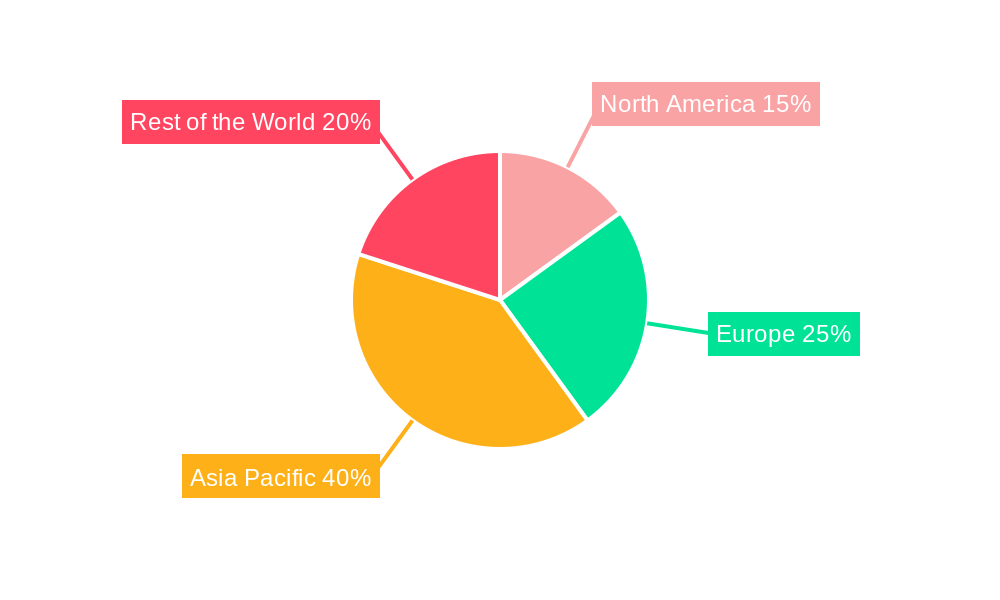
Regional Dominance: The [Specific Country/Region within MEA – requires further research to determine the dominant region] region holds the largest market share within the MEA region due to [Specific reasons, e.g., higher concentration of oil & gas operations, robust industrial activity, supportive government policies].
Market Drivers:
- Strong economic growth across MEA nations
- Rapid industrialization and infrastructure development
- Increasing demand for safety and compliance with international standards
- Rising investments in oil & gas, petrochemical, and pharmaceutical sectors.
MEA Hazardous Location Connectors Market Product Developments
Recent product innovations have focused on enhancing safety, reliability, and ease of installation. New materials, improved sealing techniques, and miniaturization are key trends. Manufacturers are also incorporating smart features, such as built-in sensors and diagnostics, to enable remote monitoring and predictive maintenance. This reduces downtime and improves overall safety in hazardous locations. The competitive edge lies in offering innovative solutions that meet increasingly stringent regulatory requirements while providing enhanced performance and reliability.
Challenges in the MEA Hazardous Location Connectors Market Market
The MEA Hazardous Location Connectors Market faces several challenges. Supply chain disruptions, particularly related to material sourcing and logistics, can impact production and availability. Stringent regulatory compliance requirements impose costs and complexity on manufacturers. Furthermore, intense competition from established players and the emergence of new entrants create pricing pressures. These factors can collectively impact market growth and profitability. The cost of compliance can also be a barrier for smaller players, limiting market entry.
Forces Driving MEA Hazardous Location Connectors Market Growth
Key growth drivers include the rising demand for safety and compliance in hazardous environments, robust economic growth in several MEA countries, and continuous expansion of industries like oil & gas and petrochemicals. Government regulations mandating the use of certified hazardous location connectors further contribute to market growth. Technological advancements, such as the integration of smart sensors and improved connector designs, are also key drivers. Increased awareness of workplace safety regulations will continue to drive demand for reliable and safe connectors in the region.
Long-Term Growth Catalysts in the MEA Hazardous Location Connectors Market
Long-term growth is driven by continued infrastructure development across the MEA region, coupled with sustained investment in industrial sectors. Strategic partnerships and collaborations among manufacturers and end-users are fostering innovation and market expansion. The emergence of new applications and the development of advanced materials will continue to drive demand for hazardous location connectors in the coming years. Furthermore, expanding regulatory compliance requirements across various industries will positively impact long-term market growth.
Emerging Opportunities in MEA Hazardous Location Connectors Market
Emerging opportunities lie in the adoption of IoT-enabled connectors, allowing for remote monitoring and predictive maintenance. The development of more durable and environmentally friendly materials offers significant growth potential. Expanding into new application areas within the renewable energy sector and the rise of smart cities will present lucrative opportunities. Furthermore, providing customized solutions to meet specific industry needs will provide a significant competitive advantage.
Leading Players in the MEA Hazardous Location Connectors Market Sector
- Thomas & Betts (ABB Group)
- American Connectors Inc
- Crouse-Hinds (Eaton)
- Emersion Industrial Automation
- Hubbell-Killark
- Vantage Technology
- Amphenol Industrial Products Group
- ITT BIW Connector Systems
Key Milestones in MEA Hazardous Location Connectors Market Industry
- November 2021: Emerson introduced two new open path gas detectors, enhancing safety and reducing downtime in extreme environments. This signifies a move towards advanced safety solutions within hazardous locations, indirectly impacting demand for compatible connectors.
- April 2022: Emerson expanded its ASCO series 090 miniature solenoid valves, offering space-efficient solutions for gas control. This product development demonstrates ongoing innovation within the broader hazardous location equipment market, which could influence connector design and demand.
Strategic Outlook for MEA Hazardous Location Connectors Market Market
The MEA Hazardous Location Connectors Market presents significant growth potential driven by industrial expansion and stringent safety regulations. Strategic opportunities include focusing on innovation, developing customized solutions for specific industries, and establishing strong partnerships with key players in the region. Companies that invest in R&D, focusing on advanced materials, smart features, and improved safety mechanisms, will gain a competitive edge. Expanding into emerging markets and capitalizing on the growing adoption of Industry 4.0 technologies will be crucial for long-term success.
MEA Hazardous Location Connectors Market Segmentation
-
1. Class
- 1.1. Class I
- 1.2. Class II
- 1.3. Class III
-
2. Hazardous Zones
- 2.1. Zone 0
- 2.2. Zone 1
- 2.3. Zone 2
-
3. Applications
- 3.1. Food & Beverage Processing
- 3.2. Oil & Gas Production
- 3.3. Oil Refineries
- 3.4. Petrochemical Refineries
- 3.5. Pharmaceutical Manufacturing
- 3.6. Wastewater Treatment Facilities
- 3.7. Other Applications
MEA Hazardous Location Connectors Market Segmentation By Geography
-
1. North America
- 1.1. United States
- 1.2. Canada
- 1.3. Mexico
-
2. South America
- 2.1. Brazil
- 2.2. Argentina
- 2.3. Rest of South America
-
3. Europe
- 3.1. United Kingdom
- 3.2. Germany
- 3.3. France
- 3.4. Italy
- 3.5. Spain
- 3.6. Russia
- 3.7. Benelux
- 3.8. Nordics
- 3.9. Rest of Europe
-
4. Middle East & Africa
- 4.1. Turkey
- 4.2. Israel
- 4.3. GCC
- 4.4. North Africa
- 4.5. South Africa
- 4.6. Rest of Middle East & Africa
-
5. Asia Pacific
- 5.1. China
- 5.2. India
- 5.3. Japan
- 5.4. South Korea
- 5.5. ASEAN
- 5.6. Oceania
- 5.7. Rest of Asia Pacific
MEA Hazardous Location Connectors Market REPORT HIGHLIGHTS
| Aspects | Details |
|---|---|
| Study Period | 2019-2033 |
| Base Year | 2024 |
| Estimated Year | 2025 |
| Forecast Period | 2025-2033 |
| Historical Period | 2019-2024 |
| Growth Rate | CAGR of 3.44% from 2019-2033 |
| Segmentation |
|
Table of Contents
- 1. Introduction
- 1.1. Research Scope
- 1.2. Market Segmentation
- 1.3. Research Methodology
- 1.4. Definitions and Assumptions
- 2. Executive Summary
- 2.1. Introduction
- 3. Market Dynamics
- 3.1. Introduction
- 3.2. Market Drivers
- 3.2.1. Rising Industrial Safety Measures; Increasing Applications in the Industrial Sector and Reducing Costs; Growing Awareness among Industry Personnel
- 3.3. Market Restrains
- 3.3.1. Complexity of Standards; Product Installation and Maintenance Costs
- 3.4. Market Trends
- 3.4.1. Oil Refineries to have a significant growth
- 4. Market Factor Analysis
- 4.1. Porters Five Forces
- 4.2. Supply/Value Chain
- 4.3. PESTEL analysis
- 4.4. Market Entropy
- 4.5. Patent/Trademark Analysis
- 5. Global MEA Hazardous Location Connectors Market Analysis, Insights and Forecast, 2019-2031
- 5.1. Market Analysis, Insights and Forecast - by Class
- 5.1.1. Class I
- 5.1.2. Class II
- 5.1.3. Class III
- 5.2. Market Analysis, Insights and Forecast - by Hazardous Zones
- 5.2.1. Zone 0
- 5.2.2. Zone 1
- 5.2.3. Zone 2
- 5.3. Market Analysis, Insights and Forecast - by Applications
- 5.3.1. Food & Beverage Processing
- 5.3.2. Oil & Gas Production
- 5.3.3. Oil Refineries
- 5.3.4. Petrochemical Refineries
- 5.3.5. Pharmaceutical Manufacturing
- 5.3.6. Wastewater Treatment Facilities
- 5.3.7. Other Applications
- 5.4. Market Analysis, Insights and Forecast - by Region
- 5.4.1. North America
- 5.4.2. South America
- 5.4.3. Europe
- 5.4.4. Middle East & Africa
- 5.4.5. Asia Pacific
- 5.1. Market Analysis, Insights and Forecast - by Class
- 6. North America MEA Hazardous Location Connectors Market Analysis, Insights and Forecast, 2019-2031
- 6.1. Market Analysis, Insights and Forecast - by Class
- 6.1.1. Class I
- 6.1.2. Class II
- 6.1.3. Class III
- 6.2. Market Analysis, Insights and Forecast - by Hazardous Zones
- 6.2.1. Zone 0
- 6.2.2. Zone 1
- 6.2.3. Zone 2
- 6.3. Market Analysis, Insights and Forecast - by Applications
- 6.3.1. Food & Beverage Processing
- 6.3.2. Oil & Gas Production
- 6.3.3. Oil Refineries
- 6.3.4. Petrochemical Refineries
- 6.3.5. Pharmaceutical Manufacturing
- 6.3.6. Wastewater Treatment Facilities
- 6.3.7. Other Applications
- 6.1. Market Analysis, Insights and Forecast - by Class
- 7. South America MEA Hazardous Location Connectors Market Analysis, Insights and Forecast, 2019-2031
- 7.1. Market Analysis, Insights and Forecast - by Class
- 7.1.1. Class I
- 7.1.2. Class II
- 7.1.3. Class III
- 7.2. Market Analysis, Insights and Forecast - by Hazardous Zones
- 7.2.1. Zone 0
- 7.2.2. Zone 1
- 7.2.3. Zone 2
- 7.3. Market Analysis, Insights and Forecast - by Applications
- 7.3.1. Food & Beverage Processing
- 7.3.2. Oil & Gas Production
- 7.3.3. Oil Refineries
- 7.3.4. Petrochemical Refineries
- 7.3.5. Pharmaceutical Manufacturing
- 7.3.6. Wastewater Treatment Facilities
- 7.3.7. Other Applications
- 7.1. Market Analysis, Insights and Forecast - by Class
- 8. Europe MEA Hazardous Location Connectors Market Analysis, Insights and Forecast, 2019-2031
- 8.1. Market Analysis, Insights and Forecast - by Class
- 8.1.1. Class I
- 8.1.2. Class II
- 8.1.3. Class III
- 8.2. Market Analysis, Insights and Forecast - by Hazardous Zones
- 8.2.1. Zone 0
- 8.2.2. Zone 1
- 8.2.3. Zone 2
- 8.3. Market Analysis, Insights and Forecast - by Applications
- 8.3.1. Food & Beverage Processing
- 8.3.2. Oil & Gas Production
- 8.3.3. Oil Refineries
- 8.3.4. Petrochemical Refineries
- 8.3.5. Pharmaceutical Manufacturing
- 8.3.6. Wastewater Treatment Facilities
- 8.3.7. Other Applications
- 8.1. Market Analysis, Insights and Forecast - by Class
- 9. Middle East & Africa MEA Hazardous Location Connectors Market Analysis, Insights and Forecast, 2019-2031
- 9.1. Market Analysis, Insights and Forecast - by Class
- 9.1.1. Class I
- 9.1.2. Class II
- 9.1.3. Class III
- 9.2. Market Analysis, Insights and Forecast - by Hazardous Zones
- 9.2.1. Zone 0
- 9.2.2. Zone 1
- 9.2.3. Zone 2
- 9.3. Market Analysis, Insights and Forecast - by Applications
- 9.3.1. Food & Beverage Processing
- 9.3.2. Oil & Gas Production
- 9.3.3. Oil Refineries
- 9.3.4. Petrochemical Refineries
- 9.3.5. Pharmaceutical Manufacturing
- 9.3.6. Wastewater Treatment Facilities
- 9.3.7. Other Applications
- 9.1. Market Analysis, Insights and Forecast - by Class
- 10. Asia Pacific MEA Hazardous Location Connectors Market Analysis, Insights and Forecast, 2019-2031
- 10.1. Market Analysis, Insights and Forecast - by Class
- 10.1.1. Class I
- 10.1.2. Class II
- 10.1.3. Class III
- 10.2. Market Analysis, Insights and Forecast - by Hazardous Zones
- 10.2.1. Zone 0
- 10.2.2. Zone 1
- 10.2.3. Zone 2
- 10.3. Market Analysis, Insights and Forecast - by Applications
- 10.3.1. Food & Beverage Processing
- 10.3.2. Oil & Gas Production
- 10.3.3. Oil Refineries
- 10.3.4. Petrochemical Refineries
- 10.3.5. Pharmaceutical Manufacturing
- 10.3.6. Wastewater Treatment Facilities
- 10.3.7. Other Applications
- 10.1. Market Analysis, Insights and Forecast - by Class
- 11. North America MEA Hazardous Location Connectors Market Analysis, Insights and Forecast, 2019-2031
- 11.1. Market Analysis, Insights and Forecast - By Country/Sub-region
- 11.1.1.
- 12. Europe MEA Hazardous Location Connectors Market Analysis, Insights and Forecast, 2019-2031
- 12.1. Market Analysis, Insights and Forecast - By Country/Sub-region
- 12.1.1.
- 13. Asia Pacific MEA Hazardous Location Connectors Market Analysis, Insights and Forecast, 2019-2031
- 13.1. Market Analysis, Insights and Forecast - By Country/Sub-region
- 13.1.1.
- 14. Rest of the World MEA Hazardous Location Connectors Market Analysis, Insights and Forecast, 2019-2031
- 14.1. Market Analysis, Insights and Forecast - By Country/Sub-region
- 14.1.1.
- 15. Competitive Analysis
- 15.1. Global Market Share Analysis 2024
- 15.2. Company Profiles
- 15.2.1 Thomas & Betts ( ABB Group)
- 15.2.1.1. Overview
- 15.2.1.2. Products
- 15.2.1.3. SWOT Analysis
- 15.2.1.4. Recent Developments
- 15.2.1.5. Financials (Based on Availability)
- 15.2.2 American Connectors Inc
- 15.2.2.1. Overview
- 15.2.2.2. Products
- 15.2.2.3. SWOT Analysis
- 15.2.2.4. Recent Developments
- 15.2.2.5. Financials (Based on Availability)
- 15.2.3 Crouse-Hinds (Eaton)
- 15.2.3.1. Overview
- 15.2.3.2. Products
- 15.2.3.3. SWOT Analysis
- 15.2.3.4. Recent Developments
- 15.2.3.5. Financials (Based on Availability)
- 15.2.4 Emersion Industrial Automation
- 15.2.4.1. Overview
- 15.2.4.2. Products
- 15.2.4.3. SWOT Analysis
- 15.2.4.4. Recent Developments
- 15.2.4.5. Financials (Based on Availability)
- 15.2.5 Hubbell-Killark
- 15.2.5.1. Overview
- 15.2.5.2. Products
- 15.2.5.3. SWOT Analysis
- 15.2.5.4. Recent Developments
- 15.2.5.5. Financials (Based on Availability)
- 15.2.6 Vantage Technology
- 15.2.6.1. Overview
- 15.2.6.2. Products
- 15.2.6.3. SWOT Analysis
- 15.2.6.4. Recent Developments
- 15.2.6.5. Financials (Based on Availability)
- 15.2.7 Amphenol Industrial Products Group
- 15.2.7.1. Overview
- 15.2.7.2. Products
- 15.2.7.3. SWOT Analysis
- 15.2.7.4. Recent Developments
- 15.2.7.5. Financials (Based on Availability)
- 15.2.8 ITT BIW Connector Systems
- 15.2.8.1. Overview
- 15.2.8.2. Products
- 15.2.8.3. SWOT Analysis
- 15.2.8.4. Recent Developments
- 15.2.8.5. Financials (Based on Availability)
- 15.2.1 Thomas & Betts ( ABB Group)
List of Figures
- Figure 1: Global MEA Hazardous Location Connectors Market Revenue Breakdown (Million, %) by Region 2024 & 2032
- Figure 2: Global MEA Hazardous Location Connectors Market Volume Breakdown (K Unit, %) by Region 2024 & 2032
- Figure 3: North America MEA Hazardous Location Connectors Market Revenue (Million), by Country 2024 & 2032
- Figure 4: North America MEA Hazardous Location Connectors Market Volume (K Unit), by Country 2024 & 2032
- Figure 5: North America MEA Hazardous Location Connectors Market Revenue Share (%), by Country 2024 & 2032
- Figure 6: North America MEA Hazardous Location Connectors Market Volume Share (%), by Country 2024 & 2032
- Figure 7: Europe MEA Hazardous Location Connectors Market Revenue (Million), by Country 2024 & 2032
- Figure 8: Europe MEA Hazardous Location Connectors Market Volume (K Unit), by Country 2024 & 2032
- Figure 9: Europe MEA Hazardous Location Connectors Market Revenue Share (%), by Country 2024 & 2032
- Figure 10: Europe MEA Hazardous Location Connectors Market Volume Share (%), by Country 2024 & 2032
- Figure 11: Asia Pacific MEA Hazardous Location Connectors Market Revenue (Million), by Country 2024 & 2032
- Figure 12: Asia Pacific MEA Hazardous Location Connectors Market Volume (K Unit), by Country 2024 & 2032
- Figure 13: Asia Pacific MEA Hazardous Location Connectors Market Revenue Share (%), by Country 2024 & 2032
- Figure 14: Asia Pacific MEA Hazardous Location Connectors Market Volume Share (%), by Country 2024 & 2032
- Figure 15: Rest of the World MEA Hazardous Location Connectors Market Revenue (Million), by Country 2024 & 2032
- Figure 16: Rest of the World MEA Hazardous Location Connectors Market Volume (K Unit), by Country 2024 & 2032
- Figure 17: Rest of the World MEA Hazardous Location Connectors Market Revenue Share (%), by Country 2024 & 2032
- Figure 18: Rest of the World MEA Hazardous Location Connectors Market Volume Share (%), by Country 2024 & 2032
- Figure 19: North America MEA Hazardous Location Connectors Market Revenue (Million), by Class 2024 & 2032
- Figure 20: North America MEA Hazardous Location Connectors Market Volume (K Unit), by Class 2024 & 2032
- Figure 21: North America MEA Hazardous Location Connectors Market Revenue Share (%), by Class 2024 & 2032
- Figure 22: North America MEA Hazardous Location Connectors Market Volume Share (%), by Class 2024 & 2032
- Figure 23: North America MEA Hazardous Location Connectors Market Revenue (Million), by Hazardous Zones 2024 & 2032
- Figure 24: North America MEA Hazardous Location Connectors Market Volume (K Unit), by Hazardous Zones 2024 & 2032
- Figure 25: North America MEA Hazardous Location Connectors Market Revenue Share (%), by Hazardous Zones 2024 & 2032
- Figure 26: North America MEA Hazardous Location Connectors Market Volume Share (%), by Hazardous Zones 2024 & 2032
- Figure 27: North America MEA Hazardous Location Connectors Market Revenue (Million), by Applications 2024 & 2032
- Figure 28: North America MEA Hazardous Location Connectors Market Volume (K Unit), by Applications 2024 & 2032
- Figure 29: North America MEA Hazardous Location Connectors Market Revenue Share (%), by Applications 2024 & 2032
- Figure 30: North America MEA Hazardous Location Connectors Market Volume Share (%), by Applications 2024 & 2032
- Figure 31: North America MEA Hazardous Location Connectors Market Revenue (Million), by Country 2024 & 2032
- Figure 32: North America MEA Hazardous Location Connectors Market Volume (K Unit), by Country 2024 & 2032
- Figure 33: North America MEA Hazardous Location Connectors Market Revenue Share (%), by Country 2024 & 2032
- Figure 34: North America MEA Hazardous Location Connectors Market Volume Share (%), by Country 2024 & 2032
- Figure 35: South America MEA Hazardous Location Connectors Market Revenue (Million), by Class 2024 & 2032
- Figure 36: South America MEA Hazardous Location Connectors Market Volume (K Unit), by Class 2024 & 2032
- Figure 37: South America MEA Hazardous Location Connectors Market Revenue Share (%), by Class 2024 & 2032
- Figure 38: South America MEA Hazardous Location Connectors Market Volume Share (%), by Class 2024 & 2032
- Figure 39: South America MEA Hazardous Location Connectors Market Revenue (Million), by Hazardous Zones 2024 & 2032
- Figure 40: South America MEA Hazardous Location Connectors Market Volume (K Unit), by Hazardous Zones 2024 & 2032
- Figure 41: South America MEA Hazardous Location Connectors Market Revenue Share (%), by Hazardous Zones 2024 & 2032
- Figure 42: South America MEA Hazardous Location Connectors Market Volume Share (%), by Hazardous Zones 2024 & 2032
- Figure 43: South America MEA Hazardous Location Connectors Market Revenue (Million), by Applications 2024 & 2032
- Figure 44: South America MEA Hazardous Location Connectors Market Volume (K Unit), by Applications 2024 & 2032
- Figure 45: South America MEA Hazardous Location Connectors Market Revenue Share (%), by Applications 2024 & 2032
- Figure 46: South America MEA Hazardous Location Connectors Market Volume Share (%), by Applications 2024 & 2032
- Figure 47: South America MEA Hazardous Location Connectors Market Revenue (Million), by Country 2024 & 2032
- Figure 48: South America MEA Hazardous Location Connectors Market Volume (K Unit), by Country 2024 & 2032
- Figure 49: South America MEA Hazardous Location Connectors Market Revenue Share (%), by Country 2024 & 2032
- Figure 50: South America MEA Hazardous Location Connectors Market Volume Share (%), by Country 2024 & 2032
- Figure 51: Europe MEA Hazardous Location Connectors Market Revenue (Million), by Class 2024 & 2032
- Figure 52: Europe MEA Hazardous Location Connectors Market Volume (K Unit), by Class 2024 & 2032
- Figure 53: Europe MEA Hazardous Location Connectors Market Revenue Share (%), by Class 2024 & 2032
- Figure 54: Europe MEA Hazardous Location Connectors Market Volume Share (%), by Class 2024 & 2032
- Figure 55: Europe MEA Hazardous Location Connectors Market Revenue (Million), by Hazardous Zones 2024 & 2032
- Figure 56: Europe MEA Hazardous Location Connectors Market Volume (K Unit), by Hazardous Zones 2024 & 2032
- Figure 57: Europe MEA Hazardous Location Connectors Market Revenue Share (%), by Hazardous Zones 2024 & 2032
- Figure 58: Europe MEA Hazardous Location Connectors Market Volume Share (%), by Hazardous Zones 2024 & 2032
- Figure 59: Europe MEA Hazardous Location Connectors Market Revenue (Million), by Applications 2024 & 2032
- Figure 60: Europe MEA Hazardous Location Connectors Market Volume (K Unit), by Applications 2024 & 2032
- Figure 61: Europe MEA Hazardous Location Connectors Market Revenue Share (%), by Applications 2024 & 2032
- Figure 62: Europe MEA Hazardous Location Connectors Market Volume Share (%), by Applications 2024 & 2032
- Figure 63: Europe MEA Hazardous Location Connectors Market Revenue (Million), by Country 2024 & 2032
- Figure 64: Europe MEA Hazardous Location Connectors Market Volume (K Unit), by Country 2024 & 2032
- Figure 65: Europe MEA Hazardous Location Connectors Market Revenue Share (%), by Country 2024 & 2032
- Figure 66: Europe MEA Hazardous Location Connectors Market Volume Share (%), by Country 2024 & 2032
- Figure 67: Middle East & Africa MEA Hazardous Location Connectors Market Revenue (Million), by Class 2024 & 2032
- Figure 68: Middle East & Africa MEA Hazardous Location Connectors Market Volume (K Unit), by Class 2024 & 2032
- Figure 69: Middle East & Africa MEA Hazardous Location Connectors Market Revenue Share (%), by Class 2024 & 2032
- Figure 70: Middle East & Africa MEA Hazardous Location Connectors Market Volume Share (%), by Class 2024 & 2032
- Figure 71: Middle East & Africa MEA Hazardous Location Connectors Market Revenue (Million), by Hazardous Zones 2024 & 2032
- Figure 72: Middle East & Africa MEA Hazardous Location Connectors Market Volume (K Unit), by Hazardous Zones 2024 & 2032
- Figure 73: Middle East & Africa MEA Hazardous Location Connectors Market Revenue Share (%), by Hazardous Zones 2024 & 2032
- Figure 74: Middle East & Africa MEA Hazardous Location Connectors Market Volume Share (%), by Hazardous Zones 2024 & 2032
- Figure 75: Middle East & Africa MEA Hazardous Location Connectors Market Revenue (Million), by Applications 2024 & 2032
- Figure 76: Middle East & Africa MEA Hazardous Location Connectors Market Volume (K Unit), by Applications 2024 & 2032
- Figure 77: Middle East & Africa MEA Hazardous Location Connectors Market Revenue Share (%), by Applications 2024 & 2032
- Figure 78: Middle East & Africa MEA Hazardous Location Connectors Market Volume Share (%), by Applications 2024 & 2032
- Figure 79: Middle East & Africa MEA Hazardous Location Connectors Market Revenue (Million), by Country 2024 & 2032
- Figure 80: Middle East & Africa MEA Hazardous Location Connectors Market Volume (K Unit), by Country 2024 & 2032
- Figure 81: Middle East & Africa MEA Hazardous Location Connectors Market Revenue Share (%), by Country 2024 & 2032
- Figure 82: Middle East & Africa MEA Hazardous Location Connectors Market Volume Share (%), by Country 2024 & 2032
- Figure 83: Asia Pacific MEA Hazardous Location Connectors Market Revenue (Million), by Class 2024 & 2032
- Figure 84: Asia Pacific MEA Hazardous Location Connectors Market Volume (K Unit), by Class 2024 & 2032
- Figure 85: Asia Pacific MEA Hazardous Location Connectors Market Revenue Share (%), by Class 2024 & 2032
- Figure 86: Asia Pacific MEA Hazardous Location Connectors Market Volume Share (%), by Class 2024 & 2032
- Figure 87: Asia Pacific MEA Hazardous Location Connectors Market Revenue (Million), by Hazardous Zones 2024 & 2032
- Figure 88: Asia Pacific MEA Hazardous Location Connectors Market Volume (K Unit), by Hazardous Zones 2024 & 2032
- Figure 89: Asia Pacific MEA Hazardous Location Connectors Market Revenue Share (%), by Hazardous Zones 2024 & 2032
- Figure 90: Asia Pacific MEA Hazardous Location Connectors Market Volume Share (%), by Hazardous Zones 2024 & 2032
- Figure 91: Asia Pacific MEA Hazardous Location Connectors Market Revenue (Million), by Applications 2024 & 2032
- Figure 92: Asia Pacific MEA Hazardous Location Connectors Market Volume (K Unit), by Applications 2024 & 2032
- Figure 93: Asia Pacific MEA Hazardous Location Connectors Market Revenue Share (%), by Applications 2024 & 2032
- Figure 94: Asia Pacific MEA Hazardous Location Connectors Market Volume Share (%), by Applications 2024 & 2032
- Figure 95: Asia Pacific MEA Hazardous Location Connectors Market Revenue (Million), by Country 2024 & 2032
- Figure 96: Asia Pacific MEA Hazardous Location Connectors Market Volume (K Unit), by Country 2024 & 2032
- Figure 97: Asia Pacific MEA Hazardous Location Connectors Market Revenue Share (%), by Country 2024 & 2032
- Figure 98: Asia Pacific MEA Hazardous Location Connectors Market Volume Share (%), by Country 2024 & 2032
List of Tables
- Table 1: Global MEA Hazardous Location Connectors Market Revenue Million Forecast, by Region 2019 & 2032
- Table 2: Global MEA Hazardous Location Connectors Market Volume K Unit Forecast, by Region 2019 & 2032
- Table 3: Global MEA Hazardous Location Connectors Market Revenue Million Forecast, by Class 2019 & 2032
- Table 4: Global MEA Hazardous Location Connectors Market Volume K Unit Forecast, by Class 2019 & 2032
- Table 5: Global MEA Hazardous Location Connectors Market Revenue Million Forecast, by Hazardous Zones 2019 & 2032
- Table 6: Global MEA Hazardous Location Connectors Market Volume K Unit Forecast, by Hazardous Zones 2019 & 2032
- Table 7: Global MEA Hazardous Location Connectors Market Revenue Million Forecast, by Applications 2019 & 2032
- Table 8: Global MEA Hazardous Location Connectors Market Volume K Unit Forecast, by Applications 2019 & 2032
- Table 9: Global MEA Hazardous Location Connectors Market Revenue Million Forecast, by Region 2019 & 2032
- Table 10: Global MEA Hazardous Location Connectors Market Volume K Unit Forecast, by Region 2019 & 2032
- Table 11: Global MEA Hazardous Location Connectors Market Revenue Million Forecast, by Country 2019 & 2032
- Table 12: Global MEA Hazardous Location Connectors Market Volume K Unit Forecast, by Country 2019 & 2032
- Table 13: MEA Hazardous Location Connectors Market Revenue (Million) Forecast, by Application 2019 & 2032
- Table 14: MEA Hazardous Location Connectors Market Volume (K Unit) Forecast, by Application 2019 & 2032
- Table 15: Global MEA Hazardous Location Connectors Market Revenue Million Forecast, by Country 2019 & 2032
- Table 16: Global MEA Hazardous Location Connectors Market Volume K Unit Forecast, by Country 2019 & 2032
- Table 17: MEA Hazardous Location Connectors Market Revenue (Million) Forecast, by Application 2019 & 2032
- Table 18: MEA Hazardous Location Connectors Market Volume (K Unit) Forecast, by Application 2019 & 2032
- Table 19: Global MEA Hazardous Location Connectors Market Revenue Million Forecast, by Country 2019 & 2032
- Table 20: Global MEA Hazardous Location Connectors Market Volume K Unit Forecast, by Country 2019 & 2032
- Table 21: MEA Hazardous Location Connectors Market Revenue (Million) Forecast, by Application 2019 & 2032
- Table 22: MEA Hazardous Location Connectors Market Volume (K Unit) Forecast, by Application 2019 & 2032
- Table 23: Global MEA Hazardous Location Connectors Market Revenue Million Forecast, by Country 2019 & 2032
- Table 24: Global MEA Hazardous Location Connectors Market Volume K Unit Forecast, by Country 2019 & 2032
- Table 25: MEA Hazardous Location Connectors Market Revenue (Million) Forecast, by Application 2019 & 2032
- Table 26: MEA Hazardous Location Connectors Market Volume (K Unit) Forecast, by Application 2019 & 2032
- Table 27: Global MEA Hazardous Location Connectors Market Revenue Million Forecast, by Class 2019 & 2032
- Table 28: Global MEA Hazardous Location Connectors Market Volume K Unit Forecast, by Class 2019 & 2032
- Table 29: Global MEA Hazardous Location Connectors Market Revenue Million Forecast, by Hazardous Zones 2019 & 2032
- Table 30: Global MEA Hazardous Location Connectors Market Volume K Unit Forecast, by Hazardous Zones 2019 & 2032
- Table 31: Global MEA Hazardous Location Connectors Market Revenue Million Forecast, by Applications 2019 & 2032
- Table 32: Global MEA Hazardous Location Connectors Market Volume K Unit Forecast, by Applications 2019 & 2032
- Table 33: Global MEA Hazardous Location Connectors Market Revenue Million Forecast, by Country 2019 & 2032
- Table 34: Global MEA Hazardous Location Connectors Market Volume K Unit Forecast, by Country 2019 & 2032
- Table 35: United States MEA Hazardous Location Connectors Market Revenue (Million) Forecast, by Application 2019 & 2032
- Table 36: United States MEA Hazardous Location Connectors Market Volume (K Unit) Forecast, by Application 2019 & 2032
- Table 37: Canada MEA Hazardous Location Connectors Market Revenue (Million) Forecast, by Application 2019 & 2032
- Table 38: Canada MEA Hazardous Location Connectors Market Volume (K Unit) Forecast, by Application 2019 & 2032
- Table 39: Mexico MEA Hazardous Location Connectors Market Revenue (Million) Forecast, by Application 2019 & 2032
- Table 40: Mexico MEA Hazardous Location Connectors Market Volume (K Unit) Forecast, by Application 2019 & 2032
- Table 41: Global MEA Hazardous Location Connectors Market Revenue Million Forecast, by Class 2019 & 2032
- Table 42: Global MEA Hazardous Location Connectors Market Volume K Unit Forecast, by Class 2019 & 2032
- Table 43: Global MEA Hazardous Location Connectors Market Revenue Million Forecast, by Hazardous Zones 2019 & 2032
- Table 44: Global MEA Hazardous Location Connectors Market Volume K Unit Forecast, by Hazardous Zones 2019 & 2032
- Table 45: Global MEA Hazardous Location Connectors Market Revenue Million Forecast, by Applications 2019 & 2032
- Table 46: Global MEA Hazardous Location Connectors Market Volume K Unit Forecast, by Applications 2019 & 2032
- Table 47: Global MEA Hazardous Location Connectors Market Revenue Million Forecast, by Country 2019 & 2032
- Table 48: Global MEA Hazardous Location Connectors Market Volume K Unit Forecast, by Country 2019 & 2032
- Table 49: Brazil MEA Hazardous Location Connectors Market Revenue (Million) Forecast, by Application 2019 & 2032
- Table 50: Brazil MEA Hazardous Location Connectors Market Volume (K Unit) Forecast, by Application 2019 & 2032
- Table 51: Argentina MEA Hazardous Location Connectors Market Revenue (Million) Forecast, by Application 2019 & 2032
- Table 52: Argentina MEA Hazardous Location Connectors Market Volume (K Unit) Forecast, by Application 2019 & 2032
- Table 53: Rest of South America MEA Hazardous Location Connectors Market Revenue (Million) Forecast, by Application 2019 & 2032
- Table 54: Rest of South America MEA Hazardous Location Connectors Market Volume (K Unit) Forecast, by Application 2019 & 2032
- Table 55: Global MEA Hazardous Location Connectors Market Revenue Million Forecast, by Class 2019 & 2032
- Table 56: Global MEA Hazardous Location Connectors Market Volume K Unit Forecast, by Class 2019 & 2032
- Table 57: Global MEA Hazardous Location Connectors Market Revenue Million Forecast, by Hazardous Zones 2019 & 2032
- Table 58: Global MEA Hazardous Location Connectors Market Volume K Unit Forecast, by Hazardous Zones 2019 & 2032
- Table 59: Global MEA Hazardous Location Connectors Market Revenue Million Forecast, by Applications 2019 & 2032
- Table 60: Global MEA Hazardous Location Connectors Market Volume K Unit Forecast, by Applications 2019 & 2032
- Table 61: Global MEA Hazardous Location Connectors Market Revenue Million Forecast, by Country 2019 & 2032
- Table 62: Global MEA Hazardous Location Connectors Market Volume K Unit Forecast, by Country 2019 & 2032
- Table 63: United Kingdom MEA Hazardous Location Connectors Market Revenue (Million) Forecast, by Application 2019 & 2032
- Table 64: United Kingdom MEA Hazardous Location Connectors Market Volume (K Unit) Forecast, by Application 2019 & 2032
- Table 65: Germany MEA Hazardous Location Connectors Market Revenue (Million) Forecast, by Application 2019 & 2032
- Table 66: Germany MEA Hazardous Location Connectors Market Volume (K Unit) Forecast, by Application 2019 & 2032
- Table 67: France MEA Hazardous Location Connectors Market Revenue (Million) Forecast, by Application 2019 & 2032
- Table 68: France MEA Hazardous Location Connectors Market Volume (K Unit) Forecast, by Application 2019 & 2032
- Table 69: Italy MEA Hazardous Location Connectors Market Revenue (Million) Forecast, by Application 2019 & 2032
- Table 70: Italy MEA Hazardous Location Connectors Market Volume (K Unit) Forecast, by Application 2019 & 2032
- Table 71: Spain MEA Hazardous Location Connectors Market Revenue (Million) Forecast, by Application 2019 & 2032
- Table 72: Spain MEA Hazardous Location Connectors Market Volume (K Unit) Forecast, by Application 2019 & 2032
- Table 73: Russia MEA Hazardous Location Connectors Market Revenue (Million) Forecast, by Application 2019 & 2032
- Table 74: Russia MEA Hazardous Location Connectors Market Volume (K Unit) Forecast, by Application 2019 & 2032
- Table 75: Benelux MEA Hazardous Location Connectors Market Revenue (Million) Forecast, by Application 2019 & 2032
- Table 76: Benelux MEA Hazardous Location Connectors Market Volume (K Unit) Forecast, by Application 2019 & 2032
- Table 77: Nordics MEA Hazardous Location Connectors Market Revenue (Million) Forecast, by Application 2019 & 2032
- Table 78: Nordics MEA Hazardous Location Connectors Market Volume (K Unit) Forecast, by Application 2019 & 2032
- Table 79: Rest of Europe MEA Hazardous Location Connectors Market Revenue (Million) Forecast, by Application 2019 & 2032
- Table 80: Rest of Europe MEA Hazardous Location Connectors Market Volume (K Unit) Forecast, by Application 2019 & 2032
- Table 81: Global MEA Hazardous Location Connectors Market Revenue Million Forecast, by Class 2019 & 2032
- Table 82: Global MEA Hazardous Location Connectors Market Volume K Unit Forecast, by Class 2019 & 2032
- Table 83: Global MEA Hazardous Location Connectors Market Revenue Million Forecast, by Hazardous Zones 2019 & 2032
- Table 84: Global MEA Hazardous Location Connectors Market Volume K Unit Forecast, by Hazardous Zones 2019 & 2032
- Table 85: Global MEA Hazardous Location Connectors Market Revenue Million Forecast, by Applications 2019 & 2032
- Table 86: Global MEA Hazardous Location Connectors Market Volume K Unit Forecast, by Applications 2019 & 2032
- Table 87: Global MEA Hazardous Location Connectors Market Revenue Million Forecast, by Country 2019 & 2032
- Table 88: Global MEA Hazardous Location Connectors Market Volume K Unit Forecast, by Country 2019 & 2032
- Table 89: Turkey MEA Hazardous Location Connectors Market Revenue (Million) Forecast, by Application 2019 & 2032
- Table 90: Turkey MEA Hazardous Location Connectors Market Volume (K Unit) Forecast, by Application 2019 & 2032
- Table 91: Israel MEA Hazardous Location Connectors Market Revenue (Million) Forecast, by Application 2019 & 2032
- Table 92: Israel MEA Hazardous Location Connectors Market Volume (K Unit) Forecast, by Application 2019 & 2032
- Table 93: GCC MEA Hazardous Location Connectors Market Revenue (Million) Forecast, by Application 2019 & 2032
- Table 94: GCC MEA Hazardous Location Connectors Market Volume (K Unit) Forecast, by Application 2019 & 2032
- Table 95: North Africa MEA Hazardous Location Connectors Market Revenue (Million) Forecast, by Application 2019 & 2032
- Table 96: North Africa MEA Hazardous Location Connectors Market Volume (K Unit) Forecast, by Application 2019 & 2032
- Table 97: South Africa MEA Hazardous Location Connectors Market Revenue (Million) Forecast, by Application 2019 & 2032
- Table 98: South Africa MEA Hazardous Location Connectors Market Volume (K Unit) Forecast, by Application 2019 & 2032
- Table 99: Rest of Middle East & Africa MEA Hazardous Location Connectors Market Revenue (Million) Forecast, by Application 2019 & 2032
- Table 100: Rest of Middle East & Africa MEA Hazardous Location Connectors Market Volume (K Unit) Forecast, by Application 2019 & 2032
- Table 101: Global MEA Hazardous Location Connectors Market Revenue Million Forecast, by Class 2019 & 2032
- Table 102: Global MEA Hazardous Location Connectors Market Volume K Unit Forecast, by Class 2019 & 2032
- Table 103: Global MEA Hazardous Location Connectors Market Revenue Million Forecast, by Hazardous Zones 2019 & 2032
- Table 104: Global MEA Hazardous Location Connectors Market Volume K Unit Forecast, by Hazardous Zones 2019 & 2032
- Table 105: Global MEA Hazardous Location Connectors Market Revenue Million Forecast, by Applications 2019 & 2032
- Table 106: Global MEA Hazardous Location Connectors Market Volume K Unit Forecast, by Applications 2019 & 2032
- Table 107: Global MEA Hazardous Location Connectors Market Revenue Million Forecast, by Country 2019 & 2032
- Table 108: Global MEA Hazardous Location Connectors Market Volume K Unit Forecast, by Country 2019 & 2032
- Table 109: China MEA Hazardous Location Connectors Market Revenue (Million) Forecast, by Application 2019 & 2032
- Table 110: China MEA Hazardous Location Connectors Market Volume (K Unit) Forecast, by Application 2019 & 2032
- Table 111: India MEA Hazardous Location Connectors Market Revenue (Million) Forecast, by Application 2019 & 2032
- Table 112: India MEA Hazardous Location Connectors Market Volume (K Unit) Forecast, by Application 2019 & 2032
- Table 113: Japan MEA Hazardous Location Connectors Market Revenue (Million) Forecast, by Application 2019 & 2032
- Table 114: Japan MEA Hazardous Location Connectors Market Volume (K Unit) Forecast, by Application 2019 & 2032
- Table 115: South Korea MEA Hazardous Location Connectors Market Revenue (Million) Forecast, by Application 2019 & 2032
- Table 116: South Korea MEA Hazardous Location Connectors Market Volume (K Unit) Forecast, by Application 2019 & 2032
- Table 117: ASEAN MEA Hazardous Location Connectors Market Revenue (Million) Forecast, by Application 2019 & 2032
- Table 118: ASEAN MEA Hazardous Location Connectors Market Volume (K Unit) Forecast, by Application 2019 & 2032
- Table 119: Oceania MEA Hazardous Location Connectors Market Revenue (Million) Forecast, by Application 2019 & 2032
- Table 120: Oceania MEA Hazardous Location Connectors Market Volume (K Unit) Forecast, by Application 2019 & 2032
- Table 121: Rest of Asia Pacific MEA Hazardous Location Connectors Market Revenue (Million) Forecast, by Application 2019 & 2032
- Table 122: Rest of Asia Pacific MEA Hazardous Location Connectors Market Volume (K Unit) Forecast, by Application 2019 & 2032
Frequently Asked Questions
1. What is the projected Compound Annual Growth Rate (CAGR) of the MEA Hazardous Location Connectors Market?
The projected CAGR is approximately 3.44%.
2. Which companies are prominent players in the MEA Hazardous Location Connectors Market?
Key companies in the market include Thomas & Betts ( ABB Group), American Connectors Inc, Crouse-Hinds (Eaton), Emersion Industrial Automation, Hubbell-Killark, Vantage Technology, Amphenol Industrial Products Group, ITT BIW Connector Systems.
3. What are the main segments of the MEA Hazardous Location Connectors Market?
The market segments include Class, Hazardous Zones, Applications.
4. Can you provide details about the market size?
The market size is estimated to be USD XX Million as of 2022.
5. What are some drivers contributing to market growth?
Rising Industrial Safety Measures; Increasing Applications in the Industrial Sector and Reducing Costs; Growing Awareness among Industry Personnel.
6. What are the notable trends driving market growth?
Oil Refineries to have a significant growth.
7. Are there any restraints impacting market growth?
Complexity of Standards; Product Installation and Maintenance Costs.
8. Can you provide examples of recent developments in the market?
April 2022 - Emerson has expanded its ASCO series 090 lines of miniature solenoid valves, adding a new three-way series 090 valve configuration to enable more space-efficient and lighter solutions for gas control in oxygen therapy and compression therapy, and gas analyzer devices.
9. What pricing options are available for accessing the report?
Pricing options include single-user, multi-user, and enterprise licenses priced at USD 3800, USD 4500, and USD 5800 respectively.
10. Is the market size provided in terms of value or volume?
The market size is provided in terms of value, measured in Million and volume, measured in K Unit.
11. Are there any specific market keywords associated with the report?
Yes, the market keyword associated with the report is "MEA Hazardous Location Connectors Market," which aids in identifying and referencing the specific market segment covered.
12. How do I determine which pricing option suits my needs best?
The pricing options vary based on user requirements and access needs. Individual users may opt for single-user licenses, while businesses requiring broader access may choose multi-user or enterprise licenses for cost-effective access to the report.
13. Are there any additional resources or data provided in the MEA Hazardous Location Connectors Market report?
While the report offers comprehensive insights, it's advisable to review the specific contents or supplementary materials provided to ascertain if additional resources or data are available.
14. How can I stay updated on further developments or reports in the MEA Hazardous Location Connectors Market?
To stay informed about further developments, trends, and reports in the MEA Hazardous Location Connectors Market, consider subscribing to industry newsletters, following relevant companies and organizations, or regularly checking reputable industry news sources and publications.
Methodology
Step 1 - Identification of Relevant Samples Size from Population Database


Step 2 - Approaches for Defining Global Market Size (Value, Volume* & Price*)

Note*: In applicable scenarios
Step 3 - Data Sources
Primary Research
- Web Analytics
- Survey Reports
- Research Institute
- Latest Research Reports
- Opinion Leaders
Secondary Research
- Annual Reports
- White Paper
- Latest Press Release
- Industry Association
- Paid Database
- Investor Presentations

Step 4 - Data Triangulation
Involves using different sources of information in order to increase the validity of a study
These sources are likely to be stakeholders in a program - participants, other researchers, program staff, other community members, and so on.
Then we put all data in single framework & apply various statistical tools to find out the dynamic on the market.
During the analysis stage, feedback from the stakeholder groups would be compared to determine areas of agreement as well as areas of divergence
