

Key Insights
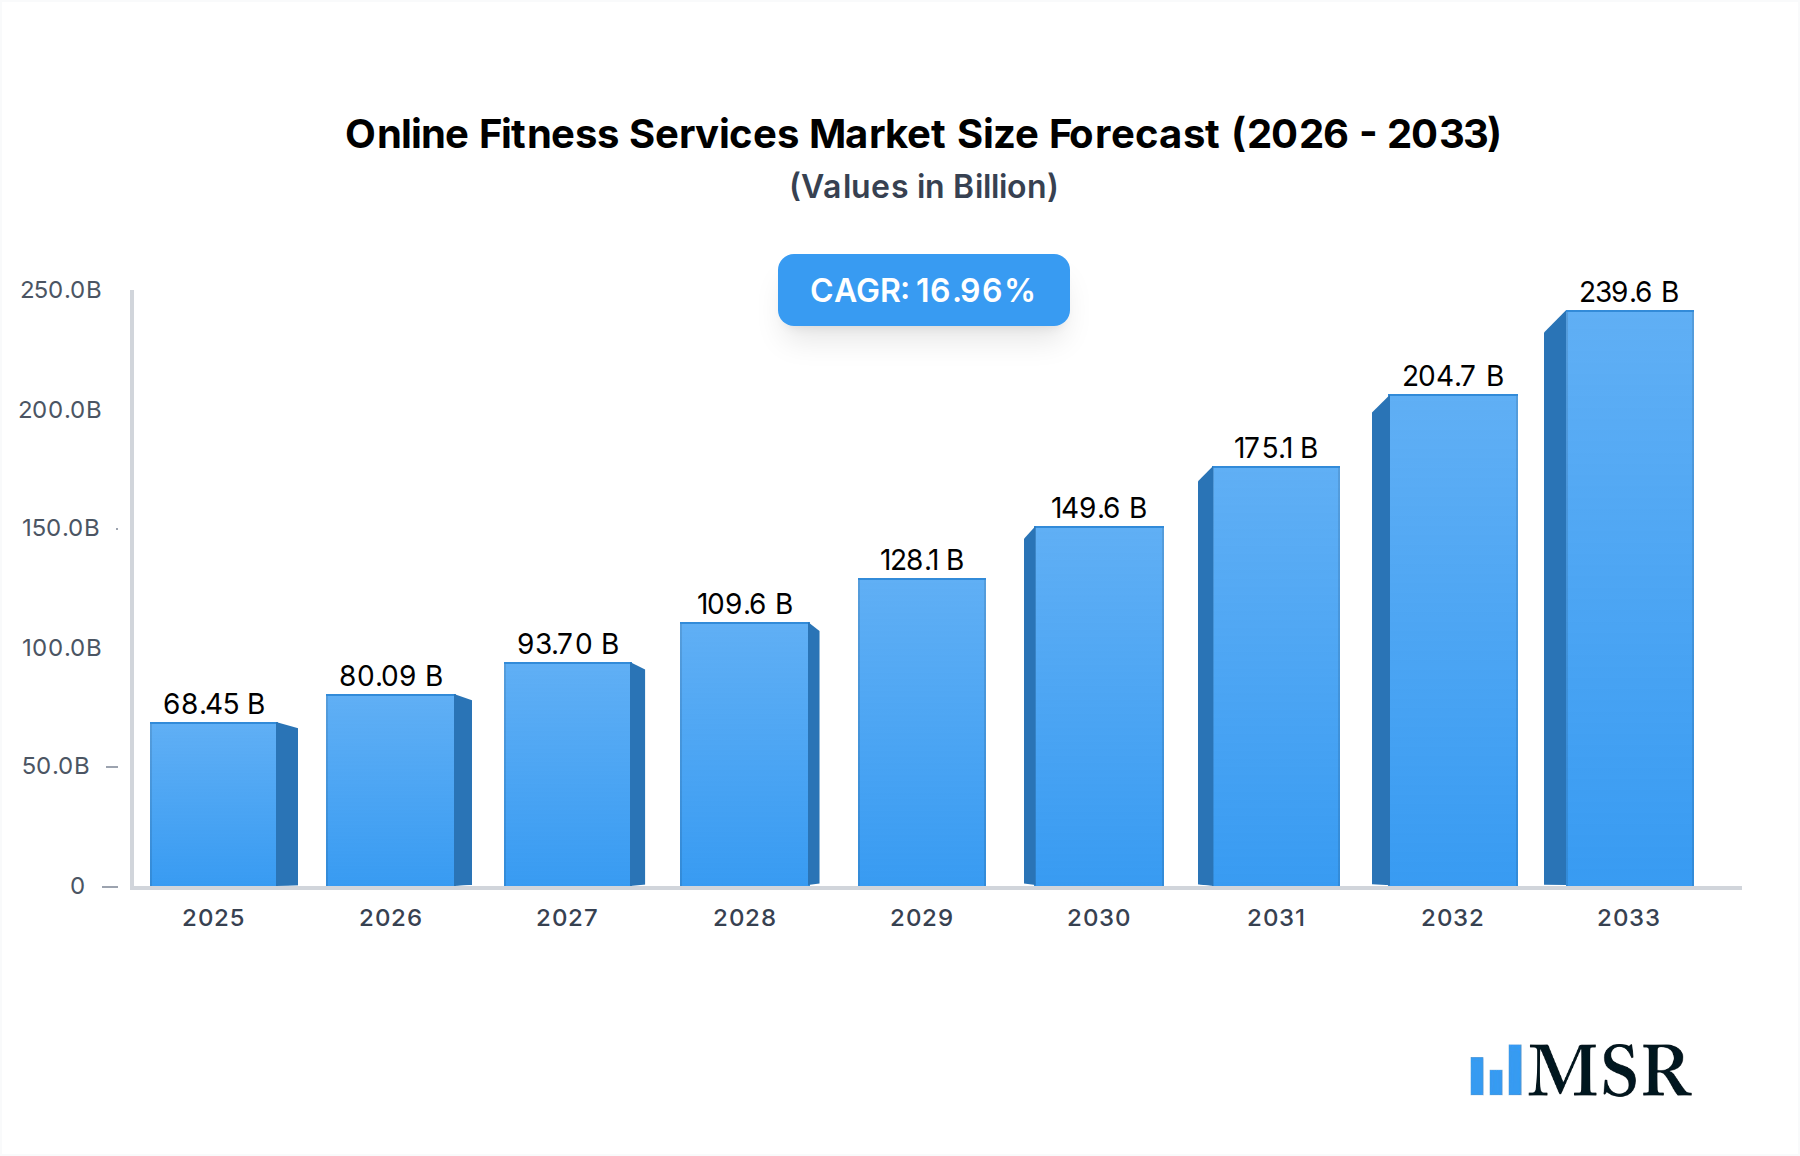
The global online fitness services market is experiencing robust expansion, projected to reach an estimated $68.45 billion in 2025. This impressive growth is fueled by a significant CAGR of 17%, indicating a dynamic and rapidly evolving sector. Key drivers include the increasing adoption of digital health solutions, a growing awareness of the importance of a healthy lifestyle, and the convenience offered by on-demand fitness content. The COVID-19 pandemic further accelerated this trend, normalizing remote workouts and establishing a lasting demand for flexible fitness options. Technological advancements in wearable devices and streaming capabilities are also playing a crucial role, enhancing user experience and personalization within online fitness platforms. The market is characterized by a strong focus on catering to both men and women, with diverse application segments. The business models are evolving, with subscription-based services and pay-by-course options becoming prevalent, offering consumers greater choice and accessibility. Leading companies are continuously innovating to capture market share by offering comprehensive workout libraries, expert-led sessions, and community-building features.

Online Fitness Services Market Size (In Billion)
The online fitness services market is poised for continued strong performance, driven by evolving consumer preferences and technological integration. While the market is expanding rapidly, certain restraints such as high competition, the need for consistent user engagement, and potential issues with data privacy and security need to be addressed by market players. However, the inherent advantages of online fitness, including cost-effectiveness compared to traditional gyms, wider accessibility, and the ability to exercise anytime, anywhere, are expected to outweigh these challenges. The market is also seeing a rise in niche offerings, catering to specific fitness goals, demographics, and preferences, such as yoga, HIIT, and strength training. Geographically, North America and Europe currently dominate the market, but the Asia Pacific region, with its large population and increasing internet penetration, presents significant untapped growth potential. As digital transformation continues to permeate all aspects of life, the online fitness services market is set to remain a vibrant and expanding segment of the global health and wellness industry.
Online Fitness Services Company Market Share
Online Fitness Services Market Concentration & Dynamics
The global online fitness services market, projected to reach approximately $250 billion by 2033, exhibits a dynamic concentration landscape characterized by the strategic maneuvers of major players and emerging innovators. The market is currently witnessing a moderate to high concentration, with companies like Peloton, TONE IT UP, and Daily Burn holding significant market share, estimated to be in the range of 15-20% for the top three. Innovation ecosystems are thriving, fueled by rapid technological advancements in wearable devices, AI-powered personalized training, and immersive virtual reality experiences. Regulatory frameworks, while still evolving, are primarily focused on data privacy and content authenticity, with minimal disruptive impact thus far. Substitute products, including traditional brick-and-mortar gyms and outdoor activities, continue to exist but their market share is steadily declining as convenience and accessibility of online platforms gain prominence. End-user trends reveal a strong preference for flexible subscription models and on-demand content, with a growing demand for specialized niche fitness programs. Merger and acquisition (M&A) activities are on the rise, with an estimated 50-75 significant deals expected between 2019 and 2033, as larger entities seek to consolidate market presence and acquire innovative technologies. Key M&A deal counts are projected to increase by approximately 10-15% annually.
Online Fitness Services Industry Insights & Trends
The online fitness services industry is poised for extraordinary growth, with an estimated market size of approximately $150 billion in the base year 2025, projected to expand at a robust Compound Annual Growth Rate (CAGR) of around 18-20% through the forecast period ending in 2033. This expansion is primarily driven by a confluence of escalating health consciousness among global populations, the unparalleled convenience offered by digital platforms, and the increasing affordability of internet access and smart devices. Technological disruptions are at the forefront of this evolution, with advancements in artificial intelligence (AI) enabling hyper-personalized workout plans, real-time form correction, and predictive health insights. The integration of virtual reality (VR) and augmented reality (AR) is revolutionizing the user experience, creating immersive and engaging fitness environments that mimic in-person classes. Furthermore, the proliferation of wearable technology, such as smartwatches and fitness trackers, provides valuable data that fuels personalized recommendations and progress tracking, fostering a deeper connection between users and their fitness journeys. Evolving consumer behaviors are characterized by a demand for flexibility, accessibility, and a strong sense of community, even in a virtual setting. Users are increasingly seeking specialized content tailored to specific fitness goals, such as weight loss, muscle gain, yoga, or high-intensity interval training (HIIT). The rise of gamification elements, leaderboards, and social sharing features further enhances user engagement and retention. The COVID-19 pandemic acted as a significant catalyst, accelerating the adoption of online fitness solutions and cementing their place in the mainstream. The market is also witnessing a growing segment of users seeking holistic wellness solutions, incorporating mental health and mindfulness practices alongside physical training. The study period from 2019 to 2033, with 2025 as the base year, illustrates a consistent upward trajectory, demonstrating the resilience and adaptability of the online fitness services sector. The historical period (2019-2024) laid the groundwork, with steady growth, while the forecast period (2025-2033) anticipates exponential expansion driven by ongoing innovation and shifting consumer paradigms.
Key Markets & Segments Leading Online Fitness Services
The global online fitness services market is witnessing significant dominance from specific regions and segments, driven by a complex interplay of economic growth, infrastructure development, and evolving consumer preferences.
Dominant Regions and Countries
While a comprehensive regional breakdown requires further analysis, North America and Europe are currently leading the market, largely due to high disposable incomes, widespread internet penetration, and a well-established culture of health and wellness. Asia-Pacific is emerging as a rapidly growing market, fueled by increasing urbanization, a burgeoning middle class, and a growing awareness of the benefits of regular physical activity. The economic growth in these regions, with GDP growth rates averaging between 2-4% annually, directly correlates with increased consumer spending on discretionary services like online fitness. Infrastructure development, particularly the expansion of high-speed internet and mobile networks, is a critical enabler, ensuring seamless access to streaming content and interactive features.
Application: Men and Women
Both Men and Women represent substantial user bases for online fitness services, with distinct preferences and engagement patterns.
- Women: Often gravitate towards online fitness for flexibility in scheduling, diverse class offerings (e.g., yoga, Pilates, dance fitness), and community-building features. Platforms offering guided meditations and holistic wellness programs also see high engagement from this segment.
- Men: Frequently seek structured training programs focused on strength building, HIIT, and performance enhancement. The convenience of fitting workouts into busy schedules is a key driver.
Types: Subscription and Pay by Course
The market is predominantly driven by the Subscription model, offering recurring revenue and fostering user loyalty.
- Subscription: This model, where users pay a recurring fee (monthly or annually) for access to a library of content and features, is the cornerstone of the online fitness industry. Companies like Peloton and Daily Burn have built their success on this model. Estimated subscription revenues are projected to reach over $200 billion by 2033. The average monthly subscription cost ranges from $10 to $50, depending on the breadth of services offered.
- Pay by Course: While less prevalent as a primary model, a "pay by course" or "pay per view" option caters to users seeking specific, one-off training sessions or specialized workshops. This segment is estimated to contribute approximately $10-15 billion to the overall market by 2033, appealing to those with highly specific, infrequent fitness needs.
Online Fitness Services Product Developments
Product developments in the online fitness services sector are primarily focused on enhancing user experience and engagement through technological innovation. Companies are integrating AI for personalized workout plans and real-time feedback, while VR/AR technologies are being deployed to create immersive and interactive training environments. The development of sophisticated wearable integration allows for seamless data tracking and personalized performance analytics. These advancements create a competitive edge by offering more engaging, effective, and convenient fitness solutions.
Challenges in the Online Fitness Services Market
Despite robust growth, the online fitness services market faces several challenges. Significant regulatory hurdles related to data privacy and content intellectual property can slow down innovation and market expansion. Supply chain issues, particularly for hardware components in connected fitness equipment, can impact product availability and pricing. Intense competitive pressures from established giants and nimble startups necessitate continuous innovation and strategic differentiation. The churn rate, estimated to be between 20-30% annually for subscription services, remains a persistent challenge, requiring effective customer retention strategies.
Forces Driving Online Fitness Services Growth
The exponential growth of online fitness services is propelled by several key drivers. Technological advancements, including AI-powered personalization and immersive VR/AR experiences, are transforming user engagement. Economic factors, such as increased disposable income and the growing demand for health and wellness solutions, are fueling market expansion. The ongoing digital transformation across industries has normalized online service consumption, making fitness platforms a natural extension. Furthermore, favorable regulatory environments that support digital innovation and data utilization, coupled with the increasing adoption of smart devices, are creating a fertile ground for growth.
Challenges in the Online Fitness Services Market
Long-term growth catalysts in the online fitness services market are rooted in continuous innovation and strategic market expansion. Emerging technologies, such as advanced biometrics and personalized nutrition integration, promise to offer more holistic wellness solutions. Strategic partnerships with healthcare providers, corporate wellness programs, and wearable device manufacturers can broaden reach and deepen customer engagement. Market expansion into underserved geographies and niche demographics will unlock new revenue streams. The focus on building strong online communities and fostering a sense of belonging will be crucial for sustained user retention.
Emerging Opportunities in Online Fitness Services
Emerging opportunities in online fitness services are abundant and varied. The growth of niche fitness modalities, such as functional training, adaptive fitness for individuals with disabilities, and prenatal/postnatal fitness, presents significant untapped potential. The integration of mental wellness and mindfulness content alongside physical training offers a holistic approach that resonates with a growing segment of consumers. The development of AI-driven virtual personal trainers that offer real-time, personalized coaching is a key frontier. Furthermore, the expansion of services into corporate wellness programs and partnerships with insurance providers can create substantial new revenue streams and user acquisition channels.
Leading Players in the Online Fitness Services Sector
- Peloton
- TONE IT UP
- ALL/OUT Studio
- Daily Burn
- Physique57
- Kayla Itsines
- CorePower Yoga
- Livekick
- Fitbit Coach
Key Milestones in Online Fitness Services Industry
- 2019: Increased adoption of AI for personalized training plans; launch of several new interactive fitness platforms.
- 2020: Accelerated growth due to the global pandemic, leading to a surge in at-home fitness solutions.
- 2021: Significant investment in VR/AR fitness experiences and connected fitness hardware.
- 2022: Focus on community building and social features within fitness apps; expansion of niche fitness offerings.
- 2023: Integration of advanced biometric tracking and wearable data for hyper-personalization.
- 2024: Increased M&A activity as larger players acquire innovative startups to expand their service portfolios.
Strategic Outlook for Online Fitness Services Market
The strategic outlook for the online fitness services market is exceptionally promising, driven by ongoing technological innovation and expanding consumer adoption. Future growth will be significantly accelerated by the continued integration of AI for hyper-personalized experiences, the development of more immersive VR/AR fitness content, and the expansion of holistic wellness offerings that incorporate mental health and nutrition. Strategic partnerships with healthcare providers and corporate wellness programs will be key to unlocking new market segments and revenue streams. The focus on building and nurturing strong online communities will remain critical for long-term customer retention and brand loyalty, ensuring continued market leadership and substantial future potential.
Online Fitness Services Segmentation
-
1. Application
- 1.1. Men
- 1.2. Women
-
2. Types
- 2.1. Subscription
- 2.2. Pay by Course
Online Fitness Services Segmentation By Geography
-
1. North America
- 1.1. United States
- 1.2. Canada
- 1.3. Mexico
-
2. South America
- 2.1. Brazil
- 2.2. Argentina
- 2.3. Rest of South America
-
3. Europe
- 3.1. United Kingdom
- 3.2. Germany
- 3.3. France
- 3.4. Italy
- 3.5. Spain
- 3.6. Russia
- 3.7. Benelux
- 3.8. Nordics
- 3.9. Rest of Europe
-
4. Middle East & Africa
- 4.1. Turkey
- 4.2. Israel
- 4.3. GCC
- 4.4. North Africa
- 4.5. South Africa
- 4.6. Rest of Middle East & Africa
-
5. Asia Pacific
- 5.1. China
- 5.2. India
- 5.3. Japan
- 5.4. South Korea
- 5.5. ASEAN
- 5.6. Oceania
- 5.7. Rest of Asia Pacific
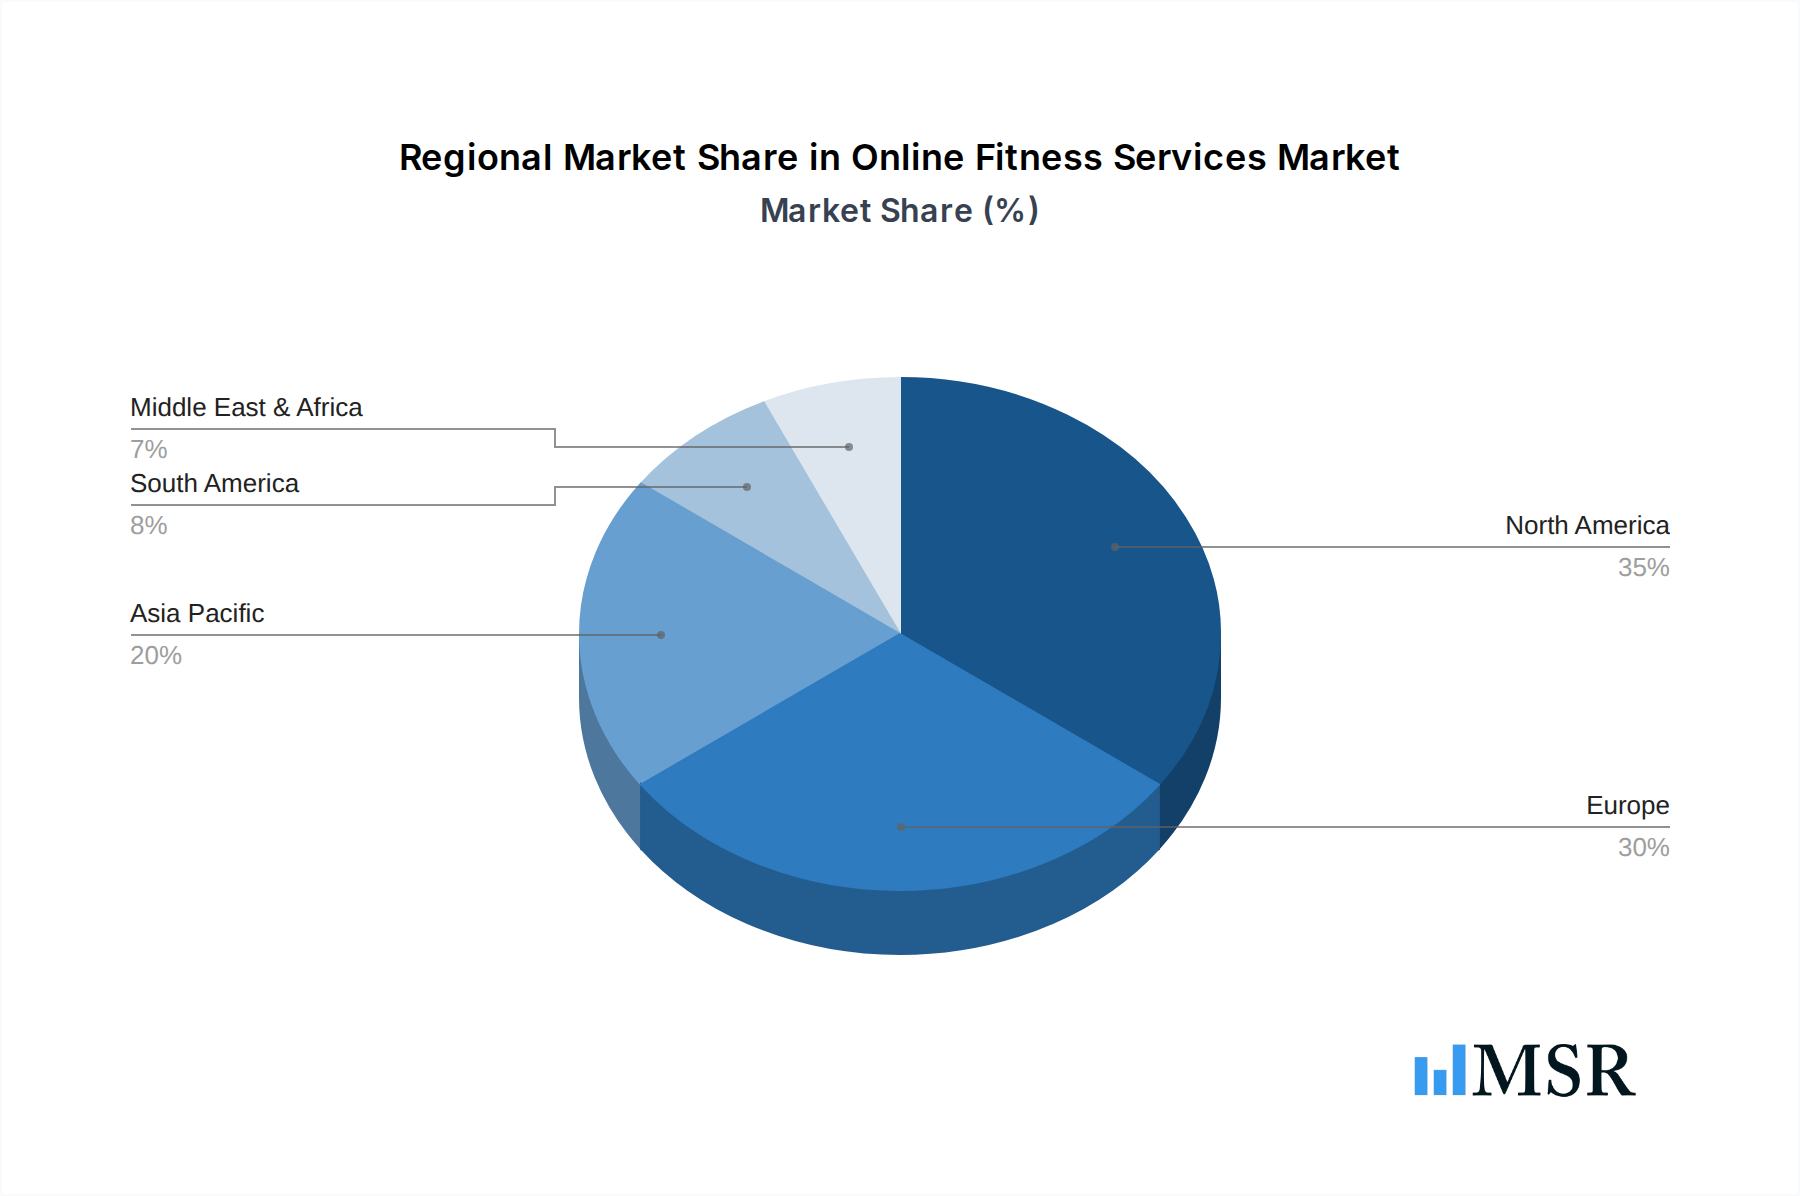
Online Fitness Services Regional Market Share
Geographic Coverage of Online Fitness Services
Online Fitness Services REPORT HIGHLIGHTS
| Aspects | Details |
|---|---|
| Study Period | 2020-2034 |
| Base Year | 2025 |
| Estimated Year | 2026 |
| Forecast Period | 2026-2034 |
| Historical Period | 2020-2025 |
| Growth Rate | CAGR of 17% from 2020-2034 |
| Segmentation |
|
Table of Contents
- 1. Introduction
- 1.1. Research Scope
- 1.2. Market Segmentation
- 1.3. Research Methodology
- 1.4. Definitions and Assumptions
- 2. Executive Summary
- 2.1. Introduction
- 3. Market Dynamics
- 3.1. Introduction
- 3.2. Market Drivers
- 3.3. Market Restrains
- 3.4. Market Trends
- 4. Market Factor Analysis
- 4.1. Porters Five Forces
- 4.2. Supply/Value Chain
- 4.3. PESTEL analysis
- 4.4. Market Entropy
- 4.5. Patent/Trademark Analysis
- 5. Global Online Fitness Services Analysis, Insights and Forecast, 2020-2032
- 5.1. Market Analysis, Insights and Forecast - by Application
- 5.1.1. Men
- 5.1.2. Women
- 5.2. Market Analysis, Insights and Forecast - by Types
- 5.2.1. Subscription
- 5.2.2. Pay by Course
- 5.3. Market Analysis, Insights and Forecast - by Region
- 5.3.1. North America
- 5.3.2. South America
- 5.3.3. Europe
- 5.3.4. Middle East & Africa
- 5.3.5. Asia Pacific
- 5.1. Market Analysis, Insights and Forecast - by Application
- 6. North America Online Fitness Services Analysis, Insights and Forecast, 2020-2032
- 6.1. Market Analysis, Insights and Forecast - by Application
- 6.1.1. Men
- 6.1.2. Women
- 6.2. Market Analysis, Insights and Forecast - by Types
- 6.2.1. Subscription
- 6.2.2. Pay by Course
- 6.1. Market Analysis, Insights and Forecast - by Application
- 7. South America Online Fitness Services Analysis, Insights and Forecast, 2020-2032
- 7.1. Market Analysis, Insights and Forecast - by Application
- 7.1.1. Men
- 7.1.2. Women
- 7.2. Market Analysis, Insights and Forecast - by Types
- 7.2.1. Subscription
- 7.2.2. Pay by Course
- 7.1. Market Analysis, Insights and Forecast - by Application
- 8. Europe Online Fitness Services Analysis, Insights and Forecast, 2020-2032
- 8.1. Market Analysis, Insights and Forecast - by Application
- 8.1.1. Men
- 8.1.2. Women
- 8.2. Market Analysis, Insights and Forecast - by Types
- 8.2.1. Subscription
- 8.2.2. Pay by Course
- 8.1. Market Analysis, Insights and Forecast - by Application
- 9. Middle East & Africa Online Fitness Services Analysis, Insights and Forecast, 2020-2032
- 9.1. Market Analysis, Insights and Forecast - by Application
- 9.1.1. Men
- 9.1.2. Women
- 9.2. Market Analysis, Insights and Forecast - by Types
- 9.2.1. Subscription
- 9.2.2. Pay by Course
- 9.1. Market Analysis, Insights and Forecast - by Application
- 10. Asia Pacific Online Fitness Services Analysis, Insights and Forecast, 2020-2032
- 10.1. Market Analysis, Insights and Forecast - by Application
- 10.1.1. Men
- 10.1.2. Women
- 10.2. Market Analysis, Insights and Forecast - by Types
- 10.2.1. Subscription
- 10.2.2. Pay by Course
- 10.1. Market Analysis, Insights and Forecast - by Application
- 11. Competitive Analysis
- 11.1. Global Market Share Analysis 2025
- 11.2. Company Profiles
- 11.2.1 Keep
- 11.2.1.1. Overview
- 11.2.1.2. Products
- 11.2.1.3. SWOT Analysis
- 11.2.1.4. Recent Developments
- 11.2.1.5. Financials (Based on Availability)
- 11.2.2 TONE IT UP
- 11.2.2.1. Overview
- 11.2.2.2. Products
- 11.2.2.3. SWOT Analysis
- 11.2.2.4. Recent Developments
- 11.2.2.5. Financials (Based on Availability)
- 11.2.3 ALL/OUT Studio
- 11.2.3.1. Overview
- 11.2.3.2. Products
- 11.2.3.3. SWOT Analysis
- 11.2.3.4. Recent Developments
- 11.2.3.5. Financials (Based on Availability)
- 11.2.4 Peloton
- 11.2.4.1. Overview
- 11.2.4.2. Products
- 11.2.4.3. SWOT Analysis
- 11.2.4.4. Recent Developments
- 11.2.4.5. Financials (Based on Availability)
- 11.2.5 Daily Burn
- 11.2.5.1. Overview
- 11.2.5.2. Products
- 11.2.5.3. SWOT Analysis
- 11.2.5.4. Recent Developments
- 11.2.5.5. Financials (Based on Availability)
- 11.2.6 Physique57
- 11.2.6.1. Overview
- 11.2.6.2. Products
- 11.2.6.3. SWOT Analysis
- 11.2.6.4. Recent Developments
- 11.2.6.5. Financials (Based on Availability)
- 11.2.7 Kayla Itsines
- 11.2.7.1. Overview
- 11.2.7.2. Products
- 11.2.7.3. SWOT Analysis
- 11.2.7.4. Recent Developments
- 11.2.7.5. Financials (Based on Availability)
- 11.2.8 CorePower Yoga
- 11.2.8.1. Overview
- 11.2.8.2. Products
- 11.2.8.3. SWOT Analysis
- 11.2.8.4. Recent Developments
- 11.2.8.5. Financials (Based on Availability)
- 11.2.9 Livekick
- 11.2.9.1. Overview
- 11.2.9.2. Products
- 11.2.9.3. SWOT Analysis
- 11.2.9.4. Recent Developments
- 11.2.9.5. Financials (Based on Availability)
- 11.2.10 Fitbit Coach
- 11.2.10.1. Overview
- 11.2.10.2. Products
- 11.2.10.3. SWOT Analysis
- 11.2.10.4. Recent Developments
- 11.2.10.5. Financials (Based on Availability)
- 11.2.1 Keep
List of Figures
- Figure 1: Global Online Fitness Services Revenue Breakdown (undefined, %) by Region 2025 & 2033
- Figure 2: North America Online Fitness Services Revenue (undefined), by Application 2025 & 2033
- Figure 3: North America Online Fitness Services Revenue Share (%), by Application 2025 & 2033
- Figure 4: North America Online Fitness Services Revenue (undefined), by Types 2025 & 2033
- Figure 5: North America Online Fitness Services Revenue Share (%), by Types 2025 & 2033
- Figure 6: North America Online Fitness Services Revenue (undefined), by Country 2025 & 2033
- Figure 7: North America Online Fitness Services Revenue Share (%), by Country 2025 & 2033
- Figure 8: South America Online Fitness Services Revenue (undefined), by Application 2025 & 2033
- Figure 9: South America Online Fitness Services Revenue Share (%), by Application 2025 & 2033
- Figure 10: South America Online Fitness Services Revenue (undefined), by Types 2025 & 2033
- Figure 11: South America Online Fitness Services Revenue Share (%), by Types 2025 & 2033
- Figure 12: South America Online Fitness Services Revenue (undefined), by Country 2025 & 2033
- Figure 13: South America Online Fitness Services Revenue Share (%), by Country 2025 & 2033
- Figure 14: Europe Online Fitness Services Revenue (undefined), by Application 2025 & 2033
- Figure 15: Europe Online Fitness Services Revenue Share (%), by Application 2025 & 2033
- Figure 16: Europe Online Fitness Services Revenue (undefined), by Types 2025 & 2033
- Figure 17: Europe Online Fitness Services Revenue Share (%), by Types 2025 & 2033
- Figure 18: Europe Online Fitness Services Revenue (undefined), by Country 2025 & 2033
- Figure 19: Europe Online Fitness Services Revenue Share (%), by Country 2025 & 2033
- Figure 20: Middle East & Africa Online Fitness Services Revenue (undefined), by Application 2025 & 2033
- Figure 21: Middle East & Africa Online Fitness Services Revenue Share (%), by Application 2025 & 2033
- Figure 22: Middle East & Africa Online Fitness Services Revenue (undefined), by Types 2025 & 2033
- Figure 23: Middle East & Africa Online Fitness Services Revenue Share (%), by Types 2025 & 2033
- Figure 24: Middle East & Africa Online Fitness Services Revenue (undefined), by Country 2025 & 2033
- Figure 25: Middle East & Africa Online Fitness Services Revenue Share (%), by Country 2025 & 2033
- Figure 26: Asia Pacific Online Fitness Services Revenue (undefined), by Application 2025 & 2033
- Figure 27: Asia Pacific Online Fitness Services Revenue Share (%), by Application 2025 & 2033
- Figure 28: Asia Pacific Online Fitness Services Revenue (undefined), by Types 2025 & 2033
- Figure 29: Asia Pacific Online Fitness Services Revenue Share (%), by Types 2025 & 2033
- Figure 30: Asia Pacific Online Fitness Services Revenue (undefined), by Country 2025 & 2033
- Figure 31: Asia Pacific Online Fitness Services Revenue Share (%), by Country 2025 & 2033
List of Tables
- Table 1: Global Online Fitness Services Revenue undefined Forecast, by Application 2020 & 2033
- Table 2: Global Online Fitness Services Revenue undefined Forecast, by Types 2020 & 2033
- Table 3: Global Online Fitness Services Revenue undefined Forecast, by Region 2020 & 2033
- Table 4: Global Online Fitness Services Revenue undefined Forecast, by Application 2020 & 2033
- Table 5: Global Online Fitness Services Revenue undefined Forecast, by Types 2020 & 2033
- Table 6: Global Online Fitness Services Revenue undefined Forecast, by Country 2020 & 2033
- Table 7: United States Online Fitness Services Revenue (undefined) Forecast, by Application 2020 & 2033
- Table 8: Canada Online Fitness Services Revenue (undefined) Forecast, by Application 2020 & 2033
- Table 9: Mexico Online Fitness Services Revenue (undefined) Forecast, by Application 2020 & 2033
- Table 10: Global Online Fitness Services Revenue undefined Forecast, by Application 2020 & 2033
- Table 11: Global Online Fitness Services Revenue undefined Forecast, by Types 2020 & 2033
- Table 12: Global Online Fitness Services Revenue undefined Forecast, by Country 2020 & 2033
- Table 13: Brazil Online Fitness Services Revenue (undefined) Forecast, by Application 2020 & 2033
- Table 14: Argentina Online Fitness Services Revenue (undefined) Forecast, by Application 2020 & 2033
- Table 15: Rest of South America Online Fitness Services Revenue (undefined) Forecast, by Application 2020 & 2033
- Table 16: Global Online Fitness Services Revenue undefined Forecast, by Application 2020 & 2033
- Table 17: Global Online Fitness Services Revenue undefined Forecast, by Types 2020 & 2033
- Table 18: Global Online Fitness Services Revenue undefined Forecast, by Country 2020 & 2033
- Table 19: United Kingdom Online Fitness Services Revenue (undefined) Forecast, by Application 2020 & 2033
- Table 20: Germany Online Fitness Services Revenue (undefined) Forecast, by Application 2020 & 2033
- Table 21: France Online Fitness Services Revenue (undefined) Forecast, by Application 2020 & 2033
- Table 22: Italy Online Fitness Services Revenue (undefined) Forecast, by Application 2020 & 2033
- Table 23: Spain Online Fitness Services Revenue (undefined) Forecast, by Application 2020 & 2033
- Table 24: Russia Online Fitness Services Revenue (undefined) Forecast, by Application 2020 & 2033
- Table 25: Benelux Online Fitness Services Revenue (undefined) Forecast, by Application 2020 & 2033
- Table 26: Nordics Online Fitness Services Revenue (undefined) Forecast, by Application 2020 & 2033
- Table 27: Rest of Europe Online Fitness Services Revenue (undefined) Forecast, by Application 2020 & 2033
- Table 28: Global Online Fitness Services Revenue undefined Forecast, by Application 2020 & 2033
- Table 29: Global Online Fitness Services Revenue undefined Forecast, by Types 2020 & 2033
- Table 30: Global Online Fitness Services Revenue undefined Forecast, by Country 2020 & 2033
- Table 31: Turkey Online Fitness Services Revenue (undefined) Forecast, by Application 2020 & 2033
- Table 32: Israel Online Fitness Services Revenue (undefined) Forecast, by Application 2020 & 2033
- Table 33: GCC Online Fitness Services Revenue (undefined) Forecast, by Application 2020 & 2033
- Table 34: North Africa Online Fitness Services Revenue (undefined) Forecast, by Application 2020 & 2033
- Table 35: South Africa Online Fitness Services Revenue (undefined) Forecast, by Application 2020 & 2033
- Table 36: Rest of Middle East & Africa Online Fitness Services Revenue (undefined) Forecast, by Application 2020 & 2033
- Table 37: Global Online Fitness Services Revenue undefined Forecast, by Application 2020 & 2033
- Table 38: Global Online Fitness Services Revenue undefined Forecast, by Types 2020 & 2033
- Table 39: Global Online Fitness Services Revenue undefined Forecast, by Country 2020 & 2033
- Table 40: China Online Fitness Services Revenue (undefined) Forecast, by Application 2020 & 2033
- Table 41: India Online Fitness Services Revenue (undefined) Forecast, by Application 2020 & 2033
- Table 42: Japan Online Fitness Services Revenue (undefined) Forecast, by Application 2020 & 2033
- Table 43: South Korea Online Fitness Services Revenue (undefined) Forecast, by Application 2020 & 2033
- Table 44: ASEAN Online Fitness Services Revenue (undefined) Forecast, by Application 2020 & 2033
- Table 45: Oceania Online Fitness Services Revenue (undefined) Forecast, by Application 2020 & 2033
- Table 46: Rest of Asia Pacific Online Fitness Services Revenue (undefined) Forecast, by Application 2020 & 2033
Frequently Asked Questions
1. What is the projected Compound Annual Growth Rate (CAGR) of the Online Fitness Services?
The projected CAGR is approximately 17%.
2. Which companies are prominent players in the Online Fitness Services?
Key companies in the market include Keep, TONE IT UP, ALL/OUT Studio, Peloton, Daily Burn, Physique57, Kayla Itsines, CorePower Yoga, Livekick, Fitbit Coach.
3. What are the main segments of the Online Fitness Services?
The market segments include Application, Types.
4. Can you provide details about the market size?
The market size is estimated to be USD XXX N/A as of 2022.
5. What are some drivers contributing to market growth?
N/A
6. What are the notable trends driving market growth?
N/A
7. Are there any restraints impacting market growth?
N/A
8. Can you provide examples of recent developments in the market?
N/A
9. What pricing options are available for accessing the report?
Pricing options include single-user, multi-user, and enterprise licenses priced at USD 4900.00, USD 7350.00, and USD 9800.00 respectively.
10. Is the market size provided in terms of value or volume?
The market size is provided in terms of value, measured in N/A.
11. Are there any specific market keywords associated with the report?
Yes, the market keyword associated with the report is "Online Fitness Services," which aids in identifying and referencing the specific market segment covered.
12. How do I determine which pricing option suits my needs best?
The pricing options vary based on user requirements and access needs. Individual users may opt for single-user licenses, while businesses requiring broader access may choose multi-user or enterprise licenses for cost-effective access to the report.
13. Are there any additional resources or data provided in the Online Fitness Services report?
While the report offers comprehensive insights, it's advisable to review the specific contents or supplementary materials provided to ascertain if additional resources or data are available.
14. How can I stay updated on further developments or reports in the Online Fitness Services?
To stay informed about further developments, trends, and reports in the Online Fitness Services, consider subscribing to industry newsletters, following relevant companies and organizations, or regularly checking reputable industry news sources and publications.
Methodology
Step 1 - Identification of Relevant Samples Size from Population Database


Step 2 - Approaches for Defining Global Market Size (Value, Volume* & Price*)

Note*: In applicable scenarios
Step 3 - Data Sources
Primary Research
- Web Analytics
- Survey Reports
- Research Institute
- Latest Research Reports
- Opinion Leaders
Secondary Research
- Annual Reports
- White Paper
- Latest Press Release
- Industry Association
- Paid Database
- Investor Presentations

Step 4 - Data Triangulation
Involves using different sources of information in order to increase the validity of a study
These sources are likely to be stakeholders in a program - participants, other researchers, program staff, other community members, and so on.
Then we put all data in single framework & apply various statistical tools to find out the dynamic on the market.
During the analysis stage, feedback from the stakeholder groups would be compared to determine areas of agreement as well as areas of divergence