

Key Insights
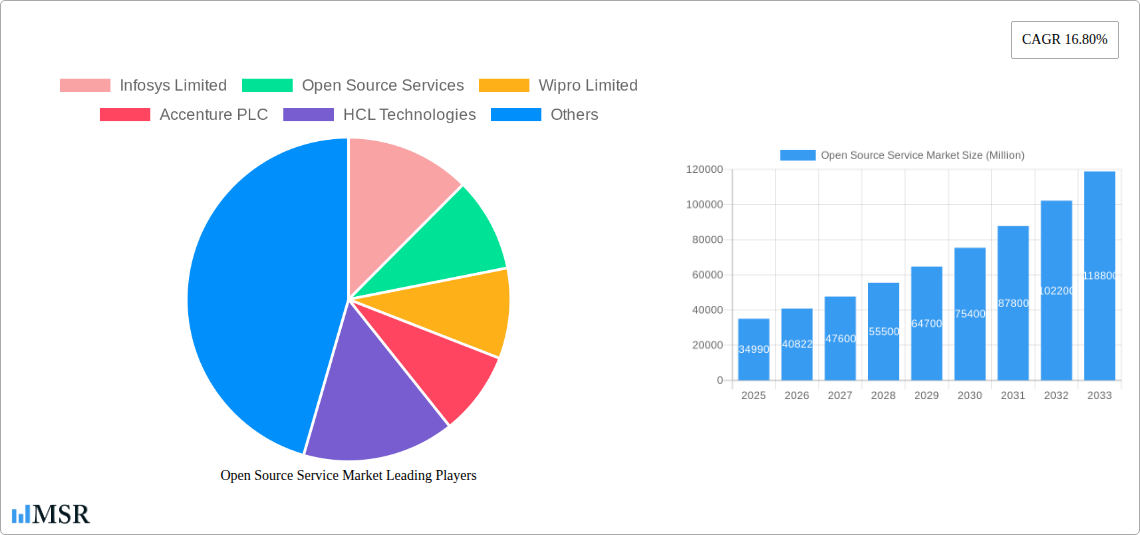
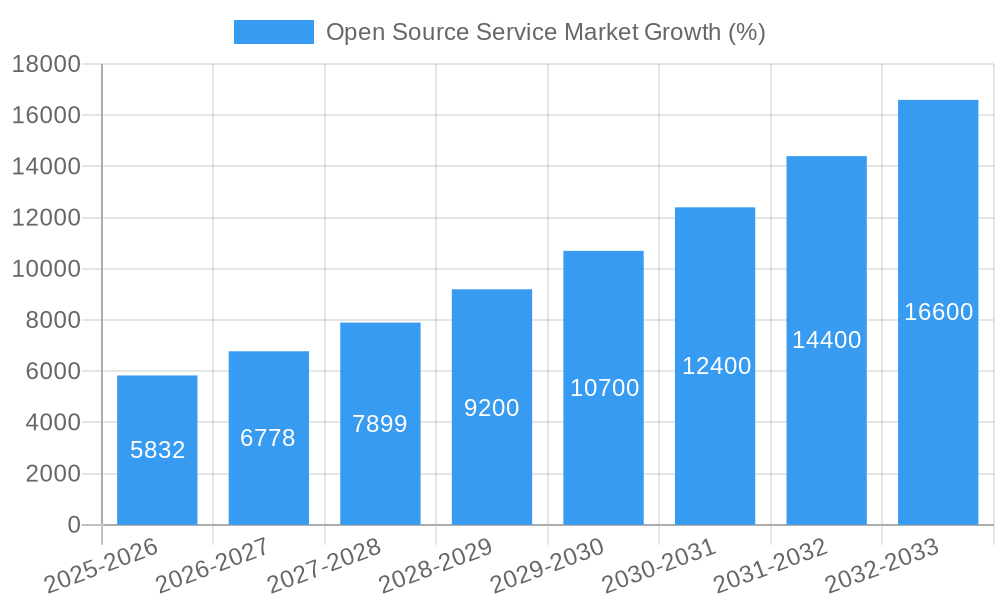
The Open Source Service market, valued at $34.99 billion in 2025, is projected to experience robust growth, exhibiting a Compound Annual Growth Rate (CAGR) of 16.80% from 2025 to 2033. This expansion is fueled by several key drivers. Firstly, the increasing adoption of open-source technologies across various industries, driven by cost-effectiveness and flexibility, is a significant catalyst. Businesses are increasingly leveraging open-source solutions to reduce licensing fees, enhance customization, and foster innovation. Secondly, the rising demand for cloud-based services and the growing popularity of DevOps methodologies are further propelling market growth. Open-source technologies are inherently well-suited for cloud deployment and agile development practices, making them an attractive choice for enterprises seeking scalability and speed. Finally, a growing community of developers actively contributing to and supporting open-source projects ensures continuous improvement and a rich ecosystem of tools and resources, bolstering its attractiveness.
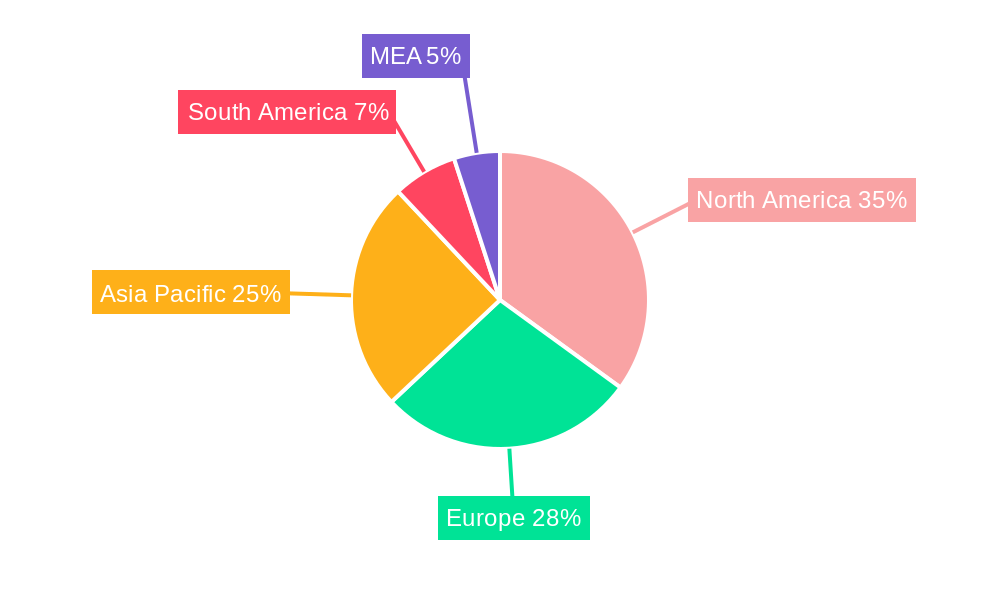
However, the market also faces certain restraints. Security concerns surrounding open-source software remain a significant challenge. While open-source code is generally transparent, ensuring its security and mitigating vulnerabilities requires rigorous testing and proactive patching. Additionally, the lack of dedicated support and the potential for integration complexities can deter some organizations, especially those with limited in-house expertise. Despite these challenges, the market's inherent advantages – cost-effectiveness, flexibility, and a large developer community – are expected to outweigh the limitations, resulting in sustained and significant growth throughout the forecast period. The diverse range of service types, including consulting, implementation, support, maintenance, training, and the broad application across various end-user industries (Banking, Financial Services, Insurance, Telecom, IT, Manufacturing, Government, Healthcare, Retail, and others) contribute to the market's expansive potential. The geographical distribution, with strong presence in North America and Europe and rapid growth in Asia-Pacific, further enhances the market's dynamism.
Open Source Service Market: A Comprehensive Report (2019-2033)
This in-depth report provides a comprehensive analysis of the Open Source Service market, offering invaluable insights for industry stakeholders, investors, and businesses seeking to navigate this dynamic landscape. Covering the period 2019-2033, with a focus on 2025, this report delivers actionable intelligence on market size, growth drivers, key players, and future trends. The market is projected to reach xx Million by 2033, exhibiting a CAGR of xx% during the forecast period (2025-2033).
Open Source Service Market Concentration & Dynamics
The Open Source Service market exhibits a moderately concentrated landscape, with key players like Infosys Limited, Wipro Limited, Accenture PLC, HCL Technologies, IBM Corporation, ATOS SE, Hewlett Packard Enterprise Company, Cisco Systems Inc, Red Hat Inc, and Oracle Corporation holding significant market share. Market share data for 2024 reveals that the top 5 players collectively hold approximately xx% of the market.
The market's dynamics are shaped by several factors:
- Innovation Ecosystems: Open-source communities foster rapid innovation, leading to frequent updates and new service offerings.
- Regulatory Frameworks: Government regulations concerning data privacy and security influence adoption rates and service offerings across various sectors.
- Substitute Products: Proprietary software solutions pose a competitive threat, although the cost-effectiveness and flexibility of open-source alternatives are key differentiators.
- End-User Trends: The increasing adoption of cloud computing and digital transformation initiatives fuels demand for open-source services.
- M&A Activities: The number of mergers and acquisitions in the sector has been steadily increasing, with xx deals recorded in the past 5 years, indicating a drive for consolidation and expansion. These activities are particularly focused on companies offering specialized services in areas like AI and machine learning.
Open Source Service Market Industry Insights & Trends
The Open Source Service market is experiencing robust growth, driven by several key factors. The market size reached xx Million in 2024 and is projected to expand significantly over the forecast period. This growth is primarily fueled by the increasing adoption of open-source technologies across various industries, the rising demand for cost-effective and flexible IT solutions, and the expanding cloud computing market. Technological advancements, particularly in areas like artificial intelligence (AI) and machine learning (ML), are further driving innovation and creating new opportunities within the open-source ecosystem. Consumer behavior shifts towards digitalization across industries are also creating new service demands. The overall market is witnessing a growing preference for open-source solutions over traditional proprietary software, leading to a surge in demand for related services. The growing complexity of IT infrastructure and the need for skilled professionals to manage and maintain open-source systems are also contributing to market growth.
Key Markets & Segments Leading Open Source Service Market
By Service Type:
- Consulting and Implementation Services: This segment dominates the market, driven by the increasing need for expert guidance in deploying and integrating open-source solutions. Factors like the complexity of open-source technologies and the requirement for skilled professionals drive demand.
- Support, Maintenance, and Management Services: The ongoing need for support, updates, and maintenance drives steady growth in this segment. Businesses prefer ongoing support to ensure smooth operation of open-source systems and minimize downtime.
- Training Services: The skill gap in managing open-source systems fuels demand for training services. Organizations are investing heavily in training their staff on open-source technologies.
By End-user Industry:
- Banking, Financial Services, and Insurance (BFSI): The BFSI sector is a key adopter, driven by the need for cost-effective and scalable solutions. The robust security and regulatory compliance aspects of open-source systems also contribute to its adoption.
- Telecom and IT: This segment shows high adoption due to the inherent flexibility and customization options offered by open-source technologies. The sector's rapid innovation cycle benefits from the collaborative nature of open-source development.
- Manufacturing: Increased automation and digital transformation in manufacturing drive the adoption of open-source solutions for improved operational efficiency. The need for scalable systems to manage large data sets is a key driver.
- Other segments, including Government, Healthcare, Retail, Transportation and Logistics, and Energy and Utilities, are also showing significant growth, albeit at varying rates, reflecting the broad applicability of open-source technologies. Government adoption is driven by cost efficiency and transparency initiatives, while Healthcare prioritizes data security and interoperability.
Open Source Service Market Product Developments
Recent product innovations have focused on integrating AI/ML capabilities into open-source service offerings, enhancing automation, and improving the overall user experience. The development of cloud-native open-source solutions and improved security features are key areas of focus for vendors. These advancements offer significant competitive advantages, particularly in terms of cost-effectiveness, scalability, and flexibility. The integration of DevOps practices further streamlines deployment and management processes.
Challenges in the Open Source Service Market Market
The market faces challenges such as the complexity of open-source technologies, requiring specialized expertise. Security concerns, particularly regarding vulnerabilities, necessitate robust security protocols. Competition from established proprietary software vendors and the need for skilled professionals create further pressure. These factors can influence the overall cost and time involved in implementing and maintaining open-source solutions. Supply chain disruptions can also impact the availability of required resources.
Forces Driving Open Source Service Market Growth
Key growth drivers include the increasing adoption of cloud computing, the demand for cost-effective solutions, and the growing need for flexible and customizable IT infrastructures. Technological advancements in AI/ML and improved security measures contribute to market expansion. Government initiatives promoting open-source technologies further boost market growth. The collaborative nature of open-source development, fostering innovation and community-driven improvements, is a significant driver.
Long-Term Growth Catalysts in Open Source Service Market
Long-term growth hinges on continued innovation, strategic partnerships among technology providers, and market expansion into new and emerging sectors. Investment in training and development programs to address the skill gap is crucial. Expanding into new geographic markets and extending service offerings into adjacent technologies will drive future growth.
Emerging Opportunities in Open Source Service Market
Emerging trends include the growing adoption of serverless computing, edge computing, and the Internet of Things (IoT). Opportunities lie in providing specialized open-source services catering to specific industry needs and integrating emerging technologies into existing open-source platforms. Focusing on niche markets and developing customized solutions will create growth avenues.
Leading Players in the Open Source Service Market Sector
- Infosys Limited
- Open Source Services
- Wipro Limited
- Accenture PLC
- HCL Technologies
- IBM Corporation
- ATOS SE
- Hewlett Packard Enterprise Company
- Cisco Systems Inc
- Red Hat Inc
- Oracle Corporation
Key Milestones in Open Source Service Market Industry
- 2020: Increased adoption of open-source solutions driven by the pandemic and remote work.
- 2021: Several major acquisitions in the open-source service space.
- 2022: Launch of several new open-source platforms focused on AI and ML.
- 2023: Growing emphasis on security and compliance within open-source service offerings.
- 2024: Expansion of open-source services into new industry verticals.
Strategic Outlook for Open Source Service Market Market
The Open Source Service market holds significant future potential, fueled by ongoing technological advancements and increasing demand for cost-effective, flexible, and secure IT solutions. Strategic opportunities lie in specializing in niche markets, forging strategic partnerships, and investing in research and development to stay ahead of the curve. Focusing on providing comprehensive service packages, including consulting, implementation, support, and training, will be crucial for success.
Open Source Service Market Segmentation
-
1. Service Type
- 1.1. Consulting and Implementation Services
- 1.2. Support, Maintenance, and Management Services
- 1.3. Training Services
-
2. End-user Industry
- 2.1. Banking, Financial Services, and Insurance
- 2.2. Telecom and IT
- 2.3. Manufacturing
- 2.4. Government
- 2.5. Healthcare
- 2.6. Retail
- 2.7. Others (
Open Source Service Market Segmentation By Geography
-
1. North America
- 1.1. United States
- 1.2. Canada
-
2. Europe
- 2.1. United Kingdom
- 2.2. Germany
- 2.3. France
- 2.4. Rest of the Europe
-
3. Asia Pacific
- 3.1. China
- 3.2. Japan
- 3.3. India
- 3.4. Rest of the Asia Pacific
- 4. Latin America
- 5. Middle East and Africa
Open Source Service Market REPORT HIGHLIGHTS
| Aspects | Details |
|---|---|
| Study Period | 2019-2033 |
| Base Year | 2024 |
| Estimated Year | 2025 |
| Forecast Period | 2025-2033 |
| Historical Period | 2019-2024 |
| Growth Rate | CAGR of 16.80% from 2019-2033 |
| Segmentation |
|
Table of Contents
- 1. Introduction
- 1.1. Research Scope
- 1.2. Market Segmentation
- 1.3. Research Methodology
- 1.4. Definitions and Assumptions
- 2. Executive Summary
- 2.1. Introduction
- 3. Market Dynamics
- 3.1. Introduction
- 3.2. Market Drivers
- 3.2.1. Reduced Cost of Ownership and Time to Market; Interoperability and Flexibility in Terms of Customization
- 3.3. Market Restrains
- 3.3.1. Security Issues
- 3.4. Market Trends
- 3.4.1. Emphasis on Reduced Cost of Ownership and Time to Market is Expected to Drive the Market Growth
- 4. Market Factor Analysis
- 4.1. Porters Five Forces
- 4.2. Supply/Value Chain
- 4.3. PESTEL analysis
- 4.4. Market Entropy
- 4.5. Patent/Trademark Analysis
- 5. Global Open Source Service Market Analysis, Insights and Forecast, 2019-2031
- 5.1. Market Analysis, Insights and Forecast - by Service Type
- 5.1.1. Consulting and Implementation Services
- 5.1.2. Support, Maintenance, and Management Services
- 5.1.3. Training Services
- 5.2. Market Analysis, Insights and Forecast - by End-user Industry
- 5.2.1. Banking, Financial Services, and Insurance
- 5.2.2. Telecom and IT
- 5.2.3. Manufacturing
- 5.2.4. Government
- 5.2.5. Healthcare
- 5.2.6. Retail
- 5.2.7. Others (
- 5.3. Market Analysis, Insights and Forecast - by Region
- 5.3.1. North America
- 5.3.2. Europe
- 5.3.3. Asia Pacific
- 5.3.4. Latin America
- 5.3.5. Middle East and Africa
- 5.1. Market Analysis, Insights and Forecast - by Service Type
- 6. North America Open Source Service Market Analysis, Insights and Forecast, 2019-2031
- 6.1. Market Analysis, Insights and Forecast - by Service Type
- 6.1.1. Consulting and Implementation Services
- 6.1.2. Support, Maintenance, and Management Services
- 6.1.3. Training Services
- 6.2. Market Analysis, Insights and Forecast - by End-user Industry
- 6.2.1. Banking, Financial Services, and Insurance
- 6.2.2. Telecom and IT
- 6.2.3. Manufacturing
- 6.2.4. Government
- 6.2.5. Healthcare
- 6.2.6. Retail
- 6.2.7. Others (
- 6.1. Market Analysis, Insights and Forecast - by Service Type
- 7. Europe Open Source Service Market Analysis, Insights and Forecast, 2019-2031
- 7.1. Market Analysis, Insights and Forecast - by Service Type
- 7.1.1. Consulting and Implementation Services
- 7.1.2. Support, Maintenance, and Management Services
- 7.1.3. Training Services
- 7.2. Market Analysis, Insights and Forecast - by End-user Industry
- 7.2.1. Banking, Financial Services, and Insurance
- 7.2.2. Telecom and IT
- 7.2.3. Manufacturing
- 7.2.4. Government
- 7.2.5. Healthcare
- 7.2.6. Retail
- 7.2.7. Others (
- 7.1. Market Analysis, Insights and Forecast - by Service Type
- 8. Asia Pacific Open Source Service Market Analysis, Insights and Forecast, 2019-2031
- 8.1. Market Analysis, Insights and Forecast - by Service Type
- 8.1.1. Consulting and Implementation Services
- 8.1.2. Support, Maintenance, and Management Services
- 8.1.3. Training Services
- 8.2. Market Analysis, Insights and Forecast - by End-user Industry
- 8.2.1. Banking, Financial Services, and Insurance
- 8.2.2. Telecom and IT
- 8.2.3. Manufacturing
- 8.2.4. Government
- 8.2.5. Healthcare
- 8.2.6. Retail
- 8.2.7. Others (
- 8.1. Market Analysis, Insights and Forecast - by Service Type
- 9. Latin America Open Source Service Market Analysis, Insights and Forecast, 2019-2031
- 9.1. Market Analysis, Insights and Forecast - by Service Type
- 9.1.1. Consulting and Implementation Services
- 9.1.2. Support, Maintenance, and Management Services
- 9.1.3. Training Services
- 9.2. Market Analysis, Insights and Forecast - by End-user Industry
- 9.2.1. Banking, Financial Services, and Insurance
- 9.2.2. Telecom and IT
- 9.2.3. Manufacturing
- 9.2.4. Government
- 9.2.5. Healthcare
- 9.2.6. Retail
- 9.2.7. Others (
- 9.1. Market Analysis, Insights and Forecast - by Service Type
- 10. Middle East and Africa Open Source Service Market Analysis, Insights and Forecast, 2019-2031
- 10.1. Market Analysis, Insights and Forecast - by Service Type
- 10.1.1. Consulting and Implementation Services
- 10.1.2. Support, Maintenance, and Management Services
- 10.1.3. Training Services
- 10.2. Market Analysis, Insights and Forecast - by End-user Industry
- 10.2.1. Banking, Financial Services, and Insurance
- 10.2.2. Telecom and IT
- 10.2.3. Manufacturing
- 10.2.4. Government
- 10.2.5. Healthcare
- 10.2.6. Retail
- 10.2.7. Others (
- 10.1. Market Analysis, Insights and Forecast - by Service Type
- 11. North America Open Source Service Market Analysis, Insights and Forecast, 2019-2031
- 11.1. Market Analysis, Insights and Forecast - By Country/Sub-region
- 11.1.1 United States
- 11.1.2 Canada
- 11.1.3 Mexico
- 12. Europe Open Source Service Market Analysis, Insights and Forecast, 2019-2031
- 12.1. Market Analysis, Insights and Forecast - By Country/Sub-region
- 12.1.1 Germany
- 12.1.2 United Kingdom
- 12.1.3 France
- 12.1.4 Spain
- 12.1.5 Italy
- 12.1.6 Spain
- 12.1.7 Belgium
- 12.1.8 Netherland
- 12.1.9 Nordics
- 12.1.10 Rest of Europe
- 13. Asia Pacific Open Source Service Market Analysis, Insights and Forecast, 2019-2031
- 13.1. Market Analysis, Insights and Forecast - By Country/Sub-region
- 13.1.1 China
- 13.1.2 Japan
- 13.1.3 India
- 13.1.4 South Korea
- 13.1.5 Southeast Asia
- 13.1.6 Australia
- 13.1.7 Indonesia
- 13.1.8 Phillipes
- 13.1.9 Singapore
- 13.1.10 Thailandc
- 13.1.11 Rest of Asia Pacific
- 14. South America Open Source Service Market Analysis, Insights and Forecast, 2019-2031
- 14.1. Market Analysis, Insights and Forecast - By Country/Sub-region
- 14.1.1 Brazil
- 14.1.2 Argentina
- 14.1.3 Peru
- 14.1.4 Chile
- 14.1.5 Colombia
- 14.1.6 Ecuador
- 14.1.7 Venezuela
- 14.1.8 Rest of South America
- 15. MEA Open Source Service Market Analysis, Insights and Forecast, 2019-2031
- 15.1. Market Analysis, Insights and Forecast - By Country/Sub-region
- 15.1.1 United Arab Emirates
- 15.1.2 Saudi Arabia
- 15.1.3 South Africa
- 15.1.4 Rest of Middle East and Africa
- 16. Competitive Analysis
- 16.1. Global Market Share Analysis 2024
- 16.2. Company Profiles
- 16.2.1 Infosys Limited
- 16.2.1.1. Overview
- 16.2.1.2. Products
- 16.2.1.3. SWOT Analysis
- 16.2.1.4. Recent Developments
- 16.2.1.5. Financials (Based on Availability)
- 16.2.2 Open Source Services
- 16.2.2.1. Overview
- 16.2.2.2. Products
- 16.2.2.3. SWOT Analysis
- 16.2.2.4. Recent Developments
- 16.2.2.5. Financials (Based on Availability)
- 16.2.3 Wipro Limited
- 16.2.3.1. Overview
- 16.2.3.2. Products
- 16.2.3.3. SWOT Analysis
- 16.2.3.4. Recent Developments
- 16.2.3.5. Financials (Based on Availability)
- 16.2.4 Accenture PLC
- 16.2.4.1. Overview
- 16.2.4.2. Products
- 16.2.4.3. SWOT Analysis
- 16.2.4.4. Recent Developments
- 16.2.4.5. Financials (Based on Availability)
- 16.2.5 HCL Technologies
- 16.2.5.1. Overview
- 16.2.5.2. Products
- 16.2.5.3. SWOT Analysis
- 16.2.5.4. Recent Developments
- 16.2.5.5. Financials (Based on Availability)
- 16.2.6 IBM Corporation
- 16.2.6.1. Overview
- 16.2.6.2. Products
- 16.2.6.3. SWOT Analysis
- 16.2.6.4. Recent Developments
- 16.2.6.5. Financials (Based on Availability)
- 16.2.7 ATOS SE
- 16.2.7.1. Overview
- 16.2.7.2. Products
- 16.2.7.3. SWOT Analysis
- 16.2.7.4. Recent Developments
- 16.2.7.5. Financials (Based on Availability)
- 16.2.8 Hewlett Packard Enterprise Company
- 16.2.8.1. Overview
- 16.2.8.2. Products
- 16.2.8.3. SWOT Analysis
- 16.2.8.4. Recent Developments
- 16.2.8.5. Financials (Based on Availability)
- 16.2.9 Cisco Systems Inc
- 16.2.9.1. Overview
- 16.2.9.2. Products
- 16.2.9.3. SWOT Analysis
- 16.2.9.4. Recent Developments
- 16.2.9.5. Financials (Based on Availability)
- 16.2.10 Red Hat Inc
- 16.2.10.1. Overview
- 16.2.10.2. Products
- 16.2.10.3. SWOT Analysis
- 16.2.10.4. Recent Developments
- 16.2.10.5. Financials (Based on Availability)
- 16.2.11 Oracle Corporation
- 16.2.11.1. Overview
- 16.2.11.2. Products
- 16.2.11.3. SWOT Analysis
- 16.2.11.4. Recent Developments
- 16.2.11.5. Financials (Based on Availability)
- 16.2.1 Infosys Limited
List of Figures
- Figure 1: Global Open Source Service Market Revenue Breakdown (Million, %) by Region 2024 & 2032
- Figure 2: North America Open Source Service Market Revenue (Million), by Country 2024 & 2032
- Figure 3: North America Open Source Service Market Revenue Share (%), by Country 2024 & 2032
- Figure 4: Europe Open Source Service Market Revenue (Million), by Country 2024 & 2032
- Figure 5: Europe Open Source Service Market Revenue Share (%), by Country 2024 & 2032
- Figure 6: Asia Pacific Open Source Service Market Revenue (Million), by Country 2024 & 2032
- Figure 7: Asia Pacific Open Source Service Market Revenue Share (%), by Country 2024 & 2032
- Figure 8: South America Open Source Service Market Revenue (Million), by Country 2024 & 2032
- Figure 9: South America Open Source Service Market Revenue Share (%), by Country 2024 & 2032
- Figure 10: MEA Open Source Service Market Revenue (Million), by Country 2024 & 2032
- Figure 11: MEA Open Source Service Market Revenue Share (%), by Country 2024 & 2032
- Figure 12: North America Open Source Service Market Revenue (Million), by Service Type 2024 & 2032
- Figure 13: North America Open Source Service Market Revenue Share (%), by Service Type 2024 & 2032
- Figure 14: North America Open Source Service Market Revenue (Million), by End-user Industry 2024 & 2032
- Figure 15: North America Open Source Service Market Revenue Share (%), by End-user Industry 2024 & 2032
- Figure 16: North America Open Source Service Market Revenue (Million), by Country 2024 & 2032
- Figure 17: North America Open Source Service Market Revenue Share (%), by Country 2024 & 2032
- Figure 18: Europe Open Source Service Market Revenue (Million), by Service Type 2024 & 2032
- Figure 19: Europe Open Source Service Market Revenue Share (%), by Service Type 2024 & 2032
- Figure 20: Europe Open Source Service Market Revenue (Million), by End-user Industry 2024 & 2032
- Figure 21: Europe Open Source Service Market Revenue Share (%), by End-user Industry 2024 & 2032
- Figure 22: Europe Open Source Service Market Revenue (Million), by Country 2024 & 2032
- Figure 23: Europe Open Source Service Market Revenue Share (%), by Country 2024 & 2032
- Figure 24: Asia Pacific Open Source Service Market Revenue (Million), by Service Type 2024 & 2032
- Figure 25: Asia Pacific Open Source Service Market Revenue Share (%), by Service Type 2024 & 2032
- Figure 26: Asia Pacific Open Source Service Market Revenue (Million), by End-user Industry 2024 & 2032
- Figure 27: Asia Pacific Open Source Service Market Revenue Share (%), by End-user Industry 2024 & 2032
- Figure 28: Asia Pacific Open Source Service Market Revenue (Million), by Country 2024 & 2032
- Figure 29: Asia Pacific Open Source Service Market Revenue Share (%), by Country 2024 & 2032
- Figure 30: Latin America Open Source Service Market Revenue (Million), by Service Type 2024 & 2032
- Figure 31: Latin America Open Source Service Market Revenue Share (%), by Service Type 2024 & 2032
- Figure 32: Latin America Open Source Service Market Revenue (Million), by End-user Industry 2024 & 2032
- Figure 33: Latin America Open Source Service Market Revenue Share (%), by End-user Industry 2024 & 2032
- Figure 34: Latin America Open Source Service Market Revenue (Million), by Country 2024 & 2032
- Figure 35: Latin America Open Source Service Market Revenue Share (%), by Country 2024 & 2032
- Figure 36: Middle East and Africa Open Source Service Market Revenue (Million), by Service Type 2024 & 2032
- Figure 37: Middle East and Africa Open Source Service Market Revenue Share (%), by Service Type 2024 & 2032
- Figure 38: Middle East and Africa Open Source Service Market Revenue (Million), by End-user Industry 2024 & 2032
- Figure 39: Middle East and Africa Open Source Service Market Revenue Share (%), by End-user Industry 2024 & 2032
- Figure 40: Middle East and Africa Open Source Service Market Revenue (Million), by Country 2024 & 2032
- Figure 41: Middle East and Africa Open Source Service Market Revenue Share (%), by Country 2024 & 2032
List of Tables
- Table 1: Global Open Source Service Market Revenue Million Forecast, by Region 2019 & 2032
- Table 2: Global Open Source Service Market Revenue Million Forecast, by Service Type 2019 & 2032
- Table 3: Global Open Source Service Market Revenue Million Forecast, by End-user Industry 2019 & 2032
- Table 4: Global Open Source Service Market Revenue Million Forecast, by Region 2019 & 2032
- Table 5: Global Open Source Service Market Revenue Million Forecast, by Country 2019 & 2032
- Table 6: United States Open Source Service Market Revenue (Million) Forecast, by Application 2019 & 2032
- Table 7: Canada Open Source Service Market Revenue (Million) Forecast, by Application 2019 & 2032
- Table 8: Mexico Open Source Service Market Revenue (Million) Forecast, by Application 2019 & 2032
- Table 9: Global Open Source Service Market Revenue Million Forecast, by Country 2019 & 2032
- Table 10: Germany Open Source Service Market Revenue (Million) Forecast, by Application 2019 & 2032
- Table 11: United Kingdom Open Source Service Market Revenue (Million) Forecast, by Application 2019 & 2032
- Table 12: France Open Source Service Market Revenue (Million) Forecast, by Application 2019 & 2032
- Table 13: Spain Open Source Service Market Revenue (Million) Forecast, by Application 2019 & 2032
- Table 14: Italy Open Source Service Market Revenue (Million) Forecast, by Application 2019 & 2032
- Table 15: Spain Open Source Service Market Revenue (Million) Forecast, by Application 2019 & 2032
- Table 16: Belgium Open Source Service Market Revenue (Million) Forecast, by Application 2019 & 2032
- Table 17: Netherland Open Source Service Market Revenue (Million) Forecast, by Application 2019 & 2032
- Table 18: Nordics Open Source Service Market Revenue (Million) Forecast, by Application 2019 & 2032
- Table 19: Rest of Europe Open Source Service Market Revenue (Million) Forecast, by Application 2019 & 2032
- Table 20: Global Open Source Service Market Revenue Million Forecast, by Country 2019 & 2032
- Table 21: China Open Source Service Market Revenue (Million) Forecast, by Application 2019 & 2032
- Table 22: Japan Open Source Service Market Revenue (Million) Forecast, by Application 2019 & 2032
- Table 23: India Open Source Service Market Revenue (Million) Forecast, by Application 2019 & 2032
- Table 24: South Korea Open Source Service Market Revenue (Million) Forecast, by Application 2019 & 2032
- Table 25: Southeast Asia Open Source Service Market Revenue (Million) Forecast, by Application 2019 & 2032
- Table 26: Australia Open Source Service Market Revenue (Million) Forecast, by Application 2019 & 2032
- Table 27: Indonesia Open Source Service Market Revenue (Million) Forecast, by Application 2019 & 2032
- Table 28: Phillipes Open Source Service Market Revenue (Million) Forecast, by Application 2019 & 2032
- Table 29: Singapore Open Source Service Market Revenue (Million) Forecast, by Application 2019 & 2032
- Table 30: Thailandc Open Source Service Market Revenue (Million) Forecast, by Application 2019 & 2032
- Table 31: Rest of Asia Pacific Open Source Service Market Revenue (Million) Forecast, by Application 2019 & 2032
- Table 32: Global Open Source Service Market Revenue Million Forecast, by Country 2019 & 2032
- Table 33: Brazil Open Source Service Market Revenue (Million) Forecast, by Application 2019 & 2032
- Table 34: Argentina Open Source Service Market Revenue (Million) Forecast, by Application 2019 & 2032
- Table 35: Peru Open Source Service Market Revenue (Million) Forecast, by Application 2019 & 2032
- Table 36: Chile Open Source Service Market Revenue (Million) Forecast, by Application 2019 & 2032
- Table 37: Colombia Open Source Service Market Revenue (Million) Forecast, by Application 2019 & 2032
- Table 38: Ecuador Open Source Service Market Revenue (Million) Forecast, by Application 2019 & 2032
- Table 39: Venezuela Open Source Service Market Revenue (Million) Forecast, by Application 2019 & 2032
- Table 40: Rest of South America Open Source Service Market Revenue (Million) Forecast, by Application 2019 & 2032
- Table 41: Global Open Source Service Market Revenue Million Forecast, by Country 2019 & 2032
- Table 42: United Arab Emirates Open Source Service Market Revenue (Million) Forecast, by Application 2019 & 2032
- Table 43: Saudi Arabia Open Source Service Market Revenue (Million) Forecast, by Application 2019 & 2032
- Table 44: South Africa Open Source Service Market Revenue (Million) Forecast, by Application 2019 & 2032
- Table 45: Rest of Middle East and Africa Open Source Service Market Revenue (Million) Forecast, by Application 2019 & 2032
- Table 46: Global Open Source Service Market Revenue Million Forecast, by Service Type 2019 & 2032
- Table 47: Global Open Source Service Market Revenue Million Forecast, by End-user Industry 2019 & 2032
- Table 48: Global Open Source Service Market Revenue Million Forecast, by Country 2019 & 2032
- Table 49: United States Open Source Service Market Revenue (Million) Forecast, by Application 2019 & 2032
- Table 50: Canada Open Source Service Market Revenue (Million) Forecast, by Application 2019 & 2032
- Table 51: Global Open Source Service Market Revenue Million Forecast, by Service Type 2019 & 2032
- Table 52: Global Open Source Service Market Revenue Million Forecast, by End-user Industry 2019 & 2032
- Table 53: Global Open Source Service Market Revenue Million Forecast, by Country 2019 & 2032
- Table 54: United Kingdom Open Source Service Market Revenue (Million) Forecast, by Application 2019 & 2032
- Table 55: Germany Open Source Service Market Revenue (Million) Forecast, by Application 2019 & 2032
- Table 56: France Open Source Service Market Revenue (Million) Forecast, by Application 2019 & 2032
- Table 57: Rest of the Europe Open Source Service Market Revenue (Million) Forecast, by Application 2019 & 2032
- Table 58: Global Open Source Service Market Revenue Million Forecast, by Service Type 2019 & 2032
- Table 59: Global Open Source Service Market Revenue Million Forecast, by End-user Industry 2019 & 2032
- Table 60: Global Open Source Service Market Revenue Million Forecast, by Country 2019 & 2032
- Table 61: China Open Source Service Market Revenue (Million) Forecast, by Application 2019 & 2032
- Table 62: Japan Open Source Service Market Revenue (Million) Forecast, by Application 2019 & 2032
- Table 63: India Open Source Service Market Revenue (Million) Forecast, by Application 2019 & 2032
- Table 64: Rest of the Asia Pacific Open Source Service Market Revenue (Million) Forecast, by Application 2019 & 2032
- Table 65: Global Open Source Service Market Revenue Million Forecast, by Service Type 2019 & 2032
- Table 66: Global Open Source Service Market Revenue Million Forecast, by End-user Industry 2019 & 2032
- Table 67: Global Open Source Service Market Revenue Million Forecast, by Country 2019 & 2032
- Table 68: Global Open Source Service Market Revenue Million Forecast, by Service Type 2019 & 2032
- Table 69: Global Open Source Service Market Revenue Million Forecast, by End-user Industry 2019 & 2032
- Table 70: Global Open Source Service Market Revenue Million Forecast, by Country 2019 & 2032
Frequently Asked Questions
1. What is the projected Compound Annual Growth Rate (CAGR) of the Open Source Service Market?
The projected CAGR is approximately 16.80%.
2. Which companies are prominent players in the Open Source Service Market?
Key companies in the market include Infosys Limited, Open Source Services, Wipro Limited, Accenture PLC, HCL Technologies, IBM Corporation, ATOS SE, Hewlett Packard Enterprise Company, Cisco Systems Inc, Red Hat Inc, Oracle Corporation.
3. What are the main segments of the Open Source Service Market?
The market segments include Service Type, End-user Industry.
4. Can you provide details about the market size?
The market size is estimated to be USD 34.99 Million as of 2022.
5. What are some drivers contributing to market growth?
Reduced Cost of Ownership and Time to Market; Interoperability and Flexibility in Terms of Customization.
6. What are the notable trends driving market growth?
Emphasis on Reduced Cost of Ownership and Time to Market is Expected to Drive the Market Growth.
7. Are there any restraints impacting market growth?
Security Issues.
8. Can you provide examples of recent developments in the market?
N/A
9. What pricing options are available for accessing the report?
Pricing options include single-user, multi-user, and enterprise licenses priced at USD 4750, USD 5250, and USD 8750 respectively.
10. Is the market size provided in terms of value or volume?
The market size is provided in terms of value, measured in Million.
11. Are there any specific market keywords associated with the report?
Yes, the market keyword associated with the report is "Open Source Service Market," which aids in identifying and referencing the specific market segment covered.
12. How do I determine which pricing option suits my needs best?
The pricing options vary based on user requirements and access needs. Individual users may opt for single-user licenses, while businesses requiring broader access may choose multi-user or enterprise licenses for cost-effective access to the report.
13. Are there any additional resources or data provided in the Open Source Service Market report?
While the report offers comprehensive insights, it's advisable to review the specific contents or supplementary materials provided to ascertain if additional resources or data are available.
14. How can I stay updated on further developments or reports in the Open Source Service Market?
To stay informed about further developments, trends, and reports in the Open Source Service Market, consider subscribing to industry newsletters, following relevant companies and organizations, or regularly checking reputable industry news sources and publications.
Methodology
Step 1 - Identification of Relevant Samples Size from Population Database


Step 2 - Approaches for Defining Global Market Size (Value, Volume* & Price*)

Note*: In applicable scenarios
Step 3 - Data Sources
Primary Research
- Web Analytics
- Survey Reports
- Research Institute
- Latest Research Reports
- Opinion Leaders
Secondary Research
- Annual Reports
- White Paper
- Latest Press Release
- Industry Association
- Paid Database
- Investor Presentations

Step 4 - Data Triangulation
Involves using different sources of information in order to increase the validity of a study
These sources are likely to be stakeholders in a program - participants, other researchers, program staff, other community members, and so on.
Then we put all data in single framework & apply various statistical tools to find out the dynamic on the market.
During the analysis stage, feedback from the stakeholder groups would be compared to determine areas of agreement as well as areas of divergence
