

Key Insights
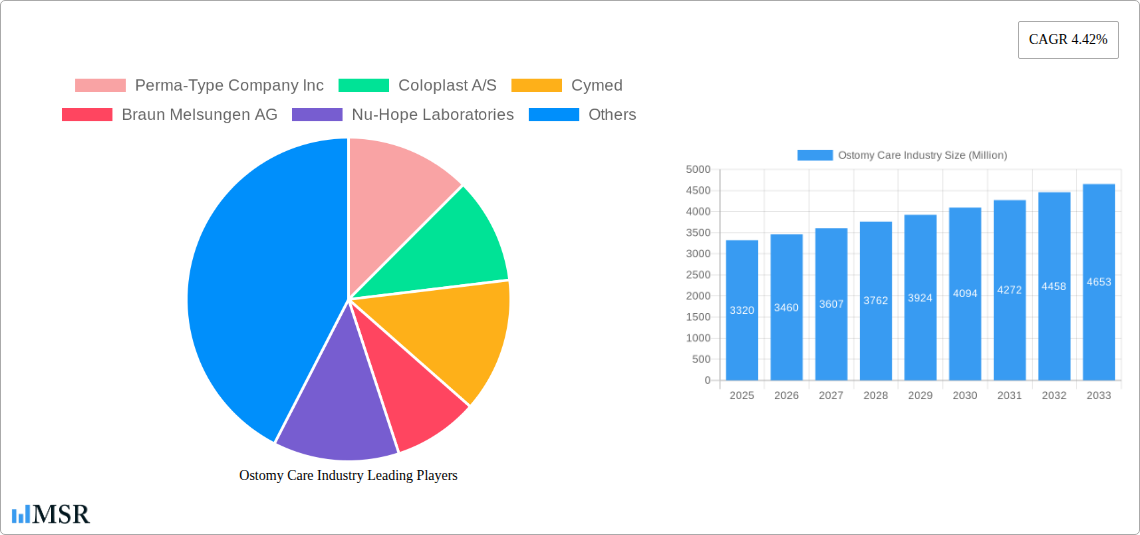
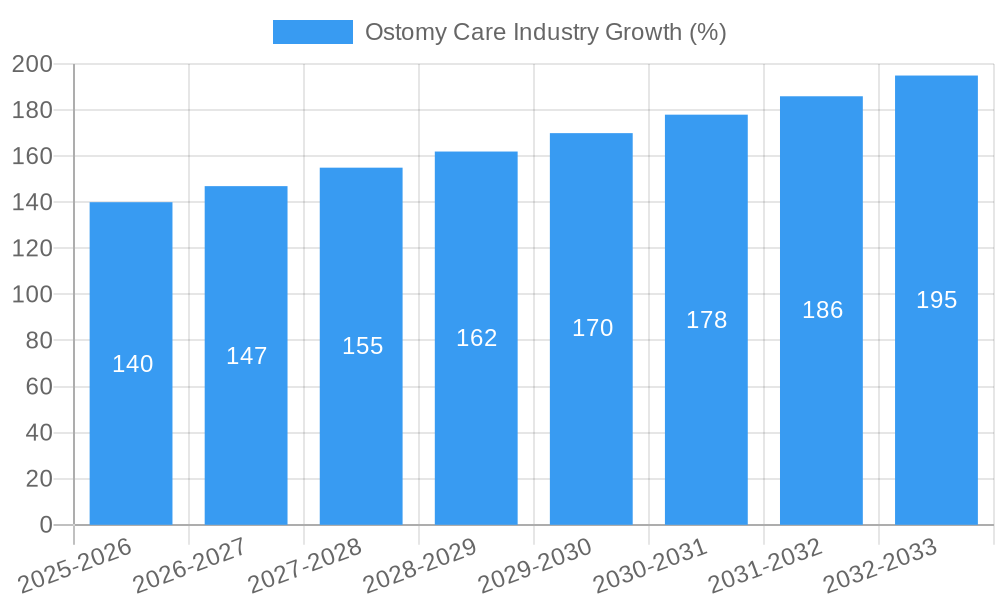
The ostomy care market, valued at $3.32 billion in 2025, is projected to experience robust growth, driven by rising prevalence of chronic diseases like colorectal cancer, inflammatory bowel disease (IBD), and diverticulitis necessitating ostomy surgeries. Technological advancements in ostomy products, such as improved adhesives, skin barrier materials, and more comfortable and discreet designs, are further fueling market expansion. The increasing geriatric population, coupled with a higher incidence of these chronic conditions in older adults, significantly contributes to market demand. Growth is also spurred by the shift towards minimally invasive surgical techniques, resulting in shorter hospital stays and a greater need for effective home care solutions. Demand for specialized ostomy care services and products is also increasing in emerging economies driven by rising healthcare expenditure and improved healthcare infrastructure. Furthermore, increasing awareness of ostomy care management amongst patients and healthcare providers enhances product adoption and improves patient outcomes.
However, high product costs, particularly for advanced ostomy appliances, remain a significant restraint. The market is also challenged by the complexities associated with ostomy care, requiring specialized training and ongoing patient education. Variations in healthcare reimbursement policies across regions also create market inconsistencies. Despite these challenges, the market's future looks optimistic, driven by consistent technological innovations focusing on improved product efficacy, comfort, and patient usability. The market segmentation – encompassing ostomy bags, accessories, various surgery types (colostomy, ileostomy, urostomy), and end-users (hospitals, home care, ambulatory surgical centers) – indicates diverse opportunities for growth across various segments. Strategic partnerships between manufacturers and healthcare providers to enhance patient access and support will play a crucial role in shaping future market trends.
Ostomy Care Industry Market Report: 2019-2033
This comprehensive report provides a detailed analysis of the global ostomy care market, projecting a market value exceeding $XX Billion by 2033. The study period covers 2019-2033, with 2025 as the base and estimated year. This report is invaluable for industry stakeholders, including manufacturers like Coloplast A/S, ConvaTec Group Plc, Hollister Inc, and Braun Melsungen AG, investors, and healthcare professionals.
Ostomy Care Industry Market Concentration & Dynamics
The ostomy care market exhibits a moderately concentrated structure, with a few major players holding significant market share. However, the presence of numerous smaller companies and emerging players fosters competition and innovation. Market share data for 2024 reveals that the top five companies collectively hold approximately 60% of the global market, while the remaining 40% is distributed across numerous smaller companies. The industry's dynamics are shaped by several factors:
- Innovation Ecosystems: Continuous advancements in ostomy bag materials, design, and accessories drive market growth. The development of innovative technologies like OstomyCure's TI,ES implant highlights this trend.
- Regulatory Frameworks: Stringent regulatory requirements for medical devices influence product development and market entry.
- Substitute Products: While limited, alternative solutions are constantly evolving, influencing market competitiveness.
- End-User Trends: The aging population and rising prevalence of diseases requiring ostomy surgery fuel market demand. Furthermore, a shift towards home-based care is also altering the market landscape.
- M&A Activities: The acquisition of Apria by Owens & Minor in January 2022 exemplifies the strategic consolidation happening within the industry, leading to an increase in market concentration and expansion of product portfolios. Over the past five years, there have been approximately xx M&A deals in the ostomy care sector.
Ostomy Care Industry Industry Insights & Trends
The global ostomy care market is experiencing substantial growth, driven by several factors. The market size reached $XX Billion in 2024 and is projected to grow at a CAGR of xx% during the forecast period (2025-2033). Key growth drivers include:
- Rising Prevalence of Chronic Diseases: The increasing incidence of colorectal cancer, inflammatory bowel disease, and other conditions necessitates ostomy surgery, fueling demand for related products and services.
- Technological Advancements: Innovations in materials, design, and technology are leading to more comfortable, discreet, and effective ostomy care solutions.
- Evolving Consumer Preferences: Patients are increasingly demanding improved comfort, convenience, and better skin protection, driving innovation in product development.
- Growth of Home Healthcare: The growing preference for home-based care is further expanding the market for ostomy care products and services.
Key Markets & Segments Leading Ostomy Care Industry
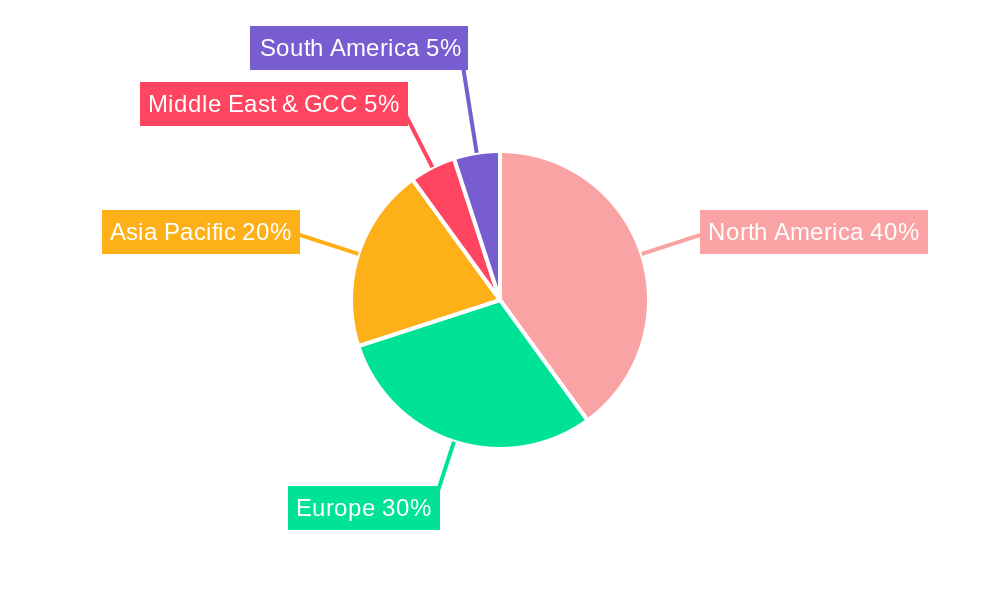
The North American market currently dominates the global ostomy care industry, followed by Europe and Asia Pacific. Within the segments:
- Product Type: Ostomy bags account for the largest market share, followed by ostomy accessories. The demand for advanced features, such as improved adhesion and skin protection, drives growth in both segments.
- Surgery Type: Colostomy holds the largest market share among the surgery types due to its higher prevalence. However, the market for ileostomy and urostomy products is also growing steadily.
- End User: Hospitals and specialty clinics are the leading end users, followed by home care settings and ambulatory surgical centers. The expansion of home healthcare is driving significant growth in this segment.
Drivers for Dominant Regions/Segments:
- North America: High healthcare expenditure, advanced medical infrastructure, and a sizeable patient population drive market growth.
- Europe: Similar to North America, the developed healthcare infrastructure and aging population contribute to high market demand.
- Ostomy Bags: High prevalence of diseases requiring ostomy surgery boosts demand.
- Hospitals and Specialty Clinics: High volume of ostomy surgeries and comprehensive care provided in these settings.
Ostomy Care Industry Product Developments
Recent advancements focus on enhancing patient comfort and safety. New products incorporate advanced materials for improved adhesion, skin protection, and leak prevention. The introduction of innovative technologies like OstomyCure's TI,ES implant represents a significant breakthrough, offering patients a new level of control and convenience. These advancements contribute to improved patient outcomes and increased market competitiveness.
Challenges in the Ostomy Care Industry Market
The ostomy care market faces several challenges:
- Stringent Regulatory Approvals: The rigorous approval processes for medical devices can delay product launches and increase development costs.
- Supply Chain Disruptions: Global supply chain issues can impact the availability of raw materials and finished products.
- Intense Competition: The presence of numerous established and emerging players creates significant competitive pressure.
Forces Driving Ostomy Care Industry Growth
Several factors propel market growth:
- Technological advancements: Innovation in materials, design, and delivery systems are continuously improving product efficacy and patient experience.
- Economic growth: Increased healthcare spending in developing economies stimulates demand for ostomy care products.
- Favorable regulatory environment: Supportive government policies and initiatives encourage market expansion.
Long-Term Growth Catalysts in the Ostomy Care Industry
Long-term growth hinges on:
Continuous innovation in ostomy care technologies, strategic partnerships and collaborations between manufacturers and healthcare providers, and expansion into emerging markets. These factors will collectively drive sustainable growth in the coming years.
Emerging Opportunities in Ostomy Care Industry
Emerging opportunities lie in:
- Personalized Ostomy Care: Tailored solutions based on individual patient needs.
- Telehealth Integration: Remote monitoring and virtual consultations for improved patient management.
- Expansion into Emerging Markets: Untapped potential in developing economies with rising healthcare spending.
Leading Players in the Ostomy Care Industry Sector
- Perma-Type Company Inc
- Coloplast A/S
- Cymed
- Braun Melsungen AG
- Nu-Hope Laboratories
- ConvaTec Group Plc
- Welland Medical Ltd
- Hollister Inc
- Marlen Manufacturing & Development Co
- ALCARE Co Ltd
- Torbot Group Inc
- Salts Healthcare
Key Milestones in Ostomy Care Industry Industry
- January 2023: OstomyCure completes patient recruitment for its TI,ES implant clinical trial.
- February 2022: HR Pharmaceuticals launches the Vitus Ostomy Care product line.
- January 2022: Owens & Minor acquires Apria, broadening its ostomy portfolio.
Strategic Outlook for Ostomy Care Industry Market
The ostomy care market presents substantial growth potential, driven by technological innovation, expanding patient populations, and increasing healthcare expenditure. Strategic partnerships, focused R&D, and targeted market expansion will be key to capitalizing on these opportunities and achieving long-term success within this dynamic market.
Ostomy Care Industry Segmentation
-
1. Product Type
- 1.1. Ostomy Bags
- 1.2. Ostomy Accessories
-
2. Surgery Type
- 2.1. Colostomy
- 2.2. Ileostomy
- 2.3. Urostomy
-
3. End User
- 3.1. Hospitals and Specialty clinics
- 3.2. Home care settings
- 3.3. Ambulatory Surgical Centers
Ostomy Care Industry Segmentation By Geography
-
1. North America
- 1.1. United States
- 1.2. Canada
- 1.3. Mexico
-
2. Europe
- 2.1. Germany
- 2.2. United Kingdom
- 2.3. France
- 2.4. Italy
- 2.5. Spain
- 2.6. Rest of Europe
-
3. Asia Pacific
- 3.1. China
- 3.2. Japan
- 3.3. India
- 3.4. Australia
- 3.5. South Korea
- 3.6. Rest of Asia Pacific
- 4. Middle East
-
5. GCC
- 5.1. South Africa
- 5.2. Rest of Middle East
-
6. South America
- 6.1. Brazil
- 6.2. Argentina
- 6.3. Rest of South America
Ostomy Care Industry REPORT HIGHLIGHTS
| Aspects | Details |
|---|---|
| Study Period | 2019-2033 |
| Base Year | 2024 |
| Estimated Year | 2025 |
| Forecast Period | 2025-2033 |
| Historical Period | 2019-2024 |
| Growth Rate | CAGR of 4.42% from 2019-2033 |
| Segmentation |
|
Table of Contents
- 1. Introduction
- 1.1. Research Scope
- 1.2. Market Segmentation
- 1.3. Research Methodology
- 1.4. Definitions and Assumptions
- 2. Executive Summary
- 2.1. Introduction
- 3. Market Dynamics
- 3.1. Introduction
- 3.2. Market Drivers
- 3.2.1. Growing Prevalence of Inflammatory Bowel Diseases; Technological Advancements in the Arena of Ostomy Care; Increase in Initiatives to Raise Ostomy Awareness
- 3.3. Market Restrains
- 3.3.1. Risk of Skin Irritation and Infections
- 3.4. Market Trends
- 3.4.1. Ostomy Bags Segment is Expected to Exhibit a Significant Market Growth Over the Forecast Period
- 4. Market Factor Analysis
- 4.1. Porters Five Forces
- 4.2. Supply/Value Chain
- 4.3. PESTEL analysis
- 4.4. Market Entropy
- 4.5. Patent/Trademark Analysis
- 5. Global Ostomy Care Industry Analysis, Insights and Forecast, 2019-2031
- 5.1. Market Analysis, Insights and Forecast - by Product Type
- 5.1.1. Ostomy Bags
- 5.1.2. Ostomy Accessories
- 5.2. Market Analysis, Insights and Forecast - by Surgery Type
- 5.2.1. Colostomy
- 5.2.2. Ileostomy
- 5.2.3. Urostomy
- 5.3. Market Analysis, Insights and Forecast - by End User
- 5.3.1. Hospitals and Specialty clinics
- 5.3.2. Home care settings
- 5.3.3. Ambulatory Surgical Centers
- 5.4. Market Analysis, Insights and Forecast - by Region
- 5.4.1. North America
- 5.4.2. Europe
- 5.4.3. Asia Pacific
- 5.4.4. Middle East
- 5.4.5. GCC
- 5.4.6. South America
- 5.1. Market Analysis, Insights and Forecast - by Product Type
- 6. North America Ostomy Care Industry Analysis, Insights and Forecast, 2019-2031
- 6.1. Market Analysis, Insights and Forecast - by Product Type
- 6.1.1. Ostomy Bags
- 6.1.2. Ostomy Accessories
- 6.2. Market Analysis, Insights and Forecast - by Surgery Type
- 6.2.1. Colostomy
- 6.2.2. Ileostomy
- 6.2.3. Urostomy
- 6.3. Market Analysis, Insights and Forecast - by End User
- 6.3.1. Hospitals and Specialty clinics
- 6.3.2. Home care settings
- 6.3.3. Ambulatory Surgical Centers
- 6.1. Market Analysis, Insights and Forecast - by Product Type
- 7. Europe Ostomy Care Industry Analysis, Insights and Forecast, 2019-2031
- 7.1. Market Analysis, Insights and Forecast - by Product Type
- 7.1.1. Ostomy Bags
- 7.1.2. Ostomy Accessories
- 7.2. Market Analysis, Insights and Forecast - by Surgery Type
- 7.2.1. Colostomy
- 7.2.2. Ileostomy
- 7.2.3. Urostomy
- 7.3. Market Analysis, Insights and Forecast - by End User
- 7.3.1. Hospitals and Specialty clinics
- 7.3.2. Home care settings
- 7.3.3. Ambulatory Surgical Centers
- 7.1. Market Analysis, Insights and Forecast - by Product Type
- 8. Asia Pacific Ostomy Care Industry Analysis, Insights and Forecast, 2019-2031
- 8.1. Market Analysis, Insights and Forecast - by Product Type
- 8.1.1. Ostomy Bags
- 8.1.2. Ostomy Accessories
- 8.2. Market Analysis, Insights and Forecast - by Surgery Type
- 8.2.1. Colostomy
- 8.2.2. Ileostomy
- 8.2.3. Urostomy
- 8.3. Market Analysis, Insights and Forecast - by End User
- 8.3.1. Hospitals and Specialty clinics
- 8.3.2. Home care settings
- 8.3.3. Ambulatory Surgical Centers
- 8.1. Market Analysis, Insights and Forecast - by Product Type
- 9. Middle East Ostomy Care Industry Analysis, Insights and Forecast, 2019-2031
- 9.1. Market Analysis, Insights and Forecast - by Product Type
- 9.1.1. Ostomy Bags
- 9.1.2. Ostomy Accessories
- 9.2. Market Analysis, Insights and Forecast - by Surgery Type
- 9.2.1. Colostomy
- 9.2.2. Ileostomy
- 9.2.3. Urostomy
- 9.3. Market Analysis, Insights and Forecast - by End User
- 9.3.1. Hospitals and Specialty clinics
- 9.3.2. Home care settings
- 9.3.3. Ambulatory Surgical Centers
- 9.1. Market Analysis, Insights and Forecast - by Product Type
- 10. GCC Ostomy Care Industry Analysis, Insights and Forecast, 2019-2031
- 10.1. Market Analysis, Insights and Forecast - by Product Type
- 10.1.1. Ostomy Bags
- 10.1.2. Ostomy Accessories
- 10.2. Market Analysis, Insights and Forecast - by Surgery Type
- 10.2.1. Colostomy
- 10.2.2. Ileostomy
- 10.2.3. Urostomy
- 10.3. Market Analysis, Insights and Forecast - by End User
- 10.3.1. Hospitals and Specialty clinics
- 10.3.2. Home care settings
- 10.3.3. Ambulatory Surgical Centers
- 10.1. Market Analysis, Insights and Forecast - by Product Type
- 11. South America Ostomy Care Industry Analysis, Insights and Forecast, 2019-2031
- 11.1. Market Analysis, Insights and Forecast - by Product Type
- 11.1.1. Ostomy Bags
- 11.1.2. Ostomy Accessories
- 11.2. Market Analysis, Insights and Forecast - by Surgery Type
- 11.2.1. Colostomy
- 11.2.2. Ileostomy
- 11.2.3. Urostomy
- 11.3. Market Analysis, Insights and Forecast - by End User
- 11.3.1. Hospitals and Specialty clinics
- 11.3.2. Home care settings
- 11.3.3. Ambulatory Surgical Centers
- 11.1. Market Analysis, Insights and Forecast - by Product Type
- 12. North America Ostomy Care Industry Analysis, Insights and Forecast, 2019-2031
- 12.1. Market Analysis, Insights and Forecast - By Country/Sub-region
- 12.1.1. undefined
- 13. Europe Ostomy Care Industry Analysis, Insights and Forecast, 2019-2031
- 13.1. Market Analysis, Insights and Forecast - By Country/Sub-region
- 13.1.1. undefined
- 14. Asia Pacific Ostomy Care Industry Analysis, Insights and Forecast, 2019-2031
- 14.1. Market Analysis, Insights and Forecast - By Country/Sub-region
- 14.1.1. undefined
- 15. Middle East Ostomy Care Industry Analysis, Insights and Forecast, 2019-2031
- 15.1. Market Analysis, Insights and Forecast - By Country/Sub-region
- 15.1.1. undefined
- 16. GCC Ostomy Care Industry Analysis, Insights and Forecast, 2019-2031
- 16.1. Market Analysis, Insights and Forecast - By Country/Sub-region
- 16.1.1. undefined
- 17. South America Ostomy Care Industry Analysis, Insights and Forecast, 2019-2031
- 17.1. Market Analysis, Insights and Forecast - By Country/Sub-region
- 17.1.1. undefined
- 18. Competitive Analysis
- 18.1. Global Market Share Analysis 2024
- 18.2. Company Profiles
- 18.2.1 Perma-Type Company Inc
- 18.2.1.1. Overview
- 18.2.1.2. Products
- 18.2.1.3. SWOT Analysis
- 18.2.1.4. Recent Developments
- 18.2.1.5. Financials (Based on Availability)
- 18.2.2 Coloplast A/S
- 18.2.2.1. Overview
- 18.2.2.2. Products
- 18.2.2.3. SWOT Analysis
- 18.2.2.4. Recent Developments
- 18.2.2.5. Financials (Based on Availability)
- 18.2.3 Cymed
- 18.2.3.1. Overview
- 18.2.3.2. Products
- 18.2.3.3. SWOT Analysis
- 18.2.3.4. Recent Developments
- 18.2.3.5. Financials (Based on Availability)
- 18.2.4 Braun Melsungen AG
- 18.2.4.1. Overview
- 18.2.4.2. Products
- 18.2.4.3. SWOT Analysis
- 18.2.4.4. Recent Developments
- 18.2.4.5. Financials (Based on Availability)
- 18.2.5 Nu-Hope Laboratories
- 18.2.5.1. Overview
- 18.2.5.2. Products
- 18.2.5.3. SWOT Analysis
- 18.2.5.4. Recent Developments
- 18.2.5.5. Financials (Based on Availability)
- 18.2.6 ConvaTec Group Plc
- 18.2.6.1. Overview
- 18.2.6.2. Products
- 18.2.6.3. SWOT Analysis
- 18.2.6.4. Recent Developments
- 18.2.6.5. Financials (Based on Availability)
- 18.2.7 Welland Medical Ltd
- 18.2.7.1. Overview
- 18.2.7.2. Products
- 18.2.7.3. SWOT Analysis
- 18.2.7.4. Recent Developments
- 18.2.7.5. Financials (Based on Availability)
- 18.2.8 Hollister Inc
- 18.2.8.1. Overview
- 18.2.8.2. Products
- 18.2.8.3. SWOT Analysis
- 18.2.8.4. Recent Developments
- 18.2.8.5. Financials (Based on Availability)
- 18.2.9 Marlen Manufacturing & Development Co
- 18.2.9.1. Overview
- 18.2.9.2. Products
- 18.2.9.3. SWOT Analysis
- 18.2.9.4. Recent Developments
- 18.2.9.5. Financials (Based on Availability)
- 18.2.10 ALCARE Co Ltd
- 18.2.10.1. Overview
- 18.2.10.2. Products
- 18.2.10.3. SWOT Analysis
- 18.2.10.4. Recent Developments
- 18.2.10.5. Financials (Based on Availability)
- 18.2.11 Torbot Group Inc
- 18.2.11.1. Overview
- 18.2.11.2. Products
- 18.2.11.3. SWOT Analysis
- 18.2.11.4. Recent Developments
- 18.2.11.5. Financials (Based on Availability)
- 18.2.12 Salts Healthcare
- 18.2.12.1. Overview
- 18.2.12.2. Products
- 18.2.12.3. SWOT Analysis
- 18.2.12.4. Recent Developments
- 18.2.12.5. Financials (Based on Availability)
- 18.2.1 Perma-Type Company Inc
List of Figures
- Figure 1: Global Ostomy Care Industry Revenue Breakdown (Million, %) by Region 2024 & 2032
- Figure 2: Global Ostomy Care Industry Volume Breakdown (K Unit, %) by Region 2024 & 2032
- Figure 3: North America Ostomy Care Industry Revenue (Million), by Country 2024 & 2032
- Figure 4: North America Ostomy Care Industry Volume (K Unit), by Country 2024 & 2032
- Figure 5: North America Ostomy Care Industry Revenue Share (%), by Country 2024 & 2032
- Figure 6: North America Ostomy Care Industry Volume Share (%), by Country 2024 & 2032
- Figure 7: Europe Ostomy Care Industry Revenue (Million), by Country 2024 & 2032
- Figure 8: Europe Ostomy Care Industry Volume (K Unit), by Country 2024 & 2032
- Figure 9: Europe Ostomy Care Industry Revenue Share (%), by Country 2024 & 2032
- Figure 10: Europe Ostomy Care Industry Volume Share (%), by Country 2024 & 2032
- Figure 11: Asia Pacific Ostomy Care Industry Revenue (Million), by Country 2024 & 2032
- Figure 12: Asia Pacific Ostomy Care Industry Volume (K Unit), by Country 2024 & 2032
- Figure 13: Asia Pacific Ostomy Care Industry Revenue Share (%), by Country 2024 & 2032
- Figure 14: Asia Pacific Ostomy Care Industry Volume Share (%), by Country 2024 & 2032
- Figure 15: Middle East Ostomy Care Industry Revenue (Million), by Country 2024 & 2032
- Figure 16: Middle East Ostomy Care Industry Volume (K Unit), by Country 2024 & 2032
- Figure 17: Middle East Ostomy Care Industry Revenue Share (%), by Country 2024 & 2032
- Figure 18: Middle East Ostomy Care Industry Volume Share (%), by Country 2024 & 2032
- Figure 19: GCC Ostomy Care Industry Revenue (Million), by Country 2024 & 2032
- Figure 20: GCC Ostomy Care Industry Volume (K Unit), by Country 2024 & 2032
- Figure 21: GCC Ostomy Care Industry Revenue Share (%), by Country 2024 & 2032
- Figure 22: GCC Ostomy Care Industry Volume Share (%), by Country 2024 & 2032
- Figure 23: South America Ostomy Care Industry Revenue (Million), by Country 2024 & 2032
- Figure 24: South America Ostomy Care Industry Volume (K Unit), by Country 2024 & 2032
- Figure 25: South America Ostomy Care Industry Revenue Share (%), by Country 2024 & 2032
- Figure 26: South America Ostomy Care Industry Volume Share (%), by Country 2024 & 2032
- Figure 27: North America Ostomy Care Industry Revenue (Million), by Product Type 2024 & 2032
- Figure 28: North America Ostomy Care Industry Volume (K Unit), by Product Type 2024 & 2032
- Figure 29: North America Ostomy Care Industry Revenue Share (%), by Product Type 2024 & 2032
- Figure 30: North America Ostomy Care Industry Volume Share (%), by Product Type 2024 & 2032
- Figure 31: North America Ostomy Care Industry Revenue (Million), by Surgery Type 2024 & 2032
- Figure 32: North America Ostomy Care Industry Volume (K Unit), by Surgery Type 2024 & 2032
- Figure 33: North America Ostomy Care Industry Revenue Share (%), by Surgery Type 2024 & 2032
- Figure 34: North America Ostomy Care Industry Volume Share (%), by Surgery Type 2024 & 2032
- Figure 35: North America Ostomy Care Industry Revenue (Million), by End User 2024 & 2032
- Figure 36: North America Ostomy Care Industry Volume (K Unit), by End User 2024 & 2032
- Figure 37: North America Ostomy Care Industry Revenue Share (%), by End User 2024 & 2032
- Figure 38: North America Ostomy Care Industry Volume Share (%), by End User 2024 & 2032
- Figure 39: North America Ostomy Care Industry Revenue (Million), by Country 2024 & 2032
- Figure 40: North America Ostomy Care Industry Volume (K Unit), by Country 2024 & 2032
- Figure 41: North America Ostomy Care Industry Revenue Share (%), by Country 2024 & 2032
- Figure 42: North America Ostomy Care Industry Volume Share (%), by Country 2024 & 2032
- Figure 43: Europe Ostomy Care Industry Revenue (Million), by Product Type 2024 & 2032
- Figure 44: Europe Ostomy Care Industry Volume (K Unit), by Product Type 2024 & 2032
- Figure 45: Europe Ostomy Care Industry Revenue Share (%), by Product Type 2024 & 2032
- Figure 46: Europe Ostomy Care Industry Volume Share (%), by Product Type 2024 & 2032
- Figure 47: Europe Ostomy Care Industry Revenue (Million), by Surgery Type 2024 & 2032
- Figure 48: Europe Ostomy Care Industry Volume (K Unit), by Surgery Type 2024 & 2032
- Figure 49: Europe Ostomy Care Industry Revenue Share (%), by Surgery Type 2024 & 2032
- Figure 50: Europe Ostomy Care Industry Volume Share (%), by Surgery Type 2024 & 2032
- Figure 51: Europe Ostomy Care Industry Revenue (Million), by End User 2024 & 2032
- Figure 52: Europe Ostomy Care Industry Volume (K Unit), by End User 2024 & 2032
- Figure 53: Europe Ostomy Care Industry Revenue Share (%), by End User 2024 & 2032
- Figure 54: Europe Ostomy Care Industry Volume Share (%), by End User 2024 & 2032
- Figure 55: Europe Ostomy Care Industry Revenue (Million), by Country 2024 & 2032
- Figure 56: Europe Ostomy Care Industry Volume (K Unit), by Country 2024 & 2032
- Figure 57: Europe Ostomy Care Industry Revenue Share (%), by Country 2024 & 2032
- Figure 58: Europe Ostomy Care Industry Volume Share (%), by Country 2024 & 2032
- Figure 59: Asia Pacific Ostomy Care Industry Revenue (Million), by Product Type 2024 & 2032
- Figure 60: Asia Pacific Ostomy Care Industry Volume (K Unit), by Product Type 2024 & 2032
- Figure 61: Asia Pacific Ostomy Care Industry Revenue Share (%), by Product Type 2024 & 2032
- Figure 62: Asia Pacific Ostomy Care Industry Volume Share (%), by Product Type 2024 & 2032
- Figure 63: Asia Pacific Ostomy Care Industry Revenue (Million), by Surgery Type 2024 & 2032
- Figure 64: Asia Pacific Ostomy Care Industry Volume (K Unit), by Surgery Type 2024 & 2032
- Figure 65: Asia Pacific Ostomy Care Industry Revenue Share (%), by Surgery Type 2024 & 2032
- Figure 66: Asia Pacific Ostomy Care Industry Volume Share (%), by Surgery Type 2024 & 2032
- Figure 67: Asia Pacific Ostomy Care Industry Revenue (Million), by End User 2024 & 2032
- Figure 68: Asia Pacific Ostomy Care Industry Volume (K Unit), by End User 2024 & 2032
- Figure 69: Asia Pacific Ostomy Care Industry Revenue Share (%), by End User 2024 & 2032
- Figure 70: Asia Pacific Ostomy Care Industry Volume Share (%), by End User 2024 & 2032
- Figure 71: Asia Pacific Ostomy Care Industry Revenue (Million), by Country 2024 & 2032
- Figure 72: Asia Pacific Ostomy Care Industry Volume (K Unit), by Country 2024 & 2032
- Figure 73: Asia Pacific Ostomy Care Industry Revenue Share (%), by Country 2024 & 2032
- Figure 74: Asia Pacific Ostomy Care Industry Volume Share (%), by Country 2024 & 2032
- Figure 75: Middle East Ostomy Care Industry Revenue (Million), by Product Type 2024 & 2032
- Figure 76: Middle East Ostomy Care Industry Volume (K Unit), by Product Type 2024 & 2032
- Figure 77: Middle East Ostomy Care Industry Revenue Share (%), by Product Type 2024 & 2032
- Figure 78: Middle East Ostomy Care Industry Volume Share (%), by Product Type 2024 & 2032
- Figure 79: Middle East Ostomy Care Industry Revenue (Million), by Surgery Type 2024 & 2032
- Figure 80: Middle East Ostomy Care Industry Volume (K Unit), by Surgery Type 2024 & 2032
- Figure 81: Middle East Ostomy Care Industry Revenue Share (%), by Surgery Type 2024 & 2032
- Figure 82: Middle East Ostomy Care Industry Volume Share (%), by Surgery Type 2024 & 2032
- Figure 83: Middle East Ostomy Care Industry Revenue (Million), by End User 2024 & 2032
- Figure 84: Middle East Ostomy Care Industry Volume (K Unit), by End User 2024 & 2032
- Figure 85: Middle East Ostomy Care Industry Revenue Share (%), by End User 2024 & 2032
- Figure 86: Middle East Ostomy Care Industry Volume Share (%), by End User 2024 & 2032
- Figure 87: Middle East Ostomy Care Industry Revenue (Million), by Country 2024 & 2032
- Figure 88: Middle East Ostomy Care Industry Volume (K Unit), by Country 2024 & 2032
- Figure 89: Middle East Ostomy Care Industry Revenue Share (%), by Country 2024 & 2032
- Figure 90: Middle East Ostomy Care Industry Volume Share (%), by Country 2024 & 2032
- Figure 91: GCC Ostomy Care Industry Revenue (Million), by Product Type 2024 & 2032
- Figure 92: GCC Ostomy Care Industry Volume (K Unit), by Product Type 2024 & 2032
- Figure 93: GCC Ostomy Care Industry Revenue Share (%), by Product Type 2024 & 2032
- Figure 94: GCC Ostomy Care Industry Volume Share (%), by Product Type 2024 & 2032
- Figure 95: GCC Ostomy Care Industry Revenue (Million), by Surgery Type 2024 & 2032
- Figure 96: GCC Ostomy Care Industry Volume (K Unit), by Surgery Type 2024 & 2032
- Figure 97: GCC Ostomy Care Industry Revenue Share (%), by Surgery Type 2024 & 2032
- Figure 98: GCC Ostomy Care Industry Volume Share (%), by Surgery Type 2024 & 2032
- Figure 99: GCC Ostomy Care Industry Revenue (Million), by End User 2024 & 2032
- Figure 100: GCC Ostomy Care Industry Volume (K Unit), by End User 2024 & 2032
- Figure 101: GCC Ostomy Care Industry Revenue Share (%), by End User 2024 & 2032
- Figure 102: GCC Ostomy Care Industry Volume Share (%), by End User 2024 & 2032
- Figure 103: GCC Ostomy Care Industry Revenue (Million), by Country 2024 & 2032
- Figure 104: GCC Ostomy Care Industry Volume (K Unit), by Country 2024 & 2032
- Figure 105: GCC Ostomy Care Industry Revenue Share (%), by Country 2024 & 2032
- Figure 106: GCC Ostomy Care Industry Volume Share (%), by Country 2024 & 2032
- Figure 107: South America Ostomy Care Industry Revenue (Million), by Product Type 2024 & 2032
- Figure 108: South America Ostomy Care Industry Volume (K Unit), by Product Type 2024 & 2032
- Figure 109: South America Ostomy Care Industry Revenue Share (%), by Product Type 2024 & 2032
- Figure 110: South America Ostomy Care Industry Volume Share (%), by Product Type 2024 & 2032
- Figure 111: South America Ostomy Care Industry Revenue (Million), by Surgery Type 2024 & 2032
- Figure 112: South America Ostomy Care Industry Volume (K Unit), by Surgery Type 2024 & 2032
- Figure 113: South America Ostomy Care Industry Revenue Share (%), by Surgery Type 2024 & 2032
- Figure 114: South America Ostomy Care Industry Volume Share (%), by Surgery Type 2024 & 2032
- Figure 115: South America Ostomy Care Industry Revenue (Million), by End User 2024 & 2032
- Figure 116: South America Ostomy Care Industry Volume (K Unit), by End User 2024 & 2032
- Figure 117: South America Ostomy Care Industry Revenue Share (%), by End User 2024 & 2032
- Figure 118: South America Ostomy Care Industry Volume Share (%), by End User 2024 & 2032
- Figure 119: South America Ostomy Care Industry Revenue (Million), by Country 2024 & 2032
- Figure 120: South America Ostomy Care Industry Volume (K Unit), by Country 2024 & 2032
- Figure 121: South America Ostomy Care Industry Revenue Share (%), by Country 2024 & 2032
- Figure 122: South America Ostomy Care Industry Volume Share (%), by Country 2024 & 2032
List of Tables
- Table 1: Global Ostomy Care Industry Revenue Million Forecast, by Region 2019 & 2032
- Table 2: Global Ostomy Care Industry Volume K Unit Forecast, by Region 2019 & 2032
- Table 3: Global Ostomy Care Industry Revenue Million Forecast, by Product Type 2019 & 2032
- Table 4: Global Ostomy Care Industry Volume K Unit Forecast, by Product Type 2019 & 2032
- Table 5: Global Ostomy Care Industry Revenue Million Forecast, by Surgery Type 2019 & 2032
- Table 6: Global Ostomy Care Industry Volume K Unit Forecast, by Surgery Type 2019 & 2032
- Table 7: Global Ostomy Care Industry Revenue Million Forecast, by End User 2019 & 2032
- Table 8: Global Ostomy Care Industry Volume K Unit Forecast, by End User 2019 & 2032
- Table 9: Global Ostomy Care Industry Revenue Million Forecast, by Region 2019 & 2032
- Table 10: Global Ostomy Care Industry Volume K Unit Forecast, by Region 2019 & 2032
- Table 11: Global Ostomy Care Industry Revenue Million Forecast, by Country 2019 & 2032
- Table 12: Global Ostomy Care Industry Volume K Unit Forecast, by Country 2019 & 2032
- Table 13: Global Ostomy Care Industry Revenue Million Forecast, by Country 2019 & 2032
- Table 14: Global Ostomy Care Industry Volume K Unit Forecast, by Country 2019 & 2032
- Table 15: Global Ostomy Care Industry Revenue Million Forecast, by Country 2019 & 2032
- Table 16: Global Ostomy Care Industry Volume K Unit Forecast, by Country 2019 & 2032
- Table 17: Global Ostomy Care Industry Revenue Million Forecast, by Country 2019 & 2032
- Table 18: Global Ostomy Care Industry Volume K Unit Forecast, by Country 2019 & 2032
- Table 19: Global Ostomy Care Industry Revenue Million Forecast, by Country 2019 & 2032
- Table 20: Global Ostomy Care Industry Volume K Unit Forecast, by Country 2019 & 2032
- Table 21: Global Ostomy Care Industry Revenue Million Forecast, by Country 2019 & 2032
- Table 22: Global Ostomy Care Industry Volume K Unit Forecast, by Country 2019 & 2032
- Table 23: Global Ostomy Care Industry Revenue Million Forecast, by Product Type 2019 & 2032
- Table 24: Global Ostomy Care Industry Volume K Unit Forecast, by Product Type 2019 & 2032
- Table 25: Global Ostomy Care Industry Revenue Million Forecast, by Surgery Type 2019 & 2032
- Table 26: Global Ostomy Care Industry Volume K Unit Forecast, by Surgery Type 2019 & 2032
- Table 27: Global Ostomy Care Industry Revenue Million Forecast, by End User 2019 & 2032
- Table 28: Global Ostomy Care Industry Volume K Unit Forecast, by End User 2019 & 2032
- Table 29: Global Ostomy Care Industry Revenue Million Forecast, by Country 2019 & 2032
- Table 30: Global Ostomy Care Industry Volume K Unit Forecast, by Country 2019 & 2032
- Table 31: United States Ostomy Care Industry Revenue (Million) Forecast, by Application 2019 & 2032
- Table 32: United States Ostomy Care Industry Volume (K Unit) Forecast, by Application 2019 & 2032
- Table 33: Canada Ostomy Care Industry Revenue (Million) Forecast, by Application 2019 & 2032
- Table 34: Canada Ostomy Care Industry Volume (K Unit) Forecast, by Application 2019 & 2032
- Table 35: Mexico Ostomy Care Industry Revenue (Million) Forecast, by Application 2019 & 2032
- Table 36: Mexico Ostomy Care Industry Volume (K Unit) Forecast, by Application 2019 & 2032
- Table 37: Global Ostomy Care Industry Revenue Million Forecast, by Product Type 2019 & 2032
- Table 38: Global Ostomy Care Industry Volume K Unit Forecast, by Product Type 2019 & 2032
- Table 39: Global Ostomy Care Industry Revenue Million Forecast, by Surgery Type 2019 & 2032
- Table 40: Global Ostomy Care Industry Volume K Unit Forecast, by Surgery Type 2019 & 2032
- Table 41: Global Ostomy Care Industry Revenue Million Forecast, by End User 2019 & 2032
- Table 42: Global Ostomy Care Industry Volume K Unit Forecast, by End User 2019 & 2032
- Table 43: Global Ostomy Care Industry Revenue Million Forecast, by Country 2019 & 2032
- Table 44: Global Ostomy Care Industry Volume K Unit Forecast, by Country 2019 & 2032
- Table 45: Germany Ostomy Care Industry Revenue (Million) Forecast, by Application 2019 & 2032
- Table 46: Germany Ostomy Care Industry Volume (K Unit) Forecast, by Application 2019 & 2032
- Table 47: United Kingdom Ostomy Care Industry Revenue (Million) Forecast, by Application 2019 & 2032
- Table 48: United Kingdom Ostomy Care Industry Volume (K Unit) Forecast, by Application 2019 & 2032
- Table 49: France Ostomy Care Industry Revenue (Million) Forecast, by Application 2019 & 2032
- Table 50: France Ostomy Care Industry Volume (K Unit) Forecast, by Application 2019 & 2032
- Table 51: Italy Ostomy Care Industry Revenue (Million) Forecast, by Application 2019 & 2032
- Table 52: Italy Ostomy Care Industry Volume (K Unit) Forecast, by Application 2019 & 2032
- Table 53: Spain Ostomy Care Industry Revenue (Million) Forecast, by Application 2019 & 2032
- Table 54: Spain Ostomy Care Industry Volume (K Unit) Forecast, by Application 2019 & 2032
- Table 55: Rest of Europe Ostomy Care Industry Revenue (Million) Forecast, by Application 2019 & 2032
- Table 56: Rest of Europe Ostomy Care Industry Volume (K Unit) Forecast, by Application 2019 & 2032
- Table 57: Global Ostomy Care Industry Revenue Million Forecast, by Product Type 2019 & 2032
- Table 58: Global Ostomy Care Industry Volume K Unit Forecast, by Product Type 2019 & 2032
- Table 59: Global Ostomy Care Industry Revenue Million Forecast, by Surgery Type 2019 & 2032
- Table 60: Global Ostomy Care Industry Volume K Unit Forecast, by Surgery Type 2019 & 2032
- Table 61: Global Ostomy Care Industry Revenue Million Forecast, by End User 2019 & 2032
- Table 62: Global Ostomy Care Industry Volume K Unit Forecast, by End User 2019 & 2032
- Table 63: Global Ostomy Care Industry Revenue Million Forecast, by Country 2019 & 2032
- Table 64: Global Ostomy Care Industry Volume K Unit Forecast, by Country 2019 & 2032
- Table 65: China Ostomy Care Industry Revenue (Million) Forecast, by Application 2019 & 2032
- Table 66: China Ostomy Care Industry Volume (K Unit) Forecast, by Application 2019 & 2032
- Table 67: Japan Ostomy Care Industry Revenue (Million) Forecast, by Application 2019 & 2032
- Table 68: Japan Ostomy Care Industry Volume (K Unit) Forecast, by Application 2019 & 2032
- Table 69: India Ostomy Care Industry Revenue (Million) Forecast, by Application 2019 & 2032
- Table 70: India Ostomy Care Industry Volume (K Unit) Forecast, by Application 2019 & 2032
- Table 71: Australia Ostomy Care Industry Revenue (Million) Forecast, by Application 2019 & 2032
- Table 72: Australia Ostomy Care Industry Volume (K Unit) Forecast, by Application 2019 & 2032
- Table 73: South Korea Ostomy Care Industry Revenue (Million) Forecast, by Application 2019 & 2032
- Table 74: South Korea Ostomy Care Industry Volume (K Unit) Forecast, by Application 2019 & 2032
- Table 75: Rest of Asia Pacific Ostomy Care Industry Revenue (Million) Forecast, by Application 2019 & 2032
- Table 76: Rest of Asia Pacific Ostomy Care Industry Volume (K Unit) Forecast, by Application 2019 & 2032
- Table 77: Global Ostomy Care Industry Revenue Million Forecast, by Product Type 2019 & 2032
- Table 78: Global Ostomy Care Industry Volume K Unit Forecast, by Product Type 2019 & 2032
- Table 79: Global Ostomy Care Industry Revenue Million Forecast, by Surgery Type 2019 & 2032
- Table 80: Global Ostomy Care Industry Volume K Unit Forecast, by Surgery Type 2019 & 2032
- Table 81: Global Ostomy Care Industry Revenue Million Forecast, by End User 2019 & 2032
- Table 82: Global Ostomy Care Industry Volume K Unit Forecast, by End User 2019 & 2032
- Table 83: Global Ostomy Care Industry Revenue Million Forecast, by Country 2019 & 2032
- Table 84: Global Ostomy Care Industry Volume K Unit Forecast, by Country 2019 & 2032
- Table 85: Global Ostomy Care Industry Revenue Million Forecast, by Product Type 2019 & 2032
- Table 86: Global Ostomy Care Industry Volume K Unit Forecast, by Product Type 2019 & 2032
- Table 87: Global Ostomy Care Industry Revenue Million Forecast, by Surgery Type 2019 & 2032
- Table 88: Global Ostomy Care Industry Volume K Unit Forecast, by Surgery Type 2019 & 2032
- Table 89: Global Ostomy Care Industry Revenue Million Forecast, by End User 2019 & 2032
- Table 90: Global Ostomy Care Industry Volume K Unit Forecast, by End User 2019 & 2032
- Table 91: Global Ostomy Care Industry Revenue Million Forecast, by Country 2019 & 2032
- Table 92: Global Ostomy Care Industry Volume K Unit Forecast, by Country 2019 & 2032
- Table 93: South Africa Ostomy Care Industry Revenue (Million) Forecast, by Application 2019 & 2032
- Table 94: South Africa Ostomy Care Industry Volume (K Unit) Forecast, by Application 2019 & 2032
- Table 95: Rest of Middle East Ostomy Care Industry Revenue (Million) Forecast, by Application 2019 & 2032
- Table 96: Rest of Middle East Ostomy Care Industry Volume (K Unit) Forecast, by Application 2019 & 2032
- Table 97: Global Ostomy Care Industry Revenue Million Forecast, by Product Type 2019 & 2032
- Table 98: Global Ostomy Care Industry Volume K Unit Forecast, by Product Type 2019 & 2032
- Table 99: Global Ostomy Care Industry Revenue Million Forecast, by Surgery Type 2019 & 2032
- Table 100: Global Ostomy Care Industry Volume K Unit Forecast, by Surgery Type 2019 & 2032
- Table 101: Global Ostomy Care Industry Revenue Million Forecast, by End User 2019 & 2032
- Table 102: Global Ostomy Care Industry Volume K Unit Forecast, by End User 2019 & 2032
- Table 103: Global Ostomy Care Industry Revenue Million Forecast, by Country 2019 & 2032
- Table 104: Global Ostomy Care Industry Volume K Unit Forecast, by Country 2019 & 2032
- Table 105: Brazil Ostomy Care Industry Revenue (Million) Forecast, by Application 2019 & 2032
- Table 106: Brazil Ostomy Care Industry Volume (K Unit) Forecast, by Application 2019 & 2032
- Table 107: Argentina Ostomy Care Industry Revenue (Million) Forecast, by Application 2019 & 2032
- Table 108: Argentina Ostomy Care Industry Volume (K Unit) Forecast, by Application 2019 & 2032
- Table 109: Rest of South America Ostomy Care Industry Revenue (Million) Forecast, by Application 2019 & 2032
- Table 110: Rest of South America Ostomy Care Industry Volume (K Unit) Forecast, by Application 2019 & 2032
Frequently Asked Questions
1. What is the projected Compound Annual Growth Rate (CAGR) of the Ostomy Care Industry?
The projected CAGR is approximately 4.42%.
2. Which companies are prominent players in the Ostomy Care Industry?
Key companies in the market include Perma-Type Company Inc, Coloplast A/S, Cymed, Braun Melsungen AG, Nu-Hope Laboratories, ConvaTec Group Plc, Welland Medical Ltd, Hollister Inc, Marlen Manufacturing & Development Co, ALCARE Co Ltd, Torbot Group Inc, Salts Healthcare.
3. What are the main segments of the Ostomy Care Industry?
The market segments include Product Type, Surgery Type, End User.
4. Can you provide details about the market size?
The market size is estimated to be USD 3.32 Million as of 2022.
5. What are some drivers contributing to market growth?
Growing Prevalence of Inflammatory Bowel Diseases; Technological Advancements in the Arena of Ostomy Care; Increase in Initiatives to Raise Ostomy Awareness.
6. What are the notable trends driving market growth?
Ostomy Bags Segment is Expected to Exhibit a Significant Market Growth Over the Forecast Period.
7. Are there any restraints impacting market growth?
Risk of Skin Irritation and Infections.
8. Can you provide examples of recent developments in the market?
January 2023: OstomyCure, announced the complete patient recruitment milestone in the clinical trial its proprietary innovative titanium port TI,ES implant technology. TIES is an innovative titanium port implant that can be implanted within the stoma and attached to a lid to effectively close and open the stoma.
9. What pricing options are available for accessing the report?
Pricing options include single-user, multi-user, and enterprise licenses priced at USD 4750, USD 5250, and USD 8750 respectively.
10. Is the market size provided in terms of value or volume?
The market size is provided in terms of value, measured in Million and volume, measured in K Unit.
11. Are there any specific market keywords associated with the report?
Yes, the market keyword associated with the report is "Ostomy Care Industry," which aids in identifying and referencing the specific market segment covered.
12. How do I determine which pricing option suits my needs best?
The pricing options vary based on user requirements and access needs. Individual users may opt for single-user licenses, while businesses requiring broader access may choose multi-user or enterprise licenses for cost-effective access to the report.
13. Are there any additional resources or data provided in the Ostomy Care Industry report?
While the report offers comprehensive insights, it's advisable to review the specific contents or supplementary materials provided to ascertain if additional resources or data are available.
14. How can I stay updated on further developments or reports in the Ostomy Care Industry?
To stay informed about further developments, trends, and reports in the Ostomy Care Industry, consider subscribing to industry newsletters, following relevant companies and organizations, or regularly checking reputable industry news sources and publications.
Methodology
Step 1 - Identification of Relevant Samples Size from Population Database


Step 2 - Approaches for Defining Global Market Size (Value, Volume* & Price*)

Note*: In applicable scenarios
Step 3 - Data Sources
Primary Research
- Web Analytics
- Survey Reports
- Research Institute
- Latest Research Reports
- Opinion Leaders
Secondary Research
- Annual Reports
- White Paper
- Latest Press Release
- Industry Association
- Paid Database
- Investor Presentations

Step 4 - Data Triangulation
Involves using different sources of information in order to increase the validity of a study
These sources are likely to be stakeholders in a program - participants, other researchers, program staff, other community members, and so on.
Then we put all data in single framework & apply various statistical tools to find out the dynamic on the market.
During the analysis stage, feedback from the stakeholder groups would be compared to determine areas of agreement as well as areas of divergence
